Milan OscillatorBill Williams Breakout Setup
I have referred to the man multiple times whether tweeting about him or writing a blog post. Now I want to relearn how breakout trading works, again. A while ago, my friend invited a bunch of us into a Zoom conference sharing us how his setup works for him. He reintroduced me to Bill Williams' indicators which looked like below.
The rules are simple:
Prices are moving away from Alligator, open and closed above the first time.
AC is twice consecutively at par with the direction.
AO is twice consecutively at par with the direction.
Entry on the third candle to be sure, or the second if you're willing to risk it.
The chart above is an example from the 4 hourly time-frame. Before going into any entry, to get a macro perspective, should check on these time-frames first:
Weekly
3 Days
Daily
Bonus points if monthly time-frame is also at par with the bias. Here are the charts for the larger time-frame.
It's been profitable trading with the above setup but then I have an itch to scratch. I wanted to have just a single oscillator instead of two to look at. It will enable me to make decisions faster and can use my brain juice to think about something else.
So I combined the two to create a new oscillator. I call it the `Milan Oscillator` in honor of my friend Patris who reintroduced me to Bill Williams yet again. Patris' favorite team is AC Milan, here's to you bro 🍺
Here are the same charts above with Milan Oscillator.
The rules are a bit different than the rules above:
No entry when the oscillator is gray, this means AC and AO are disagreeing.
Prices are moving away from Alligator, open and closed above the first time.
Oscillator is twice consecutively at par with the direction.
Entry on the third candle to be sure, or the second if you're willing to risk it.
On lower volume moves, prices will retest alligator, can be an entry if the retest fails.
Feedbacks are appreciated.
Cari dalam skrip untuk "williams"

Fractal Levels Monitor w/ Trade Lines (ChadAnt) v2Small update. Prevents the break candle from getting another signal after the first buy/sell signal detected.
1. Fractal Level Detection
The indicator identifies Fractals, which are simply a series of bars where the center bar has the highest high (Bearish Fractal) or the lowest low (Bullish Fractal) compared to a set number of bars on either side (determined by the "Fractal Period" input, usually 2 to 5 bars).
Bullish Fractal Level (Support): The indicator plots a horizontal line at the lowest low of the most recently formed Bullish Fractal.
Bearish Fractal Level (Resistance): It plots a horizontal line at the highest high of the most recently formed Bearish Fractal.
2. The "Cross Candle" Event
The core idea isn't to trade the fractal itself, but the reaction after the fractal level is broken.
When the price breaks and closes through the established Bullish Level (support) or Bearish Level (resistance), that bar is marked as the Cross Candle.
This Cross Candle's High and Low are saved. This is the "setup" for the trade.
3. The Trade Signal (Entry Trigger)
A trade is only taken when the price breaks the extreme (High or Low) of the Cross Candle.
Buy Signal: The trade is entered long if the price breaks above the High of the Cross Candle.
Sell Signal: The trade is entered short if the price breaks below the Low of the Cross Candle.

Fractal Levels Monitor w/ Trade Lines (ChadAnt)1. Fractal Level Detection
The indicator identifies Fractals, which are simply a series of bars where the center bar has the highest high (Bearish Fractal) or the lowest low (Bullish Fractal) compared to a set number of bars on either side (determined by the "Fractal Period" input, usually 2 to 5 bars).
Bullish Fractal Level (Support): The indicator plots a horizontal line at the lowest low of the most recently formed Bullish Fractal.
Bearish Fractal Level (Resistance): It plots a horizontal line at the highest high of the most recently formed Bearish Fractal.
2. The "Cross Candle" Event
The core idea isn't to trade the fractal itself, but the reaction after the fractal level is broken.
When the price breaks and closes through the established Bullish Level (support) or Bearish Level (resistance), that bar is marked as the Cross Candle.
This Cross Candle's High and Low are saved. This is the "setup" for the trade.
3. The Trade Signal (Entry Trigger)
A trade is only taken when the price breaks the extreme (High or Low) of the Cross Candle.
Buy Signal: The trade is entered long if the price breaks above the High of the Cross Candle.
Sell Signal: The trade is entered short if the price breaks below the Low of the Cross Candle.


Current Fractal High/Low (Dynamic)
This indicator dynamically tracks the most recent confirmed Fractal High and Fractal Low across any timeframe using custom left/right bar configurations.
🔍 Key Features:
Detects Fractal Highs and Lows based on user-defined pivot settings.
Draws a green line and label ("FH") at the most recent Fractal High.
Draws a red line and label ("FL") at the most recent Fractal Low.
All lines extend from the confirmation bar to the current candle.
Automatically removes old lines and labels for a clean, uncluttered chart.
🛠️ Customizable Inputs:
Left & Right bars for pivot sensitivity
Line width for visibility
📌 Use Cases:
Identifying structure shifts
Recognizing key swing points
Supporting liquidity and breakout strategies
💡 Fractals are confirmed only after the full formation of the pattern (left and right bars). This ensures reliability over reactivity.
This script is designed for intraday to swing traders who want a reliable way to visualize market turning points with minimal noise.

Correct Fractal Swings by CRYPTOFORThis indicator adjusts and enhances the normal 3-fractal swing. The author of this definition, uncle_travis, takes into account swings with the absorption of 3 candles and uses them as structure points.

Smaller Fractals (+ Transparency)Smaller Fractals (+ Transparency)
I find that fractals are super useful, but can visually clutter up the chart pretty quickly. Their opaqueness and just overall bigness can become a bit much.
As such, these are just like regular fractals, only smaller (pine script's`size.tiny` instead of the default `size.small`).
Also, you can set a transparency level to these little guys (default is 50%).
Simple, more polite, and hopefully more useful fractals for those wnting a cleaner looking chart. 😁

DMI RSI AO 3 indicators in 1 overlayThis is simple indicators that plot 3 indicators DMI, RSI and AO on 1 pane
How to use: you can add on your chart and edit color and display in setting page of indicators
The directional movement index (DMI) is an indicator developed by J. Welles Wilder in 1978 that identifies in which direction the price of an asset is moving. The indicator does this by comparing prior highs and lows and drawing two lines: a positive directional movement line (+DI) and a negative directional movement line (-DI). An optional third line, called the average directional index (ADX), can also be used to gauge the strength of the uptrend or downtrend.
When +DI is above -DI, there is more upward pressure than downward pressure in the price. Conversely, if -DI is above +DI, then there is more downward pressure on the price. This indicator may help traders assess the trend direction. Crossovers between the lines are also sometimes used as trade signals to buy or sell.
The relative strength index (RSI) is a momentum indicator used in technical analysis that measures the magnitude of recent price changes to evaluate overbought or oversold conditions in the price of a stock or other asset. The RSI is displayed as an oscillator (a line graph that moves between two extremes) and can have a reading from 0 to 100. The indicator was originally developed by J. Welles Wilder Jr. and introduced in his seminal 1978 book, “New Concepts in Technical Trading Systems.”1
Traditional interpretation and usage of the RSI are that values of 70 or above indicate that a security is becoming overbought or overvalued and may be primed for a trend reversal or corrective pullback in price. An RSI reading of 30 or below indicates an oversold or undervalued condition.
Awesome Oscillator is developed by famous technical analyst and charting enthusiast Bill Williams. Awesome Oscillator (AO) is an indicator that is non-limiting oscillator, providing insight into the weakness or the strength of a stock. The Awesome Oscillator is used to measure market momentum and to affirm trends or to anticipate possible reversals. It does this by effectively comparing the recent market momentum, with the general momentum over a wider frame of reference.

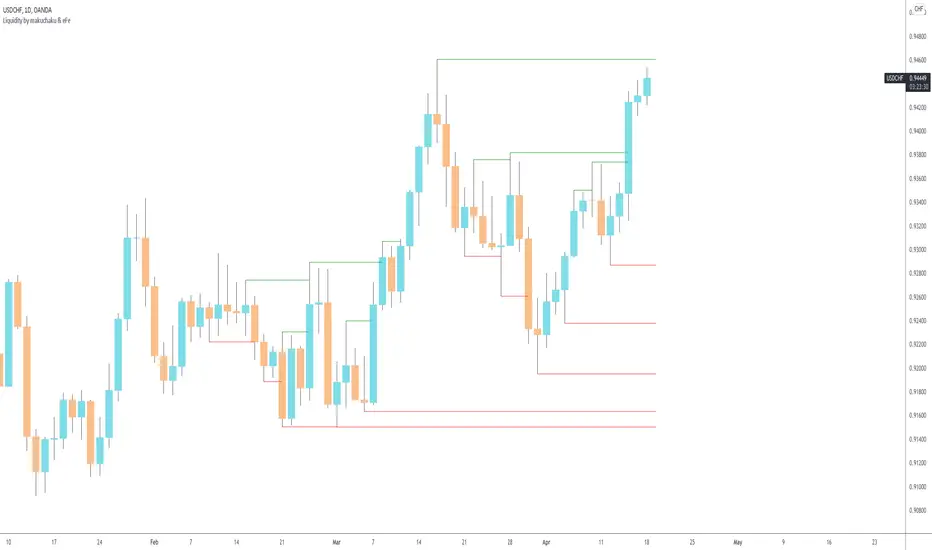
Makuchaku's trading tools - Liquidity visualizerThis indicator plots those pivots/fractals which have not been taken out by price, whereby showing where are the clusters of highs/lows where stop orders (or liquidity) could be hiding.
This is a fantastic tool for taking reversal trades.
Forex Fractal EMA ScalperThis is a forex scalper designed for very short timeframes 1-5 min max.
At the same time due to the short timeframe, is recommend to re optimize it weekly .
Its components are
Fractals
Triple EMA with different lengths
Rules for entry:
For long : we have an up fractal and all 3 ema are in ascending order
For short: we have a down fractal and all 3 ema are in descending order.
Rules for exit
We exit when we either get a reverse order or when we hit the take profit or stop loss calculated in fixed pips.

RSI Centered PivotsJust a simple RSI central pivot strategy I made for a friend.
Backtested on BYBIT:BTCUSD, 155m.
DISCLAIMER : Please do your own research into anything you use before using it to trade.

Ehlers Relative Vigor Index [CC]The Relative Vigor Index was created by John Ehlers (Cybernetic Analysis For Stocks And Futures pg 58) and this is a momentum indicator that is similar to the Accumulation Distribution Oscillator created by Jim Waters and Larry Williams. He uses digital signal processing to smooth the indicator to provide clear buy and sell signals. The idea behind this indicator is that during uptrends, prices tend to close near the high and during downtrends, prices tend to close near the low. I have included strong buy and sell signals in addition to normal ones so strong signals are darker in color and normal ones are lighter in color. Buy when the line turns green and sell when it turns red. Usually the best signals I have found for this indicator is when the indicator is below the 0 line and turns green then it is usually a sign of a strong uptrend.
Let me know if there are any other scripts you would like to see me publish!

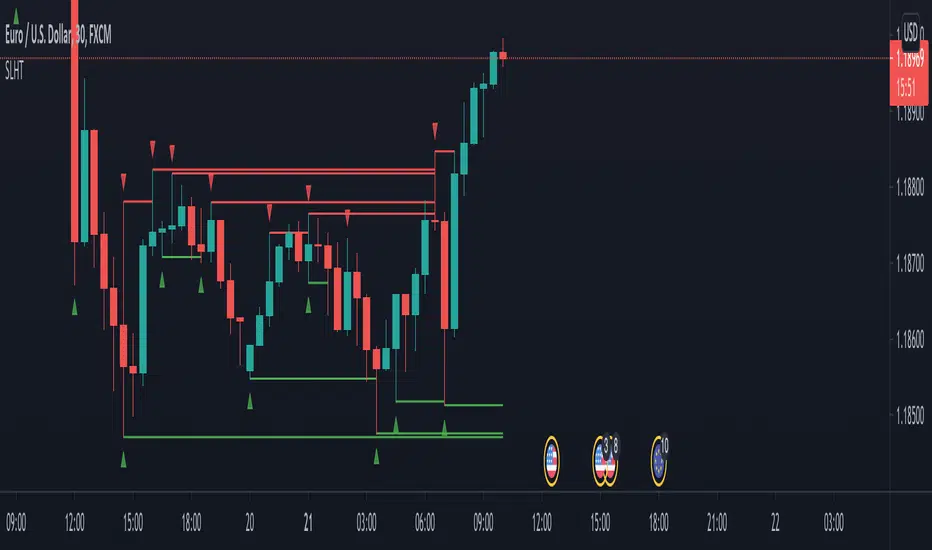
SL Hunter Tracker SL Hunter Tracker
coded by Bogdan Vaida
SL Hunter Tracker is a meticulous hunter that tracks SL hunters.
First it plots the fractals on the chart, then it draws lines from them
to the last wick that touched that height. You can add sweep alerts, once
per bar close, so that you get notified when a wick was touched.
Tested on: EURUSD 30'
Fractal lines multi time framePlot lines using last two William's fractals to find trends, it supports different resolutions and alerts

Fractals ROC AlertI am playing William's Fractals and got an idea to calculate each fractal's strength by these rules:
- downFractal. FractalROC = (close - lowest(n+1))/(open【2*n】-lowest(n+1))
- upFractal FractalROC = (highest(n+1)-close)/(highest(n+1)-open【2*n】)
And set up a level to filter small fractals.
Bigger FractalROC, Stronger trend

Custom FIBOThis script shows 3 Donchian Channel 78.6% and 21.4% intermediary level lines to perform trade analysis. Besides those 6 lines it also optionally shows Fibonacci's retracements with 100%, 127%, 162%, 200% and 262% for one of the Donchian channels.
The 3 Donchian Channels used have default lengths 72, 305 and 1292, calculated after the first length default value of 72. For each of the 3 Donchian Channels only an upper line, set by default at 78.6%, is plotted in green and its complement, set to 21.4%, is plotted in red. When the closing price is above 3 green lines, we say it is Forbidden to Sell ( PV ), and when the closing price is below 3 red lines, we say it is Forbidden to Buy ( PC ). Those conditions are flagged on the chart. These PV-PC conditions were, up to my knowledge, first proposed by Bo Williams.
Fibonacci's retracements are show for the Donchian Channel with length 72 by default, but it can be changed to any length. They are colored as fuchsia (100%), blue (127%), orange (162%), yellow (200%) and navy (262%).

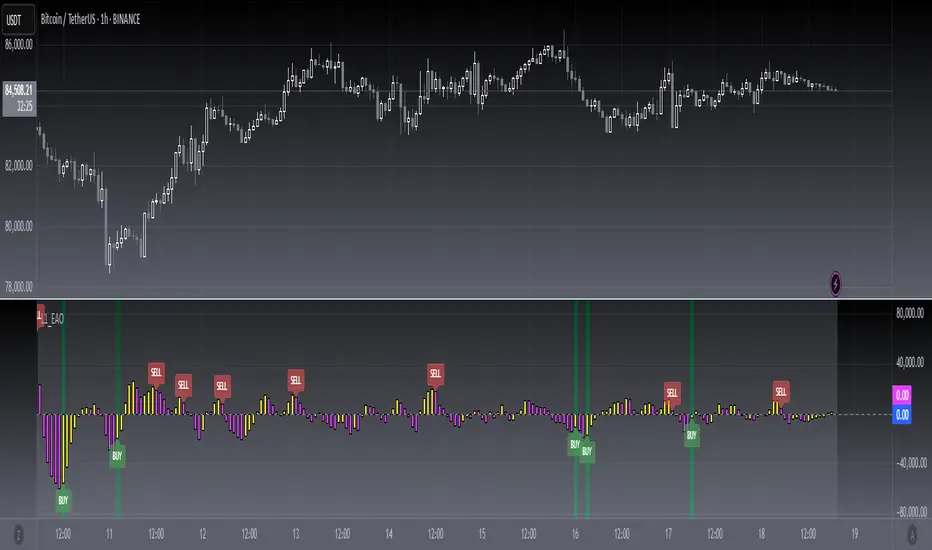
[blackcat] L1 Enhanced Awesome OscillatorLevel: 1
Background
The awesome oscillator is just that, an oscillator by Bill Williams. In contrast to the slow stochastics, which ranges from +100 to -100, the fantastic oscillator is limitless. On the surface, one might think that the fantastic oscillator is made up of a complicated algorithm developed by a Whiz Kid from M.I.T. You will be surprised to learn that the indicator is a basic calculation of two simple moving averages. I made some improvements on it by introducing some novel moving average functions and choppiness index as L1 Enhanced Awesome Oscillator.
Function
Yellow bars for bull and fuchsia bars for bear with candles. Buying and selling signal is provided. Divergence signal is provided. Choppiness index is used as a green background color, which indicates trends when it under green color. The choppiness index is used to filter out entry signals.
Key Signal
yellow candle --> bull
fuchsia candle --> bear
yellow DIV label --> bottom divergence
fuchsia DIV label --> top divergence
red SELL label --> short entry
green BUY label --> long entry
Remarks
Feedbacks are appreciated.
Readme
In real life, I am a prolific inventor. I have successfully applied for more than 60 international and regional patents in the past 12 years. But in the past two years or so, I have tried to transfer my creativity to the development of trading strategies. Tradingview is the ideal platform for me. I am selecting and contributing some of the hundreds of scripts to publish in Tradingview community. Welcome everyone to interact with me to discuss these interesting pine scripts.
The scripts posted are categorized into 5 levels according to my efforts or manhours put into these works.
Level 1 : interesting script snippets or distinctive improvement from classic indicators or strategy. Level 1 scripts can usually appear in more complex indicators as a function module or element.
Level 2 : composite indicator/strategy. By selecting or combining several independent or dependent functions or sub indicators in proper way, the composite script exhibits a resonance phenomenon which can filter out noise or fake trading signal to enhance trading confidence level.
Level 3 : comprehensive indicator/strategy. They are simple trading systems based on my strategies. They are commonly containing several or all of entry signal, close signal, stop loss, take profit, re-entry, risk management, and position sizing techniques. Even some interesting fundamental and mass psychological aspects are incorporated.
Level 4 : script snippets or functions that do not disclose source code. Interesting element that can reveal market laws and work as raw material for indicators and strategies. If you find Level 1~2 scripts are helpful, Level 4 is a private version that took me far more efforts to develop.
Level 5 : indicator/strategy that do not disclose source code. private version of Level 3 script with my accumulated script processing skills or a large number of custom functions. I had a private function library built in past two years. Level 5 scripts use many of them to achieve private trading strategy.
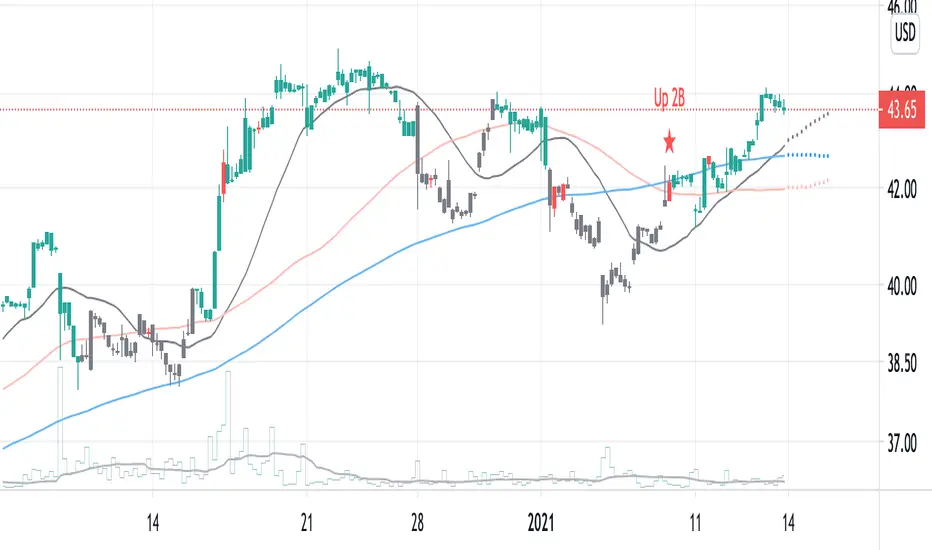
2B detector betaIdentifying a trend reversal is practically tricky, given that price movement is somewhat unpredictable and mostly obeys a power law. In which the price difference is primarily out of normal distribution. According to Benoit Mandelbrot, the price distribution follows an alpha-stable distribution with α equal to 1.7.
Real data observation suggests that stock prices do not follow the Random Walk Hypothesis or Brownian motion. Instead, they follow a fractal pattern. Fractals exhibit similar patterns at different scales called self-similarity. Using this character, one can develop fractal patterns to identify local highs and local lows.
This indicator identifies the reversal signal so-called 2B base on the following logic:
1. Identify local highs and local lows with fractals
2. Define relative positions of those local highs and lows (ABC and 2B)
3. Define the local range of ABC and B
Disclaimer: This indicator is only for research purposes. Please do not take it as investing or trading advice.
Turbulence with directionThis indicator uses 28 SMA lines from SMA12 to SMA120 with an interval of 4 to reveal the unseen underlying structure that determines the stock price trend. The convergent area of MA lines usually creates support for the stock price. This indicator also includes a clock position for a clear view of the direction of the current trend.
This work is inspired by LoneCapical, Benoit Mandelbrot, and Bill Williams.
MA lines are colored with blue for bullish trends, red for bearish trends, and gray for no apparent direction.

1337 OscillatorThis script is inspired by the Awesome Oscillator by Bill Williams. The 1337 Oscillator uses a faster and more reactive hull moving average.
Signals could be from the 0 line crosses or rising/falling.

Custom EMA AngleThis script shows the angle of 6 EMAs to perform trade analysis. The EMA angle is also known as its Rate Of Change ( ROC ). The 6 EMAs (I, II, III , IV, V and VI ) default lengthes come from one of the Fibonacci Phi^3 and Phi^3/2 sub series (17, 34, 72, 144, 305 and 610), but can be changed to any values, particularly to the traditionally used 20, 40, 50, 100, 200 and 300. Up to my knowledge, Fibonacci Phi^3 and Phi^3/2 sub series lengthes were first proposed by Bo Williams.
Angle calculation is performed by calculating the tangent over a delta interval. Normalization is required to make the angle independent of the price range.
This script is meant to be used together with the corresponding EMAs on the candle pane. Non normalized view shows a more realistic angle condition but, if intended to be used with the CEMAS indicator, normalized view should be used.

Custom EMA StrategyThis script combines 3 EMAs with Bollinger Bands to build a trend based trading strategy. The 3 EMAs (I, II and III ) default lengthes come from one of the Fibonacci Phi^3/2 sub series (17, 72 and 305), but can be changed to any values, particularly to the traditionally used 20, 50 and 200. Bollinger Band length is set to the same length as EMA I. Up to my knowledge, Fibonacci Phi^3/2 sub series lengthes were first proposed by Bo Williams.
Buy Recommendations happen when src (close) > EMA I > EMA II, EMA I angle > 0 degree, EMA II angle > -1 degree and EMA III angle > -1 degree. My simulations have show that -1 degree usage results in better returns than zero degree.
Top Buy Recommendations happen when, besides Buy recommendation conditions are met, src (close) > HBand, the Bollinger Band High Band.
Sell Recommendations come in 3 flavors: Short Term (close < EMA I), Medium Term (close < EMA2) and Long Term ( EMA I < EMA II).
Angle calculation is performed by calculating the "normalized" tangent over a delta interval. Normalization is required to make the angle independent of the price range.

MultiTimeFrame Fractals D W M [xdecow]This indicator shows fractals in different timeframes. With the possibility of coloring the bars with any combination of current, daily, weekly and monthly timeframes.
The return points are calculated as follows:
high > last 3 highs and close above highest low
low < last 3 lows and closes below lowest high
The direction of higher timeframes fractals tend to be more durable and reliable. This indicator helps to find the fractal alignment of different timeframes, so that you can look for trade opportunities in the same direction as the higher timeframes and improve your chances.
