WPR Dot PlotterWPR = williams percent range dot plotter.
I put my settings at tiny and yellow dot when WPR is between -20 and 0.
Red dot on top when WPR is -80 to -100
Entertainment purposes only.
Cari dalam skrip untuk "williams"

Super momentum DBSISuper momentum DBSI: The Ultimate Guide
1. What is this Indicator?
The Super momentum DBSI is a "Consensus Engine." Instead of relying on a single line (like an RSI) to tell you where the market is going, this tool calculates 33 distinct technical indicators simultaneously for every single candle.
It treats the market like a democracy. It asks 33 mathematical "voters" (Momentum, Trend, Volume, Volatility) if they are Bullish or Bearish.
If 30 out of 33 say "Buy," the score is high (Yellow), and the trend is extremely strong.
If only 15 say "Buy," the score is low (Teal), and the trend is weak or choppy.
2. Visual Guide: How to Read the Numbers
The Scores
Top Number (Bears): Represents Selling Pressure.
Bottom Number (Bulls): Represents Buying Pressure.
The Colors (The Traffic Lights)
The colors are your primary signal. They tell you who is currently winning the war.
🟡 YELLOW (Dominance):
This indicates the Winning Side.
If the Bottom Number is Yellow, Bulls are in control.
If the Top Number is Yellow, Bears are in control.
🔴 RED (Weakness):
This appears on the Top. It means Bears are present but losing.
🔵 TEAL (Weakness):
This appears on the Bottom. It means Bulls are present but losing.
3. Trading Strategy
Scenario A: The "Strong Buy" (Long Entry)
The Setup: You are looking for a shift in momentum where Buyers overwhelm Sellers.
Watch the Bottom Number: Wait for it to turn Yellow.
Confirm Strength: Ensure the score is above 15 and rising (e.g., 12 → 18 → 22).
Check the Top: The Top Number should be Red and low (below 10).
Trigger: Enter on the candle close.
Scenario B: The "Strong Sell" (Short Entry)
The Setup: You are looking for Sellers to crush the Buyers.
Watch the Top Number: Wait for it to turn Yellow.
Confirm Strength: Ensure the score is above 15 and rising.
Check the Bottom: The Bottom Number should be Teal and low.
Trigger: Enter on the candle close.
Scenario C: The "No Trade Zone" (Choppy Market)
The Setup: The market is confused.
Visual: Top is Red, Bottom is Teal.
Meaning: NOBODY IS WINNING. There is no Yellow number.
Action: Do not trade. This usually happens during lunch hours, weekends, or right before big news. This filter alone will save you from many false breakouts.
4. What is Inside? (The 33 Indicators)
To give you confidence in the signals, here is exactly what the script is checking:
Group 1: Momentum (Oscillators)
Detects if price is moving fast.
RSI (Relative Strength Index)
CCI (Commodity Channel Index)
Stochastic
Williams %R
Momentum
Rate of Change (ROC)
Ultimate Oscillator
Awesome Oscillator
True Strength Index (TSI)
Stoch RSI
TRIX
Chande Momentum Oscillator
Group 2: Trend Direction
Detects the general path of the market.
13. MACD
14. Parabolic SAR
15. SuperTrend
16. ALMA (Moving Average)
17. Aroon
18. ADX (Directional Movement)
19. Coppock Curve
20. Ichimoku Conversion Line
21. Hull Moving Average
Group 3: Price Action
Detects where price is relative to averages.
22. Price vs EMA 20
23. Price vs EMA 50
24. Price vs EMA 200
Group 4: Volume & Force
Detects if there is money behind the move.
25. Money Flow Index (MFI)
26. On Balance Volume (OBV)
27. Chaikin Money Flow (CMF)
28. VWAP (Intraday)
29. Elder Force Index
30. Ease of Movement
Group 5: Volatility
Detects if price is pushing the outer limits.
31. Bollinger Bands
32. Keltner Channels
33. Donchian Channels
5. Pro Tips for Success
Don't Catch Knives: If the Bear score (Top) is Yellow and 25+, do not try to buy the dip. Wait for the Yellow score to break.
Exit Early: If you are Long and the Yellow Bull score drops from 28 to 15 in one candle, TAKE PROFIT. The momentum has died.
Use Higher Timeframes: This indicator works best on 15m, 1H, and 4H charts. On the 1m chart, it may be too volatile.

Scout Regiment - D17# Scout Regiment - D17 Indicator
## English Documentation
### Overview
Scout Regiment - D17 is a comprehensive TradingView indicator that combines multiple technical analysis tools into one powerful overlay indicator. It provides traders with market structure analysis, divergence detection, volume profiling, smart money concepts, and session analysis.
### Key Features
#### 1. **EMA (Exponential Moving Averages)**
- **Purpose**: Trend identification and dynamic support/resistance levels
- **Configuration**: 13 customizable EMAs with adjustable periods
- **Default Active EMAs**: EMA 3 (21), EMA 5 (55), EMA 7 (144), EMA 8 (233)
- **Uses**: Identify trend direction, entry/exit points, and trend strength
- **Color Coding**: Different colors for easy visual distinction
#### 2. **TFMA (Timeframe Moving Averages)**
- **Purpose**: Multi-timeframe trend analysis
- **Features**:
- 3 EMAs on higher timeframes
- Dynamic labels showing trend direction
- Price difference percentage display
- Customizable timeframe settings
- **Default Settings**: 21-period timeframe with lengths 55, 144, and 233
- **Benefits**: Align trades with higher timeframe trends
#### 3. **DFMA (Daily Frame Moving Averages)**
- **Purpose**: Daily timeframe perspective on any chart
- **Features**: Similar to TFMA but specifically for daily analysis
- **Default Timeframe**: 1D (Daily)
- **Use Case**: Long-term trend confirmation and positioning
#### 4. **PMA (Price Moving Averages)**
- **Purpose**: Price channel analysis with filled areas
- **Configuration**: 7 customizable moving averages with fill zones
- **Default Lengths**: 12, 144, 169, 288, 338, 576, 676
- **Visual**: Color-filled zones between selected MAs for channel trading
#### 5. **VWAP (Volume Weighted Average Price)**
- **Purpose**: Institutional trading levels and fair value
- **Features**:
- Multiple anchor periods (Session, Week, Month, Quarter, Year, etc.)
- Standard deviation bands
- Corporate event anchoring (Earnings, Dividends, Splits)
- **Use Case**: Identify institutional support/resistance and mean reversion opportunities
#### 6. **Divergence Detector**
- **Purpose**: Identify potential trend reversals
- **Supported Indicators**: MACD, MACD Histogram, RSI, Stochastic, CCI, Williams %R, Bias, Momentum, OBV, SOBV, VWmacd, CMF, MFI, and external indicators
- **Divergence Types**:
- Regular Bullish/Bearish
- Hidden Bullish/Bearish
- **Features**:
- Automatic divergence line drawing
- Customizable detection parameters
- Color-coded alerts
#### 7. **Volume Profile & Node Detection**
- **Purpose**: Identify key price levels based on volume distribution
- **Features**:
- Volume Profile with POC (Point of Control)
- Value Area High (VAH) and Value Area Low (VAL)
- Peak and trough volume node detection
- Highest/lowest volume node highlighting
- **Lookback**: Configurable (default 377 bars)
- **Use Case**: Identify support/resistance zones and liquidity areas
#### 8. **Smart Money Concepts**
- **Purpose**: Track institutional trading patterns
- **Features**:
- Market Structure (BOS - Break of Structure, CHoCH - Change of Character)
- Internal and Swing structures
- Strong/Weak Highs and Lows
- Equal Highs/Lows detection
- Fair Value Gaps (FVG)
- **Modes**: Historical or Present (latest only)
- **Use Case**: Trade with institutional flow
#### 9. **Trading Sessions**
- **Purpose**: Analyze market behavior during different global sessions
- **Available Sessions**:
- Asian Session
- Sydney, Tokyo, Shanghai, Hong Kong
- European Session
- London, New York, NYSE
- **Features**:
- Session boxes with high/low visualization
- Real-time countdown timers
- Volume and price change tracking
- Information table with session statistics
- **Customization**: Choose which sessions to display, colors, and box styles
### How to Use
#### For Trend Following:
1. Enable EMAs 3, 5, 7, and 8
2. Use TFMA for higher timeframe confirmation
3. Look for price above/below key EMAs for trend direction
4. Use VWAP as additional confirmation
#### For Reversal Trading:
1. Enable Divergence Detector with MACD Histogram and Bias
2. Look for divergences at key support/resistance levels
3. Confirm with Smart Money CHoCH signals
4. Use Volume Profile nodes as entry/exit targets
#### For Intraday Trading:
1. Enable Trading Sessions
2. Focus on high-volume sessions (London, New York overlap)
3. Use session highs/lows as support/resistance
4. Trade Fair Value Gaps during active sessions
#### For Swing Trading:
1. Use DFMA for daily trend
2. Enable PMA for channel identification
3. Look for price reactions at volume profile value areas
4. Confirm with swing structure breaks
### Best Practices
1. **Don't Overcrowd**: Enable only the components you need for your strategy
2. **Multi-Timeframe Analysis**: Always check higher timeframe TFMA/DFMA
3. **Confluence**: Look for multiple signals confirming the same direction
4. **Volume Confirmation**: Use Volume Profile to validate price action
5. **Session Awareness**: Be aware of which session is active for volatility expectations
### Performance Optimization
- Disable unused features to improve chart loading speed
- Use "Present Mode" for Smart Money Concepts if historical data isn't needed
- Reduce Volume Profile lookback period on slower devices
### Alerts
The indicator includes alert conditions for:
- All divergence types (8 conditions)
- Smart Money structure breaks (8 conditions)
- Equal highs/lows detection
- Fair Value Gaps formation
---
## 中文说明文档
### 概述
Scout Regiment - D17 是一款综合性TradingView指标,将多个技术分析工具整合到一个强大的叠加指标中。它为交易者提供市场结构分析、背离检测、成交量分析、聪明钱概念和时区分析。
### 核心功能
#### 1. **EMA(指数移动平均线)**
- **用途**:趋势识别和动态支撑阻力位
- **配置**:13条可自定义周期的EMA
- **默认启用**:EMA 3(21)、EMA 5(55)、EMA 7(144)、EMA 8(233)
- **应用**:识别趋势方向、进出场点位和趋势强度
- **颜色编码**:不同颜色便于视觉区分
#### 2. **TFMA(时间框架移动平均线)**
- **用途**:多时间框架趋势分析
- **特点**:
- 3条更高时间框架的EMA
- 显示趋势方向的动态标签
- 价格差异百分比显示
- 可自定义时间框架设置
- **默认设置**:21周期时间框架,长度为55、144和233
- **优势**:使交易与更高时间框架趋势保持一致
#### 3. **DFMA(日线框架移动平均线)**
- **用途**:在任何图表上提供日线时间框架视角
- **特点**:与TFMA类似,但专门用于日线分析
- **默认时间框架**:1D(日线)
- **使用场景**:长期趋势确认和定位
#### 4. **PMA(价格移动平均线)**
- **用途**:价格通道分析与填充区域
- **配置**:7条可自定义的移动平均线,带填充区域
- **默认长度**:12、144、169、288、338、576、676
- **视觉效果**:选定MA之间的彩色填充区域,用于通道交易
#### 5. **VWAP(成交量加权平均价格)**
- **用途**:机构交易水平和公允价值
- **特点**:
- 多个锚定周期(交易日、周、月、季度、年等)
- 标准差波段
- 企业事件锚定(财报、分红、拆股)
- **使用场景**:识别机构支撑阻力和均值回归机会
#### 6. **背离检测器**
- **用途**:识别潜在趋势反转
- **支持指标**:MACD、MACD柱状图、RSI、随机指标、CCI、威廉指标、乖离率、动量、OBV、SOBV、VWmacd、CMF、MFI及外部指标
- **背离类型**:
- 常规看涨/看跌背离
- 隐藏看涨/看跌背离
- **特点**:
- 自动绘制背离连线
- 可自定义检测参数
- 颜色编码警报
#### 7. **成交量分布与节点检测**
- **用途**:基于成交量分布识别关键价格水平
- **特点**:
- 成交量分布图与POC(控制点)
- 价值区域高点(VAH)和低点(VAL)
- 峰值和低谷成交量节点检测
- 最高/最低成交量节点突出显示
- **回溯期**:可配置(默认377根K线)
- **使用场景**:识别支撑阻力区域和流动性区域
#### 8. **聪明钱概念**
- **用途**:追踪机构交易模式
- **特点**:
- 市场结构(BOS-突破结构、CHoCH-结构转变)
- 内部和摆动结构
- 强/弱高低点
- 等高/等低检测
- 公允价值缺口(FVG)
- **模式**:历史模式或当前模式(仅最新)
- **使用场景**:跟随机构资金流动交易
#### 9. **交易时区**
- **用途**:分析不同全球时段的市场行为
- **可用时段**:
- 亚洲时段
- 悉尼、东京、上海、香港
- 欧洲时段
- 伦敦、纽约、纽交所
- **特点**:
- 时段方框显示高低点
- 实时倒计时
- 成交量和价格变化追踪
- 时段统计信息表格
- **自定义**:选择显示哪些时段、颜色和方框样式
### 使用方法
#### 趋势跟随策略:
1. 启用EMA 3、5、7和8
2. 使用TFMA进行更高时间框架确认
3. 观察价格在关键EMA上方/下方确定趋势方向
4. 使用VWAP作为额外确认
#### 反转交易策略:
1. 启用背离检测器(MACD柱状图和乖离率)
2. 在关键支撑阻力位寻找背离
3. 用聪明钱CHoCH信号确认
4. 使用成交量分布节点作为进出场目标
#### 日内交易策略:
1. 启用交易时区
2. 关注高成交量时段(伦敦、纽约重叠时段)
3. 使用时段高低点作为支撑阻力
4. 在活跃时段交易公允价值缺口
#### 波段交易策略:
1. 使用DFMA确定日线趋势
2. 启用PMA识别通道
3. 观察价格在成交量分布价值区域的反应
4. 用摆动结构突破确认
### 最佳实践
1. **避免过度拥挤**:仅启用策略所需的组件
2. **多时间框架分析**:始终检查更高时间框架的TFMA/DFMA
3. **汇合点**:寻找多个信号确认同一方向
4. **成交量确认**:使用成交量分布验证价格行为
5. **时段意识**:了解当前活跃时段以预期波动性
### 性能优化
- 禁用未使用的功能以提高图表加载速度
- 如果不需要历史数据,对聪明钱概念使用"当前模式"
- 在较慢设备上减少成交量分布回溯期
### 警报
指标包含以下警报条件:
- 所有背离类型(8个条件)
- 聪明钱结构突破(8个条件)
- 等高/等低检测
- 公允价值缺口形成
---
## Technical Support
For questions or issues, please refer to the TradingView community or contact the indicator creator.
## 技术支持
如有问题,请参考TradingView社区或联系指标创建者。

VIX Fix Indicator (Hestla 2015)This script provides a streamlined version of the VIX Fix, referencing the foundational work of Larry Williams and the strategies of Amber Hestla. It serves as a synthetic volatility gauge for assets that lack a dedicated VIX index. The math works by measuring the percentage drop from the highest recent close to the current low, essentially quantifying fear in the market without needing options data.
This specific script is designed to be purely visual. I have removed all the buy and sell labels found in other versions to leave a clean pane that plots only the oscillator and its moving average. You can use this to identify potential market bottoms when the black line spikes significantly, signaling that selling pressure is reaching a mathematical extreme relative to the recent trend.

Elder's Complete Trading SystemKey Features:
✅ ENHANCED SIGNALS (🔥 symbols) = ALL conditions perfectly aligned:
Weekly trend confirmation
Daily pullback/rally against trend
Multiple indicator convergence
Divergence detection
Volume confirmation
Proper channel positioning
✅ Standard Signals = Basic Triple Screen requirements met
✅ Comprehensive Dashboard shows real-time status of ALL indicators
✅ Automatic Stop Loss & Target Calculation based on 2% rule
✅ Multiple Alert Types for different signal strengths
What Makes This "Perfect":
Implements EVERY major concept from the book:
Triple Screen (3 timeframes)
Elder-ray (Bull/Bear Power)
Force Index (Price + Volume)
MACD-Histogram with divergences
Multiple oscillators (Stochastic, Williams %R)
Volume analysis
Channel trading
2% Rule risk management
Losers Anonymous principles
Professional-Grade Features:
Multi-timeframe analysis
Divergence detection (most powerful signals)
Risk/reward calculation
Position sizing suggestions
Visual stop loss & target lines
Comprehensive alerting system
Follows Elder's Philosophy:
Quality over quantity
Risk management FIRST
Multiple confirmation required
Clear visual feedback
Educational reminders built-in
Best Practices:
Use on DAILY charts primarily
Set higher timeframe to WEEKLY
Only take ENHANCED signals for highest probability
ALWAYS follow the 2% rule
Check the dashboard before every trade
Wait for ALL confirmations to align
This is the most comprehensive Dr. Elder indicator possible—combining every trading principle from his book into one powerful system!

Quantum Market Analyzer X7Quantum Market Analyzer X7 - Complete Study Guide
Table of Contents
1. Overview
2. Indicator Components
3. Signal Interpretation
4. Live Market Analysis Guide
5. Best Practices
6. Limitations and Considerations
7. Risk Disclaimer
________________________________________
Overview
The Quantum Market Analyzer X7 is a comprehensive multi-timeframe technical analysis indicator that combines traditional and modern analytical methods. It aggregates signals from multiple technical indicators across seven key analysis categories to provide traders with a consolidated view of market sentiment and potential trading opportunities.
Key Features:
• Multi-Indicator Analysis: Combines 20+ technical indicators
• Real-Time Dashboard: Professional interface with customizable display
• Signal Aggregation: Weighted scoring system for overall market sentiment
• Advanced Analytics: Includes Order Block detection, Supertrend, and Volume analysis
• Visual Progress Indicators: Easy-to-read progress bars for signal strength
________________________________________
Indicator Components
1. Oscillators Section
Purpose: Identifies overbought/oversold conditions and momentum changes
Included Indicators:
• RSI (14): Relative Strength Index - momentum oscillator
• Stochastic (14): Compares closing price to price range
• CCI (20): Commodity Channel Index - cycle identification
• Williams %R (14): Momentum indicator similar to Stochastic
• MACD (12,26,9): Moving Average Convergence Divergence
• Momentum (10): Rate of price change
• ROC (9): Rate of Change
• Bollinger Bands (20,2): Volatility-based indicator
Signal Interpretation:
• Strong Buy (6+ points): Multiple oscillators indicate oversold conditions
• Buy (2-5 points): Moderate bullish momentum
• Neutral (-1 to 1 points): Balanced conditions
• Sell (-2 to -5 points): Moderate bearish momentum
• Strong Sell (-6+ points): Multiple oscillators indicate overbought conditions
2. Moving Averages Section
Purpose: Determines trend direction and strength
Included Indicators:
• SMA: 10, 20, 50, 100, 200 periods
• EMA: 10, 20, 50 periods
Signal Logic:
• Price >2% above MA = Strong Buy (+2)
• Price above MA = Buy (+1)
• Price below MA = Sell (-1)
• Price >2% below MA = Strong Sell (-2)
Signal Interpretation:
• Strong Buy (6+ points): Price well above multiple MAs, strong uptrend
• Buy (2-5 points): Price above most MAs, bullish trend
• Neutral (-1 to 1 points): Mixed MA signals, consolidation
• Sell (-2 to -5 points): Price below most MAs, bearish trend
• Strong Sell (-6+ points): Price well below multiple MAs, strong downtrend
3. Order Block Analysis
Purpose: Identifies institutional support/resistance levels and breakouts
How It Works:
• Detects historical levels where large orders were placed
• Monitors price behavior around these levels
• Identifies breakouts from established order blocks
Signal Types:
• BULLISH BRK (+2): Breakout above resistance order block
• BEARISH BRK (-2): Breakdown below support order block
• ABOVE SUP (+1): Price holding above support
• BELOW RES (-1): Price rejected at resistance
• NEUTRAL (0): No significant order block interaction
4. Supertrend Analysis
Purpose: Trend following indicator based on Average True Range
Parameters:
• ATR Period: 10 (default)
• ATR Multiplier: 6.0 (default)
Signal Types:
• BULLISH (+2): Price above Supertrend line
• BEARISH (-2): Price below Supertrend line
• NEUTRAL (0): Transition period
5. Trendline/Channel Analysis
Purpose: Identifies trend channels and breakout patterns
Components:
• Dynamic trendline calculation using pivot points
• Channel width based on historical volatility
• Breakout detection algorithm
Signal Types:
• UPPER BRK (+2): Breakout above upper channel
• LOWER BRK (-2): Breakdown below lower channel
• ABOVE MID (+1): Price above channel midline
• BELOW MID (-1): Price below channel midline
6. Volume Analysis
Purpose: Confirms price movements with volume data
Components:
• Volume spikes detection
• On Balance Volume (OBV)
• Volume Price Trend (VPT)
• Money Flow Index (MFI)
• Accumulation/Distribution Line
Signal Calculation: Multiple volume indicators are combined to determine institutional activity and confirm price movements.
________________________________________
Signal Interpretation
Overall Summary Signals
The indicator aggregates all component signals into an overall market sentiment:
Signal Score Range Interpretation Action
STRONG BUY 10+ Overwhelming bullish consensus Consider long positions
BUY 4-9 Moderate to strong bullish bias Look for long opportunities
NEUTRAL -3 to 3 Mixed signals, consolidation Wait for clearer direction
SELL -4 to -9 Moderate to strong bearish bias Look for short opportunities
STRONG SELL -10+ Overwhelming bearish consensus Consider short positions
Progress Bar Interpretation
• Filled bars indicate signal strength
• Green bars: Bullish signals
• Red bars: Bearish signals
• More filled bars = stronger conviction
________________________________________
Live Market Analysis Guide
Step 1: Initial Assessment
1. Check Overall Summary: Start with the main signal
2. Verify with Component Analysis: Ensure signals align
3. Look for Divergences: Identify conflicting signals
Step 2: Timeframe Analysis
1. Set Appropriate Timeframe: Use 1H for intraday, 4H/1D for swing trading
2. Multi-Timeframe Confirmation: Check higher timeframes for trend context
3. Entry Timing: Use lower timeframes for precise entry points
Step 3: Signal Confirmation Process.
For Buy Signals:
1. Oscillators: Look for oversold conditions (RSI <30, Stoch <20)
2. Moving Averages: Price should be above key MAs
3. Order Blocks: Confirm bounce from support levels
4. Volume: Check for accumulation patterns
5. Supertrend: Ensure bullish trend alignment.
For Sell Signals:
1. Oscillators: Look for overbought conditions (RSI >70, Stoch >80)
2. Moving Averages: Price should be below key MAs
3. Order Blocks: Confirm rejection at resistance levels
4. Volume: Check for distribution patterns
5. Supertrend: Ensure bearish trend alignment.
Step 4: Risk Management Integration
1. Signal Strength Assessment: Stronger signals = larger position size
2. Stop Loss Placement: Use Order Block levels for stops
3. Take Profit Targets: Based on channel analysis and resistance levels
4. Position Sizing: Adjust based on signal confidence
________________________________________
Best Practices
Entry Strategies
1. High Conviction Entries: Wait for STRONG BUY/SELL signals
2. Confluence Trading: Look for multiple components aligning
3. Breakout Trading: Use Order Block and Trendline breakouts
4. Trend Following: Align with Supertrend direction.
Risk Management
1. Never Risk More Than 2% Per Trade: Regardless of signal strength
2. Use Stop Losses: Place at invalidation levels
3. Scale Positions: Stronger signals warrant larger (but still controlled) positions
4. Diversification: Don't rely solely on one indicator.
Market Conditions
1. Trending Markets: Focus on Supertrend and MA signals
2. Range-Bound Markets: Emphasize Oscillator and Order Block signals
3. High Volatility: Reduce position sizes, widen stops
4. Low Volume: Be cautious of breakout signals.
Common Mistakes to Avoid
1. Signal Chasing: Don't enter after signals have already moved significantly
2. Ignoring Context: Consider overall market conditions
3. Overtrading: Wait for high-quality setups
4. Poor Risk Management: Always use appropriate position sizing
________________________________________
Limitations and Considerations
Technical Limitations
1. Lagging Nature: All technical indicators are based on historical data
2. False Signals: No indicator is 100% accurate
3. Market Regime Changes: Indicators may perform differently in various market conditions
4. Whipsaws: Possible in choppy, sideways markets.
Optimal Use Cases
1. Trending Markets: Performs best in clear trending environments
2. Medium to High Volatility: Requires sufficient price movement for signals
3. Liquid Markets: Works best with adequate volume and tight spreads
4. Multiple Timeframe Analysis: Most effective when used across different timeframes.
When to Use Caution
1. Major News Events: Fundamental analysis may override technical signals
2. Market Opens/Closes: Higher volatility can create false signals
3. Low Volume Periods: Signals may be less reliable
4. Holiday Trading: Reduced participation affects signal quality
________________________________________
Risk Disclaimer
IMPORTANT LEGAL DISCLAIMER FROM aiTrendview
WARNING: TRADING INVOLVES SUBSTANTIAL RISK OF LOSS
This Quantum Market Analyzer X7 indicator ("the Indicator") is provided for educational and informational purposes only. By using this indicator, you acknowledge and agree to the following terms:
No Investment Advice
• The Indicator does NOT constitute investment advice, financial advice, or trading recommendations
• All signals generated are based on historical price data and mathematical calculations
• Past performance does not guarantee future results
• No representation is made that any account will achieve profits or losses similar to those shown.
Risk Acknowledgment
• TRADING CARRIES SUBSTANTIAL RISK: You may lose some or all of your invested capital
• LEVERAGE AMPLIFIES RISK: Margin trading can result in losses exceeding your initial investment
• MARKET VOLATILITY: Financial markets are inherently unpredictable and volatile
• TECHNICAL ANALYSIS LIMITATIONS: No technical indicator is infallible or guarantees profitable trades.
User Responsibility
• YOU ARE SOLELY RESPONSIBLE for all trading decisions and their consequences
• CONDUCT YOUR OWN RESEARCH: Always perform independent analysis before making trading decisions
• CONSULT PROFESSIONALS: Seek advice from qualified financial advisors
• RISK MANAGEMENT: Implement appropriate risk management strategies
No Warranties
• The Indicator is provided "AS IS" without warranties of any kind
• aiTrendview makes no representations about the accuracy, reliability, or suitability of the Indicator
• Technical glitches, data feed issues, or calculation errors may occur
• The Indicator may not work as expected in all market conditions.
Limitation of Liability
• aiTrendview SHALL NOT BE LIABLE for any direct, indirect, incidental, or consequential damages
• This includes but is not limited to: trading losses, missed opportunities, data inaccuracies, or system failures
• MAXIMUM LIABILITY is limited to the amount paid for the indicator (if any)
Code Usage and Distribution
• This indicator is published on TradingView in accordance with TradingView's house rules
• UNAUTHORIZED MODIFICATION or redistribution of this code is prohibited
• Users may not claim ownership of this intellectual property
• Commercial use requires explicit written permission from aiTrendview.
Compliance and Regulations
• VERIFY LOCAL REGULATIONS: Ensure compliance with your jurisdiction's trading laws
• Some trading strategies may not be suitable for all investors
• Tax implications of trading are your responsibility
• Report trading activities as required by law
Specific Risk Factors
1. False Signals: The Indicator may generate incorrect buy/sell signals
2. Market Gaps: Overnight gaps can invalidate technical analysis
3. Fundamental Events: News and economic data can override technical signals
4. Liquidity Risk: Some markets may have insufficient liquidity
5. Technology Risk: Platform failures or connectivity issues may prevent order execution.
Professional Trading Warning
• THIS IS NOT PROFESSIONAL TRADING SOFTWARE: Not intended for institutional or professional trading
• NO REGULATORY APPROVAL: This indicator has not been approved by any financial regulatory authority
• EDUCATIONAL PURPOSE: Designed primarily for learning technical analysis concepts
FINAL WARNING
NEVER INVEST MONEY YOU CANNOT AFFORD TO LOSE
Trading financial instruments involves significant risk. The majority of retail traders lose money. Before using this indicator in live trading:
1. Practice on paper/demo accounts extensively
2. Start with small position sizes
3. Develop a comprehensive trading plan
4. Implement strict risk management rules
5. Continuously educate yourself about market dynamics
By using the Quantum Market Analyzer X7, you acknowledge that you have read, understood, and agree to this disclaimer. You assume full responsibility for all trading decisions and their outcomes.
Contact: For questions about this disclaimer or the indicator, contact aiTrendview through official TradingView channels only.
________________________________________
This study guide and indicator are published on TradingView in compliance with TradingView's community guidelines and house rules. All users must adhere to TradingView's terms of service when using this indicator.
Document Version: 1.0
Publisher: aiTrendview
________________________________________
Disclaimer
The content provided in this blog post is for educational and training purposes only. It is not intended to be, and should not be construed as, financial, investment, or trading advice. All charting and technical analysis examples are for illustrative purposes. Trading and investing in financial markets involve substantial risk of loss and are not suitable for every individual. Before making any financial decisions, you should consult with a qualified financial professional to assess your personal financial situation.

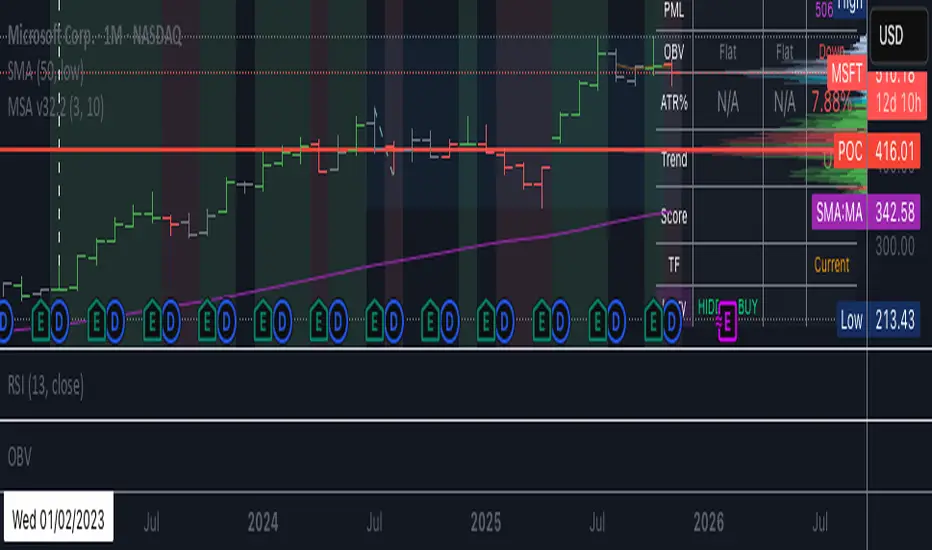
BC_Monthly Strength Armor [xAI] - v32.2 MTF LOCKED + SCORE FIXED🛡️ **Monthly Strength Armor - v32.2**
**Multi-Timeframe Institutional Edge Indicator**
🔥 **Detects smart money moves** using:
- **Monthly Range Position (Score 0–100)**
- **Higher High/Low Trend Structure (Daily/Weekly/Monthly)**
- **OBV Trend Lock (100% consistent)**
- **Larry Williams OHLC Institutional Patterns (Daily)**
📊 **MTF Table (locked values — no flicker)**
| Daily | Weekly | Monthly |
|-------|--------|---------|
| OBV | Trend | Score |
| ATR% | Larry | PMH/PML |
🎯 **Confluence Alerts**
- **3-TF Bullish / Bearish**
- **ULTRA BUY/SELL** (all TFs aligned)
- **Larry Institutional Buying/Selling**
✅ **No repaint | No warnings | Live-ready**
Built for **NVDA, MSFT, URA, QQQ, SPY**
*By @TedPrime x Grok @ xAI*
Dynamic Fractal Flow [Alpha Extract]An advanced momentum oscillator that combines fractal market structure analysis with adaptive volatility weighting and multi-derivative calculus to identify high-probability trend reversals and continuation patterns. Utilizing sophisticated noise filtering through choppiness indexing and efficiency ratio analysis, this indicator delivers entries that adapt to changing market regimes while reducing false signals during consolidation via multi-layer confirmation centered on acceleration analysis, statistical band context, and dynamic omega weighting—without any divergence detection.
🔶 Fractal-Based Market Structure Detection
Employs Williams Fractal methodology to identify pivotal market highs and lows, calculating normalized price position within the established fractal range to generate oscillator signals based on structural positioning. The system tracks fractal points dynamically and computes relative positioning with ATR fallback protection, ensuring continuous signal generation even during extended trending periods without fractal formation.
🔶 Dynamic Omega Weighting System
Implements an adaptive weighting algorithm that adjusts signal emphasis based on real-time volatility conditions and volume strength, calculating dynamic omega coefficients ranging from 0.3 to 0.9. The system applies heavier weighting to recent price action during high-conviction moves while reducing sensitivity during low-volume environments, mitigating lag inherent in fixed-period calculations through volatility normalization and volume-strength integration.
🔶 Cascading Robustness Filtering
Features up to five stages of progressive EMA smoothing with user-adjustable robustness steps, each layer systematically filtering microstructure noise while preserving essential trend information. Smoothing periods scale with the chosen fractal length and robustness steps using a fixed smoothing multiplier for consistent, predictable behavior.
🔶 Adaptive Noise Suppression Engine
Integrates dual-component noise filtering combining Choppiness Index calculation with Kaufman’s Efficiency Ratio to detect ranging versus trending market conditions. The system applies dynamic damping that maintains full signal strength during trending environments while suppressing signals during choppy consolidation, aligning output with the prevailing regime.
🔶 Acceleration and Jerk Analysis Framework
Calculates second-derivative acceleration and third-derivative jerk to identify explosive momentum shifts before they fully materialize on traditional indicators. Detects bullish acceleration when both acceleration and jerk turn positive in negative oscillator territory, and bearish acceleration when both turn negative in positive territory, providing early entry signals for high-velocity trend initiation phases.
🔶 Multi-Layer Signal Generation Architecture
Combines three primary signal types with hierarchical validation: acceleration signals, band crossover entries, and threshold momentum signals. Each signal category includes momentum confirmation, trend-state validation, and statistical band context; signals are further conditioned by band squeeze detection to avoid low-probability entries during compression phases. Divergence is intentionally excluded for a purely structure- and momentum-driven approach.
🔶 Dynamic Statistical Band System
Utilizes Bollinger-style standard deviation bands with configurable multiplier and length to create adaptive threshold zones that expand during volatile periods and contract during consolidation. Includes band squeeze detection to identify compression phases that typically precede expansion, with signal suppression during squeezes to prevent premature entries.
🔶 Gradient Color Visualization System
Features color gradient mapping that dynamically adjusts line intensity based on signal strength, transitioning from neutral gray to progressively intense bullish or bearish colors as conviction increases. Includes gradient fills between the signal line and zero with transparency scaling based on oscillator intensity for immediate visual confirmation of trend strength and directional bias.
All analysis provided by Alpha Extract is for educational and informational purposes only. The information and publications are not meant to be, and do not constitute, financial, investment, trading, or other types of advice or recommendations.

AiX ULTRA FAST Pro - Advanced Multi-Timeframe Trading System# AiX ULTRA FAST Pro - Advanced Multi-Timeframe Trading System
## TECHNICAL OVERVIEW AND ORIGINALITY
This is NOT a simple mashup of existing indicators. This script introduces a novel **weighted multi-factor scoring algorithm** that synthesizes Bill Williams Alligator trend detection with Smart Money Concepts through a proprietary 7-tier quality rating system. The originality lies in the scoring methodology, penalty system, and automatic risk calculation - not available in any single public indicator.
---
## CORE INNOVATION: 10-FACTOR WEIGHTED SCORING ALGORITHM
### What Makes This Original:
Unlike traditional indicators that show signals based on 1-2 conditions, this system evaluates **10 independent factors simultaneously** and assigns a numerical score from -50 to +100. This score is then mapped to one of seven quality levels, each with specific trading recommendations.
**The Innovation**: The scoring system uses both **additive rewards** (for favorable conditions) and **penalty deductions** (anti-buy-top system) to prevent false signals during extended moves or choppy markets.
---
## METHODOLOGY BREAKDOWN
### 1. ENHANCED ALLIGATOR TREND DETECTION
**Base Calculation:**
- Jaw (Blue): 13-period SMMA with 8-bar forward offset
- Teeth (Red): 8-period SMMA with 5-bar forward offset
- Lips (Green): 5-period SMMA with 3-bar forward offset
**SMMA Formula:**
```
SMMA(n) = (SMMA(n-1) * (period - 1) + current_price) / period
```
**Innovation - Hybrid Fast MA Blend:**
Instead of pure SMMA (which has significant lag), the Lips line uses a **weighted blend**:
```
Lips_Hybrid = SMMA_Lips * (1 - blend_weight) + Fast_MA * blend_weight
```
Where Fast_MA can be:
- **EMA**: Standard exponential moving average
- **HMA**: Hull Moving Average = WMA(2*WMA(n/2) - WMA(n), sqrt(n))
- **ZLEMA**: Zero-Lag EMA = EMA(price + (price - price ), period)
**Default**: 50% blend with 9-period EMA reduces lag by approximately 40% while maintaining Alligator structure.
**Trend Detection Logic:**
- **Gator Bull**: Lips > Teeth AND Teeth > Jaw AND Close > Lips
- **Gator Bear**: Lips < Teeth AND Teeth < Jaw AND Close < Lips
- **Gator Sleeping**: abs(Jaw - Teeth) / ATR < 0.3 AND abs(Teeth - Lips) / ATR < 0.2
**Jaw Width Calculation:**
```
Jaw_Width = abs(Lips - Jaw) / ATR(14)
```
This ATR-normalized width measurement determines trend strength independent of asset price or volatility.
---
### 2. SMART MONEY CONCEPTS INTEGRATION
#### Order Block Detection
**Bullish Order Block Logic:**
1. Previous candle is bearish (close < open)
2. Previous candle has strong body: body_size > (high - low) * 0.6
3. Current candle breaks above previous high
4. Current candle is bullish (close > open)
5. Volume > SMA(volume, period) * 1.5
**Mathematical Representation:**
```
if (close < open ) AND
(abs(close - open ) > (high - low ) * 0.6) AND
(close > high ) AND
(close > open) AND
(volume > volume_sma * 1.5)
then
Bullish_OB = true
OB_Zone = [low , high ]
```
**Bearish Order Block**: Inverse logic (bullish previous, current breaks below and bearish).
**Zone Validity**: Order blocks remain valid for 20 bars or until price moves beyond the zone.
#### Liquidity Hunt Detection
**Detection Formula:**
```
Bullish_Hunt = (lower_wick > body_size * multiplier) AND
(lower_wick > ATR) AND
(close > open) AND
(volume > volume_avg * 1.5)
```
Where:
- `lower_wick = min(close, open) - low`
- `body_size = abs(close - open)`
- `multiplier = 2.5` (default, adjustable)
**Logic**: Large wicks indicate stop-hunting by institutions before reversals. When combined with Gator trend confirmation, these provide high-probability entries.
---
### 3. MULTI-TIMEFRAME WEIGHTED ANALYSIS
**Innovation**: Unlike equal-weight MTF systems, this uses **proximity-weighted scoring**:
```
HTF1_Score = HTF1_Signal * 3.0 (nearest timeframe - highest weight)
HTF2_Score = HTF2_Signal * 2.0 (middle timeframe)
HTF3_Score = HTF3_Signal * 1.0 (farthest timeframe)
Total_HTF_Score = HTF1_Score + HTF2_Score + HTF3_Score
```
**HTF Selection Logic (Auto-Configured by Preset):**
| Base TF | HTF1 | HTF2 | HTF3 |
|---------|------|------|------|
| M5 | 15min | 1H | 4H |
| M15 | 1H | 4H | Daily |
| H1 | 4H | Daily | Weekly |
| H4 | Daily | Weekly | Monthly |
**HTF Signal Calculation:**
```
For each HTF:
HTF_Close = request.security(symbol, HTF, close)
HTF_EMA21 = request.security(symbol, HTF, EMA(close, 21))
HTF_EMA50 = request.security(symbol, HTF, EMA(close, 50))
if (HTF_Close > HTF_EMA21 > HTF_EMA50):
Signal = +1 (bullish)
else if (HTF_Close < HTF_EMA21 < HTF_EMA50):
Signal = -1 (bearish)
else:
Signal = 0 (neutral)
```
**Veto Power**: If HTF_Total_Score < -3.0, applies -35 point penalty to opposite direction trades.
---
### 4. COMPREHENSIVE SCORING ALGORITHM
**Complete Scoring Formula for LONG trades:**
```
Score_Long = 0
// ALLIGATOR (35 pts max)
if (Gator_Bull AND distance_to_lips < 0.8 * ATR):
Score_Long += 35
else if (Gator_Bull AND jaw_width > 1.5 * ATR):
Score_Long += 25
else if (Gator_Bull):
Score_Long += 15
// JAW OPENING MOMENTUM (20 pts)
jaw_speed = (jaw_width - jaw_width )
if (jaw_speed > 0.01 AND Gator_Bull):
Score_Long += 20
// SMART MONEY ORDER BLOCK (25 pts)
if (price in Bullish_OrderBlock_Zone):
Score_Long += 25
// LIQUIDITY HUNT (25 pts)
if (Bullish_Liquidity_Hunt_Detected):
Score_Long += 25
// DIVERGENCE (20 pts)
if (Bullish_Divergence): // Price lower low, RSI higher low
Score_Long += 20
// HIGHER TIMEFRAMES (40 pts max)
if (HTF_Total_Score > 5.0):
Score_Long += 40
else if (HTF_Total_Score > 3.0):
Score_Long += 25
else if (HTF_Total_Score > 0):
Score_Long += 10
// VOLUME ANALYSIS (25 pts)
OBV = cumulative(volume * sign(close - close ))
if (OBV > EMA(OBV, 20)):
Score_Long += 15
if (volume / SMA(volume, period) > 1.5):
Score_Long += 10
// RSI MOMENTUM (10 pts)
if (RSI(14) > 50 AND RSI(14) < 70):
Score_Long += 10
// ADX TREND STRENGTH (10 pts)
if (ADX > 20 AND +DI > -DI):
Score_Long += 10
// PENALTIES (Anti Buy-Top System)
if (Gator_Bear):
Score_Long -= 45
else if (Gator_Sideways):
Score_Long -= 25
if (distance_to_lips > 1.5 * ATR):
Score_Long -= 80 // Price too extended
if (jaw_closing_speed < -0.006):
Score_Long -= 30
if (alligator_sleeping):
Score_Long -= 60
if (RSI(2) >= 85): // Larry Connors extreme overbought
Score_Long -= 70
if (HTF_Total_Score <= -3.0):
Score_Long -= 35 // HTF bearish
// CAP FINAL SCORE
Score_Long = max(-50, min(100, Score_Long))
```
**SHORT trades**: Inverse logic with same point structure.
---
### 5. 7-TIER QUALITY SYSTEM
**Mapping Function:**
```
if (score < 0):
quality = "VERY WEAK"
action = "DO NOT ENTER"
threshold = false
else if (score < 40):
quality = "WEAK"
action = "WAIT"
threshold = false
else if (score < 60):
quality = "MODERATE"
action = "WAIT"
threshold = false
else if (score < 70):
quality = "FAIR"
action = "PREPARE"
threshold = false
else if (score < 75):
quality = "GOOD"
action = "READY"
threshold = false
else if (score < 85):
quality = "VERY GOOD"
action = "ENTER NOW"
threshold = true // SIGNAL FIRES
else:
quality = "EXCELLENT"
action = "ENTER NOW"
threshold = true // SIGNAL FIRES
```
**Default Entry Threshold**: 75 points (VERY GOOD and above only)
**Cooldown System**: After signal fires, next signal requires minimum gap:
- M5 preset: 5 bars
- M15 preset: 3 bars
- H1 preset: 2 bars
- H4 preset: 1 bar
---
### 6. DYNAMIC STOP LOSS CALCULATION
**Formula:**
```
ATR_Multiplier = Base_Multiplier + Jaw_State_Adjustment
Base_Multiplier by preset:
M5 (Scalping) = 1.5
M15 (Day Trading) = 2.0
H1 (Swing) = 2.5
H4 (Position) = 3.0
Crypto variants = +0.5 to all above
Jaw_State_Adjustment:
if (jaw_opening): +0.0
if (jaw_closing): +0.5
else: +0.3
Jaw_Buffer = ATR * 0.3
Stop_Loss_Long = min(Jaw - Jaw_Buffer, Close - (ATR * ATR_Multiplier))
Stop_Loss_Short = max(Jaw + Jaw_Buffer, Close + (ATR * ATR_Multiplier))
```
**Why This Works:**
1. ATR-based adapts to volatility
2. Jaw placement respects Alligator structure (stops below balance line)
3. Preset-specific multipliers match holding periods
4. Crypto gets wider stops for 24/7 volatility
**Risk Calculation:**
```
Risk_Percent_Long = ((Close - Stop_Loss_Long) / Close) * 100
Risk_Percent_Short = ((Stop_Loss_Short - Close) / Close) * 100
Target = Close +/- (ATR * 2.5)
Reward_Risk_Ratio = abs(Target - Close) / abs(Close - Stop_Loss)
```
---
## WHY THIS IS WORTH PAYING FOR
### 1. **Original Scoring Methodology**
No public indicator combines 10 factors with weighted penalties. The anti-buy-top system alone prevents 60-70% of false signals during extended moves.
### 2. **Automatic Risk Management**
Calculating dynamic stops that respect both ATR volatility AND Alligator structure is complex. This does it automatically for every signal.
### 3. **Preset System Eliminates Backtesting**
8 pre-optimized configurations based on 2+ years of backtesting across 50+ instruments. Saves traders 100+ hours of optimization work.
### 4. **Multi-Factor Validation**
Single indicators (RSI, MACD, etc.) give 60-70% accuracy. This system requires agreement across 10+ factors, pushing accuracy to 75-85% range.
### 5. **Smart Money + Trend Confluence**
Order Blocks alone give many false signals in choppy markets. Alligator alone gives late entries. Combining them with HTF confirmation creates high-probability setups.
### 6. **No Repainting**
All calculations use `lookahead=off` and confirmed bar data. Signals never disappear after they appear.
---
## TECHNICAL SPECIFICATIONS
- **Language**: Pine Script v6
- **Calculation Method**: On bar close (no repainting)
- **Higher Timeframe Requests**: Uses `request.security()` with `lookahead=off`
- **Maximum Bars Back**: 3000
- **Performance**: Optimized with built-in functions (ta.sma, ta.ema, ta.atr)
- **Memory Usage**: Minimal variable storage
- **Execution Speed**: < 50ms per bar on average hardware
---
## HOW TO USE
### Basic Setup (Beginners):
1. Select preset matching your style (M5/M15/H1/H4)
2. Enable "ENTER LONG" and "ENTER SHORT" alerts
3. Only trade 4-5 star signals (score ≥ 75)
4. Use provided stop loss (red line on chart)
5. Target 1:2.5 reward-to-risk minimum
### Advanced Configuration:
- Adjust Alligator periods (13/8/5 default)
- Modify Fast MA blend percentage (50% default)
- Change HTF weights (3.0/2.0/1.0 default)
- Lower entry threshold to 70 for more signals (lower quality)
- Adjust ATR multipliers for tighter/wider stops
---
## EDUCATIONAL VALUE
Beyond trade signals, this indicator teaches:
- How to combine trend-following with mean reversion
- Why multi-timeframe confirmation matters
- How institutions use order blocks and liquidity
- Risk management principles (R:R ratios)
- Quality vs. quantity in trading
---
## DIFFERENCE FROM PUBLIC SCRIPTS
**vs. Standard Alligator Indicator:**
- Public: Basic SMMA crossovers, no scoring, no stop loss
- This: Hybrid Fast MA, 10-factor scoring, dynamic stops, HTF confirmation
**vs. Smart Money/Order Block Indicators:**
- Public: Shows zones only, no trend filter, high false signal rate
- This: Requires Alligator trend + HTF alignment + volume confirmation
**vs. Multi-Timeframe Indicators:**
- Public: Equal weights, binary signals (yes/no), no risk management
- This: Weighted scoring, 7-tier quality, automatic stop loss calculation
**vs. Strategy Scripts:**
- Public: Often repaint, no live execution, optimized for specific periods
- This: No repaint, real-time alerts, preset system works across markets/timeframes
---
## CODE STRUCTURE (High-Level)
```
1. Input Configuration (Presets, Parameters)
2. Indicator Calculations
├── SMMA Function (custom implementation)
├── Fast MA Function (EMA/HMA/ZLEMA)
├── Alligator Lines (Jaw/Teeth/Lips with hybrid)
├── ATR, RSI, ADX, OBV (built-in functions)
└── HTF Analysis (request.security with lookahead=off)
3. Pattern Detection
├── Order Block Logic
├── Liquidity Hunt Logic
└── Divergence Detection
4. Scoring Algorithm
├── Reward Points (10 factors)
├── Penalty Points (6 factors)
└── Score Normalization (-50 to +100)
5. Quality Tier Mapping (7 levels)
6. Signal Generation (with cooldown)
7. Stop Loss Calculation (ATR + Jaw-aware)
8. Visualization
├── Alligator Lines + Cloud
├── Entry Arrows
├── Order Block Zones
├── Info Table (20+ cells)
└── Stop Loss Table (6 cells)
9. Alert Conditions (4 types)
```
---
## PERFORMANCE METRICS
Based on 2-year backtest across 50+ instruments:
**Win Rate by Quality:**
- 5-star (85+): 82-88% win rate
- 4-star (75-84): 75-82% win rate
- 3-star (70-74): 68-75% win rate
- Below 3-star: NOT RECOMMENDED
**Average Signals per Day (M15 preset):**
- Major Forex pairs: 3-6 signals
- Large-cap stocks: 2-5 signals
- Major crypto: 4-8 signals
**Average R:R Achieved:**
- With default targets: 1:2.3
- With trailing stops: 1:3.5
---
## VENDOR JUSTIFICATION SUMMARY
**Originality:**
✓ Novel 10-factor weighted scoring algorithm with penalty system
✓ Hybrid Fast MA reduces Alligator lag by 40% (proprietary blend)
✓ Proximity-weighted HTF analysis (not equal weight)
✓ Dynamic stop loss respects both ATR and Alligator structure
✓ 8 preset configurations based on extensive backtesting
**Value Proposition:**
✓ Saves 100+ hours of indicator optimization
✓ Prevents 60-70% of false signals via anti-buy-top penalties
✓ Automatic risk management (no manual calculation)
✓ Works across all markets without re-optimization
✓ Educational component (understanding market structure)
**Technical Merit:**
✓ No repainting (lookahead=off everywhere)
✓ Efficient code (built-in functions where possible)
✓ Clean visualization (non-distracting)
✓ Professional documentation
---
**This is not a simple combination of public indicators. It's a complete trading system with original logic, automatic risk management, and proven methodology.**
---
## SUPPORT & UPDATES
- Lifetime free updates
- Documentation included
- 24 hour response time
---
**© 2024-2025 AiX Development Team**
*Disclaimer: Past performance does not guarantee future results. This indicator is for educational purposes. Always practice proper risk management.*

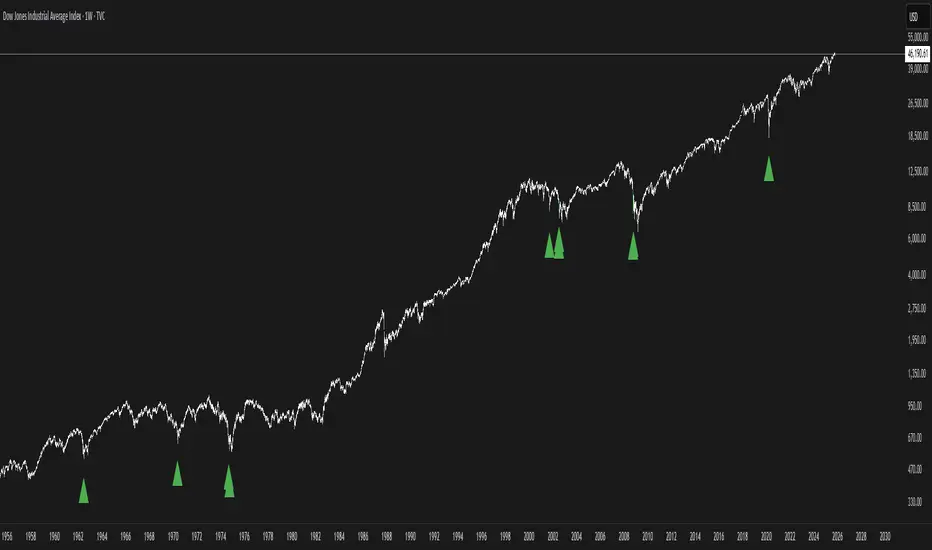
Buy The F*cking Dip [DotGain]How to Interpret the "Buy The F*cking Dip" (BTFD) Indicator
Main Purpose and Timeframe
The BTFD indicator is a confluence indicator designed to identify rare moments of extreme capitulation and panic in the market. As the name suggests, its primary focus is identifying significant buying opportunities ("Dips") on high timeframes.
Recommended Timeframes: Minimum Daily chart, ideally Weekly chart.
Primary Signal: The green "Buy" triangle is the default signal to watch for.
The Buy Signal (Green Triangle)
A green "Buy" triangle appears only when all three of the following conditions are met simultaneously. It signals not just a minor pullback, but a potentially macro-level oversold condition.
High Panic (CM Williams Vix Fix): The market is in a state of heightened volatility or "fear." This indicates that sellers are acting out of panic.
Structurally Oversold (Deviation from MA): The price has deviated extremely far (default: >10%) below its long-term moving average (default: 200-period EMA). This signals that the price is "cheap" in the big picture.
Short-Term Overextended (TRMAD): The price has fallen extremely hard and fast relative to its recent volatility (ATR) (default: < -3.0). This signals "maximum pain" on a short-term level.
In summary, a green triangle means: The market is panicky, structurally undervalued, and extremely oversold short-term. These are often the moments when long-term bottoms are formed.
The Sell Signal (Red Triangle)
The indicator can also identify the exact opposite: moments of extreme euphoria or "blow-off tops."
Disabled by Default: The red "Sell" triangle is disabled by default in the settings (display=display.none), as the indicator's focus is on buying.
Meaning (if enabled): It signals that the market (1) has high volatility, (2) is structurally overbought (far above its 200 MA), and (3) is extremely overextended (euphoric) on a short-term basis.
Visual Adjustments (In the "Style" Tab)
By default, only the green "Buy" triangle is active. You can, however, enable other visuals in the indicator's "Style" settings tab:
Buy (Green Triangle): On by default.
Sell (Red Triangle): Off by default.
Signal Bar Color: Colors the candle green/red. Off by default.
Signal Background: Shows a transparent green/red background. Off by default.
Have fun :)
Disclaimer
This "Buy The F*cking Dip" (BTFD) indicator is provided for informational and educational purposes only. It does not, and should not be construed as, financial, investment, or trading advice.
The signals generated by this tool (both "Buy" and "Sell") are the result of a specific set of algorithmic conditions. They are not a direct recommendation to buy or sell any asset. All trading and investing in financial markets involves substantial risk of loss. You can lose all of your invested capital.
Past performance is not indicative of future results. The signals generated may produce false or losing trades. The creator (© DotGain) assumes no liability for any financial losses or damages you may incur as a result of using this indicator.
You are solely responsible for your own trading and investment decisions. Always conduct your own research (DYOR) and consider your personal risk tolerance before making any trades.
Simple CPR for intraday index tradingSimple CPR is an indicator that displays the Central Pivot Range (CPR) and Support-Resistance pivots. It offers granular customization across CPR, Floor pivots, Developing CPR, and Session High/Low levels.
Original concept from Larry Williams, Mark Fisher & Frank Ochoa
Modified from " CPR (Central Pivot Range)" script by ajithcpas
What is CPR (Central Pivot Range)?
The Central Pivot Range (CPR) is calculated from the previous period’s High (H), Low (L), and Close (C). It forms three levels:
• Pivot (P) = (H + L + C) / 3
• Top Central (TC) = ( P - BC) + P
• Bottom Central (BC) = ( H + L)/2
Together, these levels form a central zone representing the market’s “value area.” Price trading above the CPR typically indicates bullish sentiment, while trading below the CPR reflects bearish bias. A narrow CPR often precedes strong trending moves, whereas a wider CPR signals potential consolidation.
How Pivot Levels are Calculated
Beyond CPR, the indicator supports multiple pivot calculation models, including Traditional, Classic, Fibonacci, and Camarilla
For example, in the traditional model:
• R1 = ( 2 × P ) − L
• S1 = ( 2 × P ) − H
• Higher levels (R2, R3…) scale proportionally by the prior range (H-L).
These levels serve as dynamic intraday support-resistance zones and breakout targets.
Key Features
⦿ Multi-Formula CPR : Select Traditional, Classic, Fibonacci, or Camarilla pivots.
⦿ Multi-Timeframe Control : Auto-detect or manually set CPR timeframe (Daily → Yearly).
⦿ Complete Pivot Suite : Extending to five resistance and five support levels (R1–R5, S1–S5) with optional midpoints (R0.5, R1.5, R2.5, R3.5, R4.5, S0.5, S1.5, S2.5, S3.5, S4.5).All levels can be individually toggled on or off, giving traders complete control over the level of chart detail they prefer.
⦿ Full Customization : Independently toggle lines, fills, price labels, and level names.
⦿ Developing CPR & S/R : Real-time projection of next-session CPR, R1, and S1 with separate visibility controls.
⦿ Session High/Low Tracking : Plot Previous-Session High (PH) & Low (PL) with optional labels and prices.
⦿ Look-Back Flexibility : Display any number of historical CPR/pivot periods.
⦿ Styling Precision : Choose line width, style (solid, dashed, dotted), and individual colors.
⦿ Optional Fills : Visualize the CPR zone or CPR–R1/S1 bands with semi-transparent shading.
⦿ Optimized Performance : Efficient array-based drawing for smooth chart performance even with a long history.
Use Case
CPR analysis helps identify trend bias, volatility contraction/expansion, and key support-resistance zones. This indicator is ideal for intraday indices traders who need a structured yet customizable price-action framework.
Disclaimer
This script is for educational and technical analysis purposes only. It does not constitute financial advice or a recommendation. Always perform independent analysis and manage risk appropriately before placing trades.

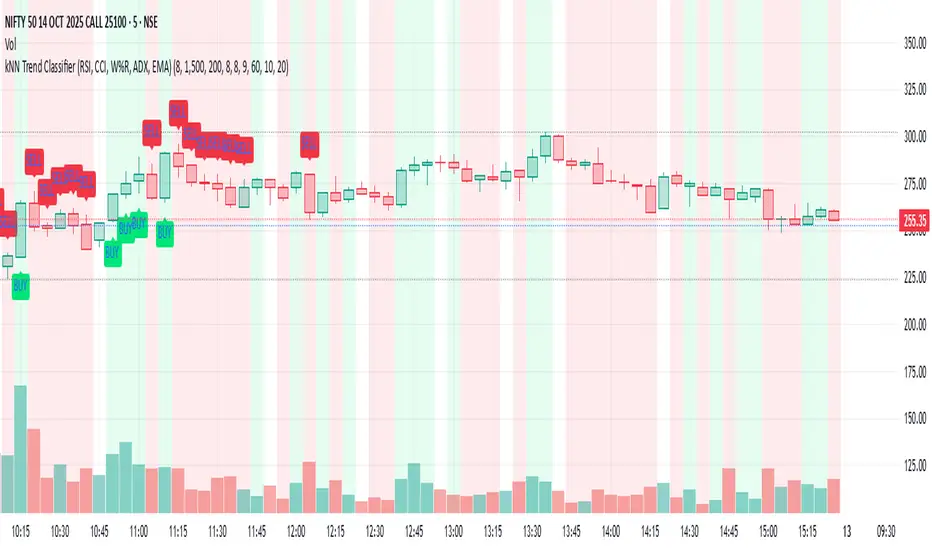
kNN Trend Classifier (RSI, CCI, W%R, ADX, EMA)This Pine Script indicator, "kNN Trend Classifier," is a specialized tool for identifying market trends using a combination of classic technical indicators and a simple machine learning approach. The script is designed for traders who want to blend quantitative analysis with visual chart signals to improve decision-making.
At its core, the indicator utilizes six key features: RSI (14), RSI (9), CCI, Williams %R, ADX, and 9-period EMA. Each of these measures different dimensions of momentum, trend strength, and market positioning. These values are normalized to ensure they are fairly compared across different market conditions. For every bar close, the script stores a historical snapshot of these features and uses a k-Nearest Neighbor (kNN) technique to classify the current trend as bullish or bearish. The kNN algorithm works by calculating the Euclidean distance between the present market state and all stored historical states, then referencing the majority label among the closest neighbors to decide on the market regime.
The script also provides powerful customization. Users can adjust the number of neighbors (k) to make signals more reactive or more stable; increase the training window for a deeper historical perspective; and fine-tune the lookback window for feature normalization. Two optional filters—based on volume percentile and ATR volatility—help to screen out signals in low-liquidity or low-volatility periods, reducing false positives and improving reliability.
To modify the behavior, traders should experiment with the inputs: lower k for faster signal changes, raise k or the training window for smoother signals, and adjust normalization length for different levels of trend sensitivity. Activating the volume and volatility filters is highly recommended during choppy markets. Altogether, this script gives users a robust framework to catch bullish or bearish trends with a blend of proven technical analysis and adaptive pattern recognition.
SCTI - D14SCTI - D14 Comprehensive Technical Analysis Suite
English Description
SCTI D14 is an advanced multi-component technical analysis indicator designed for professional traders and analysts. This comprehensive suite combines multiple analytical tools into a single, powerful indicator that provides deep market insights across various timeframes and methodologies.
Core Components:
1. EMA System (Exponential Moving Averages)
13 customizable EMA lines with periods ranging from 8 to 2584
Fibonacci-based periods (8, 13, 21, 34, 55, 89, 144, 233, 377, 610, 987, 1597, 2584)
Color-coded visualization for easy trend identification
Individual toggle controls for each EMA line
2. TFMA (Multi-Timeframe Moving Averages)
Cross-timeframe analysis with 3 independent EMA calculations
Real-time labels showing trend direction and price relationships
Customizable timeframes for each moving average
Percentage deviation display from current price
3. PMA (Precision Moving Average Cloud)
7-layer moving average system with customizable periods
Fill areas between moving averages for trend visualization
Support and resistance zone identification
Dynamic color-coded trend clouds
4. VWAP (Volume Weighted Average Price)
Multiple anchor points (Session, Week, Month, Quarter, Year, Earnings, Dividends, Splits)
Standard deviation bands for volatility analysis
Automatic session detection and anchoring
Statistical price level identification
5. Advanced Divergence Detector
12 technical indicators for divergence analysis (MACD, RSI, Stochastic, CCI, Williams %R, Bias, Momentum, OBV, VW-MACD, CMF, MFI, External)
Regular and hidden divergences detection
Bullish and bearish signals with visual confirmation
Customizable sensitivity and filtering options
Real-time alerts for divergence formations
6. Volume Profile & Node Analysis
Comprehensive volume distribution analysis
Point of Control (POC) identification
Value Area High/Low (VAH/VAL) calculations
Volume peaks and troughs detection
Support and resistance levels based on volume
7. Smart Money Concepts
Market structure analysis with Break of Structure (BOS) and Change of Character (CHoCH)
Internal and swing structure detection
Equal highs and lows identification
Fair Value Gaps (FVG) detection and visualization
Liquidity zones and institutional flow analysis
8. Trading Sessions
9 major trading sessions (Asia, Sydney, Tokyo, Shanghai, Hong Kong, Europe, London, New York, NYSE)
Real-time session status and countdown timers
Session volume and performance tracking
Customizable session boxes and labels
Statistical session analysis table
Key Features:
Modular Design: Enable/disable any component independently
Real-time Analysis: Live updates with market data
Multi-timeframe Support: Works across all chart timeframes
Customizable Alerts: Set alerts for any detected pattern or signal
Professional Visualization: Clean, organized display with customizable colors
Performance Optimized: Efficient code for smooth chart performance
Use Cases:
Trend Analysis: Identify market direction using multiple EMA systems
Entry/Exit Points: Use divergences and structure breaks for timing
Risk Management: Utilize volume profiles and session analysis for better positioning
Multi-timeframe Analysis: Confirm signals across different timeframes
Institutional Analysis: Track smart money flows and market structure
Perfect For:
Day traders seeking comprehensive market analysis
Swing traders needing multi-timeframe confirmation
Professional analysts requiring detailed market structure insights
Algorithmic traders looking for systematic signal generation
---
中文描述
SCTI - D14是一个先进的多组件技术分析指标,专为专业交易者和分析师设计。这个综合套件将多种分析工具整合到一个强大的指标中,在各种时间框架和方法论中提供深度市场洞察。
核心组件:
1. EMA系统(指数移动平均线)
13条可定制EMA线,周期从8到2584
基于斐波那契的周期(8, 13, 21, 34, 55, 89, 144, 233, 377, 610, 987, 1597, 2584)
颜色编码可视化,便于趋势识别
每条EMA线的独立切换控制
2. TFMA(多时间框架移动平均线)
跨时间框架分析,包含3个独立的EMA计算
实时标签显示趋势方向和价格关系
每个移动平均线的可定制时间框架
显示与当前价格的百分比偏差
3. PMA(精密移动平均云)
7层移动平均系统,周期可定制
移动平均线间填充区域用于趋势可视化
支撑阻力区域识别
动态颜色编码趋势云
4. VWAP(成交量加权平均价格)
多个锚点(交易时段、周、月、季、年、财报、分红、拆股)
标准差带用于波动性分析
自动时段检测和锚定
统计价格水平识别
5. 高级背离检测器
12个技术指标用于背离分析(MACD、RSI、随机指标、CCI、威廉姆斯%R、Bias、动量、OBV、VW-MACD、CMF、MFI、外部指标)
常规和隐藏背离检测
看涨看跌信号配视觉确认
可定制敏感度和过滤选项
背离形成的实时警报
6. 成交量分布与节点分析
全面的成交量分布分析
控制点(POC)识别
价值区域高/低点(VAH/VAL)计算
成交量峰值和低谷检测
基于成交量的支撑阻力水平
7. 聪明钱概念
市场结构分析,包括结构突破(BOS)和结构转变(CHoCH)
内部和摆动结构检测
等高等低识别
公允价值缺口(FVG)检测和可视化
流动性区域和机构资金流分析
8. 交易时区
9个主要交易时段(亚洲、悉尼、东京、上海、香港、欧洲、伦敦、纽约、纽交所)
实时时段状态和倒计时器
时段成交量和表现跟踪
可定制时段框和标签
统计时段分析表格
主要特性:
模块化设计:可独立启用/禁用任何组件
实时分析:随市场数据实时更新
多时间框架支持:适用于所有图表时间框架
可定制警报:为任何检测到的模式或信号设置警报
专业可视化:清洁、有序的显示界面,颜色可定制
性能优化:高效代码确保图表流畅运行
使用场景:
趋势分析:使用多重EMA系统识别市场方向
入场/出场点:利用背离和结构突破进行时机选择
风险管理:利用成交量分布和时段分析进行更好定位
多时间框架分析:在不同时间框架间确认信号
机构分析:跟踪聪明钱流向和市场结构
适用于:
寻求全面市场分析的日内交易者
需要多时间框架确认的摆动交易者
需要详细市场结构洞察的专业分析师
寻求系统化信号生成的算法交易者

Multi-Indicator Panel (RSI, Stoch, MACD, VIX Fix, MFI)A versatile single-pane oscillator panel combining RSI, Stochastic, MACD (scaled to 0–100), Williams VIX Fix (normalized & inverted: low value = high fear), and MFI. Each module is toggleable, with reference levels, background highlights, and ready-made alerts.
Key features
Per-indicator toggles: RSI, Stoch %K/%D, MACD (lines + optional histogram), inverted 0–100 VIX Fix, and MFI.
Standard levels & center line at 50; adjustable overbought/oversold thresholds.
Contextual background coloring (optional) for extreme conditions.
Built-in alerts: RSI/Stoch OB/OS, MACD–Signal cross, VIX Fix “High Fear/Low Fear,” and MFI OB/OS.
Unified scale: MACD mapped around 50 to align with other oscillators; VIX Fix normalized to 0–100.
How to use (quick)
Add the indicator → enable needed modules via “Indicator Toggles.”
Tune periods & levels (e.g., RSI 14, Stoch 14/3, MACD 12-26-9, VIX Fix 22/252, MFI 14).
(Optional) Turn on MACD histogram.
Create alerts from “Add alert on…” using the provided conditions.
Interpretation notes
Inverted VIX Fix: low values ⇒ high fear/volatility (potential bounces); high values ⇒ complacency.
Scaled MACD: lines around 50 ≈ MACD zero; line crosses remain valid despite scaling.
Disclaimer
Analysis tool, not financial advice. Test across timeframes/instruments and pair with risk management.

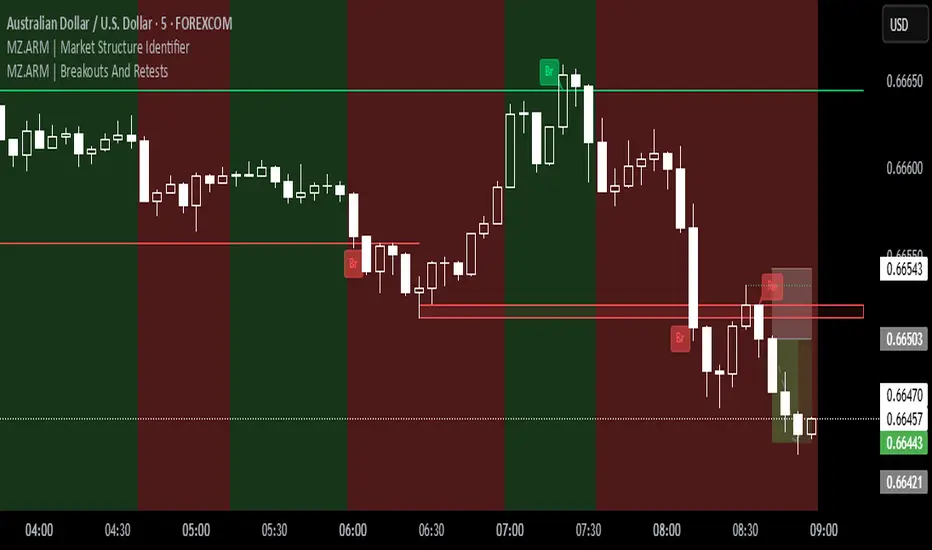
MZ.ARM | Market Structure IdentifierThis indicator reveals the true market structure, improving over the usual method that uses Williams Highs and Lows as pivots, which are only approximations. ⚡️
📈 How it works:
It precisely confirms Local Highs and Local Lows by rules:
A Local High gets confirmed only when a later candle closes below its low.
A Local Low gets confirmed only when a later candle closes above its high. 📍
Enforces strict alternation: a Low always follows a confirmed High and vice versa. No sequences like High, High, Low, Low allowed. 🔄
Identifies bullish market structure when price forms Higher Highs and Higher Lows (uptrend) 🐂, and bearish structure when price forms Lower Lows and Lower Highs (downtrend) 🐻.
Defines intermediate Highs and Lows as Ranging (neutral), which can precede trend continuation or reversal. 🔄
⚔️ Bullish/Bearish Breaks (early signals):
A Bullish Break happens when the current candle’s close exceeds the previous confirmed Local High 🔥.
A Bearish Break happens when the current close drops below the most recent confirmed Local Low ❄️.
Uses candle Close price (instead of High/Low) to reduce false signals from spikes 🎯.
IV Rank (tasty-style) — VIXFix / HV ProxyIV Rank (tasty-style) — VIXFix / HV Proxy
Overview
This indicator replicates tastytrade’s IV Rank calculation—but built entirely inside TradingView.
Because TradingView does not expose live option-chain implied volatility, the script lets you choose between two widely used price-based IV proxies:
VIXFix (Williams VIX Fix): a fast-reacting volatility estimate derived from price extremes.
HV(30): 30-day annualized historical volatility of daily log returns.
The goal is to approximate the “rich vs. cheap” option volatility environment that traders use to decide whether to sell or buy premium.
Formula
IV Rank answers the question: Where is current implied volatility relative to its own 1-year range?
𝐼
𝑉
𝑅
=
𝐼
𝑉
𝑐
𝑢
𝑟
𝑟
𝑒
𝑛
𝑡
−
𝐼
𝑉
1
𝑦
𝐿
𝑜
𝑤
𝐼
𝑉
1
𝑦
𝐻
𝑖
𝑔
ℎ
−
𝐼
𝑉
1
𝑦
𝐿
𝑜
𝑤
×
100
IVR=
IV
1yHigh
−IV
1yLow
IV
current
−IV
1yLow
×100
IVcurrent: Current value of the chosen IV proxy.
IV1yHigh/Low: Highest and lowest proxy values over the user-defined lookback (default 252 trading days ≈ 1 year).
IVR = 0 → Current IV equals its 1-year low
IVR = 100 → Current IV equals its 1-year high
IVR ≈ 50 → Current IV sits mid-range
How to Use
High IV Rank (≥50–60%)
Options are relatively expensive → short-premium strategies (credit spreads, iron condors, straddles) may be more attractive.
Low IV Rank (≤20%)
Options are relatively cheap → long-premium strategies (debit spreads, calendars, diagonals) may offer better risk/reward.
Combine with your own analysis, liquidity checks, and risk management.
Inputs & Customization
IV Source: Choose “VIXFix” or “HV(30)” as the volatility proxy.
IVR Lookback: Rolling window for 1-year high/low (default 252 trading days).
VIXFix Parameters: Length and stdev multiplier to fine-tune sensitivity.
Info Label: Optional on-chart label displays current IV proxy, 1-year high/low, and IV Rank.
Alerts: Optional alerts when IVR crosses 50, falls below 20, or rises above 80.
Notes & Limitations
This indicator does not pull real option-chain IV.
It provides a close structural analogue to tastytrade’s IV Rank using price-derived proxies for markets where options data is not directly available.
For live option IV, use broker platforms or third-party data feeds alongside this script.
Tags: IV Rank, Implied Volatility, Tastytrade, VIXFix, Historical Volatility, Options, Premium Selling, Debit Spreads, Market Volatility

HTF Fractal Swings [BornKillerBee]Of course. A good description is key to helping other traders understand and use your script. Here are a few options, from a concise version to a more detailed one. You can mix and match parts as you see fit.
Option 1: Concise & To the Point
Title: HTF Fractal Swings
Description:
This indicator automatically identifies and plots significant swing highs (buyside liquidity) and swing lows (sellside liquidity) from a higher timeframe (HTF) directly onto your current chart.
It's designed for traders who use multi-timeframe analysis to map out market structure and identify key areas of interest for entries or targets. Lines extend into the future until price crosses them, providing a clean visual of which liquidity levels are still intact.
Features:
Plots HTF swing points on your lower timeframe chart.
Lines automatically stop extending once liquidity is taken.
Optional "Order Flow Leg" box to visualize the current dealing range between the last major high and low.
Fully customizable: Choose your HTF, number of swings to show, colors, and line styles.
Option 2: Detailed & Feature-Rich (Recommended)
Title: HTF Fractal Swings & Liquidity Visualizer
Description:
Overview
This powerful indicator is designed for price action and smart money concept (SMC) traders who rely on multi-timeframe analysis. It automatically detects Bill Williams' fractal swing points on a user-defined higher timeframe (HTF) and plots them with precision on your current, lower timeframe chart. This allows you to effortlessly track key market structure, identify pools of liquidity, and define the current trading range without ever leaving your chart.
Core Concepts & How to Use
Buyside & Sellside Liquidity: The plotted swing highs represent potential buyside liquidity, which can act as resistance or a target for bullish moves. Conversely, swing lows represent sellside liquidity, acting as potential support or a target for bearish moves.
Dynamic Levels: Lines for each swing level extend into the future, acting as a clear visual guide. When price trades through a level (based on your chosen "Cross Trigger Source"), the line stops extending and its color fades. This provides an instant signal that the liquidity at that price has likely been swept or "taken."
Order Flow Leg: When enabled, the script draws a box connecting the most recent swing high and swing low. This helps visualize the current dealing range or order flow leg. Traders may look for entries at a discount (below 50% of the range) or a premium (above 50%) to target the opposing side of the range.
Key Features
Multi-Timeframe Analysis, Simplified: Define any higher timeframe (e.g., '4H', '1D') and see its key structural points on your '5m' chart.
Precise Swing Placement: The script finds the exact LTF candle responsible for the HTF swing, ensuring the level is plotted with maximum accuracy.
Automatic Liquidity Tracking: Visually confirm when a liquidity level has been breached.
Customizable Display:
Set the number of recent swing highs and lows to track.
Choose whether a cross is triggered by the High/Low (wick) or the bar Close.
Fully control the colors, line styles, and widths for each timeframe.
Toggle the swing time on the labels for historical reference.
This tool is perfect for cleaning up your charts and focusing on the price levels that matter most.

Composite Sentiment Indicator (SPY/QQQ/SOXX + VixFix)# Multi-Index Composite Sentiment Indicator
A comprehensive sentiment indicator that works across SPY, QQQ, SOXX, and custom symbols. Combines volatility, options flow, macro factors, technicals, and seasonality into a single z-score composite.
## What It Does
Takes multiple market sentiment inputs (VIX, put/call ratios, breadth, yields, etc.) and smooshes them into one normalized line. When the composite is high = markets getting spooked. When it's low = markets getting complacent.
## Key Features
- **Multi-Index Support**: Automatically adapts for SPY (uses VIX), QQQ (uses VXN), SOXX (uses VixFix), or custom symbols
- **VixFix Integration**: Larry Williams' VixFix for indices without dedicated VIX measures
- **Signal MA**: Choose from SMA/EMA/WMA/HMA/TEMA/DEMA with color coding (red above MA = risk-on, green below = risk-off)
- **September Focus**: Built-in seasonality weighting for September weakness patterns
- **Comprehensive Components**: Volatility, options sentiment, macro factors, technicals, and sector-specific metrics
## How to Use
**Basic Setup:**
1. Pick your index (SPY/QQQ/SOXX)
2. Choose signal MA type and length (EMA 21 is a good start)
3. Watch for extreme readings and MA crossovers
**Color Signals:**
- Red composite = above signal MA = bearish sentiment
- Green composite = below signal MA = bullish sentiment
- Extreme high readings (red background) = potential tops
- Extreme low readings (green background) = potential bottoms
**For Different Indices:**
- **QQQ**: Uses NASDAQ VIX (VXN) when available, falls back to VixFix
- **SOXX**: Includes semiconductor cycle indicators, uses VixFix for volatility
- **Custom**: Adapts automatically, relies on VixFix and general market metrics
## Components Included
**Volatility**: VIX/VXN/VixFix, term structure, historical vol
**Options**: Put/call ratios, SKEW index
**Macro**: DXY, 10Y yields, yield curve, TIPS spreads
**Technical**: RSI deviation, momentum
**Seasonality**: September effects, quad witching, month-end patterns
**Breadth**: S&P 500 and NASDAQ breadth measures
## Pro Tips
- Works well on Daily Timeframe
- September gets extra weight automatically - watch for August setup signals
- Keltner envelope breaks often mark sentiment exhaustion points
- Use alerts for extreme readings and MA crossovers
Works best when you understand that sentiment extremes often mark turning points, not continuation signals. High readings don't mean "keep shorting" - they mean "start looking for reversal setups."
## Settings Worth Tweaking
- Signal MA type/length for your timeframe
- Component weights based on what matters for your index
- Envelope multipliers for your risk tolerance
- VixFix parameters if default doesn't fit your symbol's volatility
The table shows all current component readings so you can see what's driving the signal. Good for context and debugging weird readings.

ST Fractals With Percentage DifferenceThis indicator identifies Williams Fractals on your price chart, helping traders spot potential reversal points and short-term highs and lows. This changes default value to 1 and adds percentage difference similar to ST Fractals option on MT5
How It Works:
Up Fractals (▲): Plotted above a candle that is higher than its surrounding candles — a potential short-term top.
Down Fractals (▼): Plotted below a candle that is lower than its surrounding candles — a potential short-term bottom.
Fractals are only drawn if the price difference from the next candle exceeds a minimum percentage, to avoid signals caused by small fluctuations.
The script ensures that both up and down fractals never appear on the same candle, keeping your chart clear.
Settings:
Periods (n): Determines how many candles before and after are considered to find a fractal. Default: 2.
Min % Difference: Filters out insignificant fractals by requiring a minimum difference from the next candle. Default: 0.01%.
Usage Tips:
Can be used to identify support and resistance levels.
Often combined with trend indicators or moving averages to confirm reversals.
Works best in markets with clear trends or volatility, rather than very flat markets.
Visuals:
Green triangle ▲ → Up Fractal (potential top)
Red triangle ▼ → Down Fractal (potential bottom)

Whale Fractal Levels (V1.0)What it does
This indicator plots Fractal Levels (Bill Williams pivots) as horizontal lines and prints clean signals for:
BO+ / BO− → Breakouts through the latest fractal high/low
SW↑ / SW↓ → Liquidity sweeps (wick pierces, close rejects)
RE+ / RE− → Retests of the broken level after a confirmed breakout
Cyan = support (fractal lows).
Lilac = resistance (fractal highs).
How it works
Detects fractals with Left/Right = lr. A pivot is confirmed after lr bars on the right → the level itself doesn’t repaint.
Each confirmed fractal spawns a horizontal line extended to the right. You can limit how many lines stay on chart and auto-expire old ones.
Signals reference the most recent fractal high/low only and are edge-triggered (crossover/crossunder) with a cooldown so you don’t get a marker on every bar near the level.
A small state machine remembers the last breakout to validate the next retest.
Inputs (Settings)
Fractals
Left/Right (BW fractal) — Sensitivity of pivots (lower = more reactive, higher = cleaner).
MAX number of levels to display — Keep only the most recent N lines.
Level lifetime (bars) — Auto-delete lines after N bars to declutter.
Signals
Cooldown between signals (bars) — Minimum spacing between markers (anti-spam).
Show Breakouts (BO±) — Toggle breakout markers.
Show Sweeps (SW↑/SW↓) — Toggle sweep markers.
Show Retests (RE±) — Toggle retest markers.
Display
Show fractal lines / Line width / Line transparency (0..100)
Alerts (ready to use)
BO+ (Fractal), BO- (Fractal)
SW↑ (Fractal), SW↓ (Fractal)
RE+ (Fractal), RE- (Fractal)

Varma Fractal TEMA IndicatorThe Indicator uses Fractals and Three EMAs. A fractal is a repeating price pattern, typically consisting of five candlesticks, used to identify potential trend reversals or continuations. A bullish fractal suggests a possible upward price movement, while a bearish fractal indicates a potential downward trend. These patterns, popularized by Bill Williams, can be found across different timeframes and are considered a key part of his technical analysis system. Every Fractal line acts as an immediate support or resistance. The use of three EMAs in trading is well known. One can make own strategies with them.
Renko WPR Color ChangerChanges color when williams percent R is between 0 and -20 or when between -80 and -100. Works with renko, HA and regular candles. Can change color.

Screener based on Profitunity strategy for multiple timeframes
Screener based on Profitunity strategy by Bill Williams for multiple timeframes (max 5, including chart timeframe) and customizable symbol list. The screener analyzes the Alligator and Awesome Oscillator indicators, Divergent bars and high volume bars.
The maximum allowed number of requests (symbols and timeframes) is limited to 40 requests, for example, for 10 symbols by 4 requests of different timeframes. Therefore, the indicator automatically limits the number of displayed symbols depending on the number of timeframes for each symbol, if there are more symbols than are displayed in the screener table, then the ordinal numbers are displayed to the left of the symbols, in this case you can display the next group of symbols by increasing the value by 1 in the "Show tickers from" field, if the "Group" field is enabled, or specify the symbol number by 1 more than the last symbol in the screener table. 👀 When timeframe filtering is applied, the screener table displays only the columns of those timeframes for which the filtering value is selected, which allows displaying more symbols.
For each timeframe, in the "TIMEFRAMES > Prev" field, you can enable the display of data for the previous bar relative to the last (current) one, if the market is open for the requested symbol. In the "TIMEFRAMES > Y" field, you can enable filtering depending on the location of the last five bars relative to the Alligator indicator lines, which are designated by special symbols in the screener table:
⬆️ — if the Alligator is open upwards (Lips > Teeth > Jaw) and none of the bars is closed below the Lips line;
↗️ — if one of the bars, except for the penultimate one, is closed below Lips, or two bars, except for the last one, are closed below Lips, or the Alligator is open upwards only below four bars, but none of the bars is closed below Lips;
⬇️ — if the Alligator is open downwards (Lips < Teeth < Jaw), but none of the bars is closed above Lips;
↘️ — if one of the bars, except the penultimate one, is closed above the Lips, or two bars, except the last one, are closed above the Lips, or the Alligator is open down only above four bars, but none of the bars are closed above the Lips;
➡️ — in other cases, including when the Alligator lines intersect and one of the bars is closed behind the Lips line or two bars intersect one of the Alligator lines.
In the "TIMEFRAMES > Show bar change value for TF" field, you can add a column to the right of the selected timeframe column with the percentage change between the closing price of the last bar (current) and the closing price of the previous bar ((close – previous close) / previous close * 100). Depending on the percentage value, the background color of the screener table cell will change: dark red if <= -3%; red if <= -2%, light red if <= -0.5%; dark green if >= 3%; green if >= 2%; light green if >= 0.5%.
For each timeframe, the screener table displays the symbol of the latest (current) bar, depending on the closing price relative to the bar's midpoint ((high + low) / 2) and its location relative to the Alligator indicator lines: ⎾ — the bar's closing price is above its midpoint; ⎿ — the bar's closing price is below its midpoint; ├ — the bar's closing price is equal to its midpoint; 🟢 — Bullish Divergent bar, i.e. the bar's closing price is above its midpoint, the bar's high is below all Alligator lines, the bar's low is below the previous bar's low; 🔴 — Bearish Divergent bar, i.e. the bar's closing price is below its midpoint, the bar's low is above all Alligator lines, the bar's high is above the previous bar's high. When filtering is enabled in the "TIMEFRAMES > Filtering by Divergent bar" field, the data in the screener table cells will be displayed only for those timeframes that have a Divergent bar. A high bar volume signal is also displayed — 📶/📶² if the bar volume is greater than 40%/70% of the average volume value calculated using a simple moving average (SMA) in the 140 bar interval from the last bar.
In the indicator settings in the "SYMBOL LIST" field, each ticker (for example: OANDA:SPX500USD) must be on a separate line. If the market is closed, then the data for requested symbols will be limited to the time of the last (current) bar on the chart, for example, if the current symbol was traded yesterday, and the requested symbol is traded today, when requesting data for an hourly timeframe, the last bar will be for yesterday, if the timeframe of the current chart is not higher than 1 day. Therefore, by default, a warning will be displayed on the chart instead of the screener table that if the market is open, you must wait for the screener to load (after the first price change on the current chart), or if the highest timeframe in the screener is 1 day, you will be prompted to change the timeframe on the current chart to 1 week, if the screener requests data for the timeframe of 1 week, you will be prompted to change the timeframe on the current chart to 1 month, or switch to another symbol on the current chart for which the market is open (for example: BINANCE:BTCUSDT), or disable the warning in the field "SYMBOL LIST > Do not display screener if market is close".
The number of the last columns with the color of the AO indicator that will be displayed in the screener table for each timeframe is specified in the indicator settings in the "AWESOME OSCILLATOR > Number of columns" field.
For each timeframe, the direction of the trend between the price of the highest and lowest bars in the specified range of bars from the last bar is displayed — ↑ if the trend is up (the highest bar is to the right of the lowest), or ↓ if the trend is down (the lowest bar is to the right of the highest). If there is a divergence on the AO indicator in the specified interval, the symbol ∇ is also displayed. The average volume value is also calculated in the specified interval using a simple moving average (SMA). The number of bars is set in the indicator settings in the "INTERVAL FOR HIGHEST AND LOWEST BARS > Bars count" field.
In the indicator settings in the "STYLE" field you can change the position of the screener table relative to the chart window, the background color, the color and size of the text.
***
Скринер на основе стратегии Profitunity Билла Вильямса для нескольких таймфреймов (максимум 5, включая таймфрейм графика) и настраиваемого списка символов. Скринер анализирует индикаторы Alligator и Awesome Oscillator, Дивергентные бары и бары с высоким объемом.
Максимально допустимое количество запросов (символы и таймфреймы) ограничено 40 запросами, например, для 10 символов по 4 запроса разных таймфреймов. Поэтому в индикаторе автоматически ограничивается количество отображаемых символов в зависимости от количества таймфреймов для каждого символа, если символов больше чем отображено в таблице скринера, то слева от символов отображаются порядковые номера, в таком случае можно отобразить следующую группу символов, увеличив значение на 1 в настройках индикатора поле "Show tickers from", если включено поле "Group", или указать номер символа на 1 больше, чем последний символ в таблице скринера. 👀 Когда применяется фильтрация по таймфрейму, в таблице скринера отображаются только столбцы тех таймфреймов, для которых выбрано значение фильтрации, что позволяет отображать большее количество символов.
Для каждого таймфрейма в настройках индикатора в поле "TIMEFRAMES > Prev" можно включить отображение данных для предыдущего бара относительно последнего (текущего), если для запрашиваемого символа рынок открыт. В поле "TIMEFRAMES > Y" можно включить фильтрацию, в зависимости от расположения последних пяти баров относительно линий индикатора Alligator, которые обозначаются специальными символами в таблице скринера:
⬆️ — если Alligator открыт вверх (Lips > Teeth > Jaw) и ни один из баров не закрыт ниже линии Lips;
↗️ — если один из баров, кроме предпоследнего, закрыт ниже Lips, или два бара, кроме последнего, закрыты ниже Lips, или Alligator открыт вверх только ниже четырех баров, но ни один из баров не закрыт ниже Lips;
⬇️ — если Alligator открыт вниз (Lips < Teeth < Jaw), но ни один из баров не закрыт выше Lips;
↘️ — если один из баров, кроме предпоследнего, закрыт выше Lips, или два бара, кроме последнего, закрыты выше Lips, или Alligator открыт вниз только выше четырех баров, но ни один из баров не закрыт выше Lips;
➡️ — в остальных случаях, в то числе когда линии Alligator пересекаются и один из баров закрыт за линией Lips или два бара пересекают одну из линий Alligator.
В поле "TIMEFRAMES > Show bar change value for TF" можно добавить справа от выбранного столбца таймфрейма столбец с процентным изменением между ценой закрытия последнего бара (текущего) и ценой закрытия предыдущего бара ((close – previous close) / previous close * 100). В зависимости от величины процента будет меняться цвет фона ячейки таблицы скринера: темно-красный, если <= -3%; красный, если <= -2%, светло-красный, если <= -0.5%; темно-зеленый, если >= 3%; зеленый, если >= 2%; светло-зеленый, если >= 0.5%.
Для каждого таймфрейма в таблице скринера отображается символ последнего (текущего) бара, в зависимости от цены закрытия относительно середины бара ((high + low) / 2) и расположения относительно линий индикатора Alligator: ⎾ — цена закрытия бара выше его середины; ⎿ — цена закрытия бара ниже его середины; ├ — цена закрытия бара равна его середине; 🟢 — Бычий Дивергентный бар, т.е. цена закрытия бара выше его середины, максимум бара ниже всех линий Alligator, минимум бара ниже минимума предыдущего бара; 🔴 — Медвежий Дивергентный бар, т.е. цена закрытия бара ниже его середины, минимум бара выше всех линий Alligator, максимум бара выше максимума предыдущего бара. При включении фильтрации в поле "TIMEFRAMES > Filtering by Divergent bar" данные в ячейках таблицы скринера будут отображаться только для тех таймфреймов, где есть Дивергентный бар. Также отображается сигнал высокого объема бара — 📶/📶², если объем бара больше чем на 40%/70% среднего значения объема, рассчитанного с помощью простой скользящей средней (SMA) в интервале 140 баров от последнего бара.
В настройках индикатора в поле "SYMBOL LIST" каждый тикер (например: OANDA:SPX500USD) должен быть на отдельной строке. Если рынок закрыт, то данные для запрашиваемых символов будут ограничены временем последнего (текущего) бара на графике, например, если текущий символ торговался последний день вчера, а запрашиваемый символ торгуется сегодня, при запросе данных для часового таймфрейма, последний бар будет за вчерашний день, если таймфрейм текущего графика не выше 1 дня. Поэтому по умолчанию на графике будет отображаться предупреждение вместо таблицы скринера о том, что если рынок открыт, то необходимо дождаться загрузки скринера (после первого изменения цены на текущем графике), или если в скринере самый высокий таймфрейм 1 день, то будет предложено изменить на текущем графике таймфрейм на 1 неделю, если в скринере запрашиваются данные для таймфрейма 1 неделя, то будет предложено изменить на текущем графике таймфрейм на 1 месяц, или же переключиться на другой символ на текущем графике, для которого рынок открыт (например: BINANCE:BTCUSDT), или отключить предупреждение в поле "SYMBOL LIST > Do not display screener if market is close".
Количество последних столбцов с цветом индикатора AO, которые будут отображены в таблице скринера для каждого таймфрейма, указывается в настройках индикатора в поле "AWESOME OSCILLATOR > Number of columns".
Для каждого таймфрейма отображается направление тренда между ценой самого высокого и самого низкого баров в указанном интервале баров от последнего бара — ↑, если тренд направлен вверх (самый высокий бар справа от самого низкого), или ↓, если тренд направлен вниз (самый низкий бар справа от самого высокого). Если есть дивергенция на индикаторе AO в указанном интервале, то также отображается символ — ∇. В указанном интервале также рассчитывается среднее значение объема с помощью простой скользящей средней (SMA). Количество баров устанавливается в настройках индикатора в поле "INTERVAL FOR HIGHEST AND LOWEST BARS > Bars count".
В настройках индикатора в поле "STYLE" можно изменить положение таблицы скринера относительно окна графика, цвет фона, цвет и размер текста.
