RSI Confirm Trend with Williams (W%R)RSI Confirm Trend with Williams (W%R)
This is the "RSI Confirm Trend with Williams (W%R)" indicator
This is a modification of the "RSI Trends" indicator by zzzcrypto123.
What Is the Relative Strength Index (RSI)?
The relative strength index (RSI) is a momentum indicator used in technical analysis. RSI measures the speed and magnitude of a security's recent price changes to evaluate overvalued or undervalued conditions in the price of that security.
What is Williams %R?
Williams %R, also known as the Williams Percent Range, is a type of momentum indicator that moves between 0 and -100 and measures overbought and oversold levels. The Williams %R may be used to find entry and exit points in the market. The indicator is very similar to the Stochastic oscillator and is used in the same way. It was developed by Larry Williams and it compares a stock’s closing price to the high-low range over a specific period, typically 14 days or periods.
How Does "RSI Confirm Trend with Williams (W%R)" work?
This indicator combines the momentum of both RSI and Williams %R by adding upper and lower thresholds. When the thresholds are broken, this indicator changes color from gray to either green or red.
What Are The Thresholds?
The default RSI thresholds are 55 and 45. These values are configurable.
The default Williams %R thresholds are 80 and 20. These values are configurable and made positive so it can be plotted against the RSI line.
How To Use?
When the RSI exceeded the upper/lower thresholds, the RSI line color will change from gray to lighter green/red color.
When the Williams %R exceeded the upper/lower thresholds, the RSI color will change to darker green/red color signifying a strong momentum in that direction.
When the RSI color is gray, this means the RSI and Williams %R thresholds are not broken which can also signify as no trend or consolidation.
The Williams %R line is not displayed by default but can be enabled using the checkbox provided in the Style tab.
This "RSI Confirm Trend with Williams (W%R)" indicator can be combined with other technical indicators to verify the idea behind this theory.
-----------------
Disclaimer
The information contained in this indicator does not constitute any financial advice or a solicitation to buy or sell any securities of any type.
My scripts/indicators/ideas are for educational purposes only!
Cari dalam skrip untuk "williams"

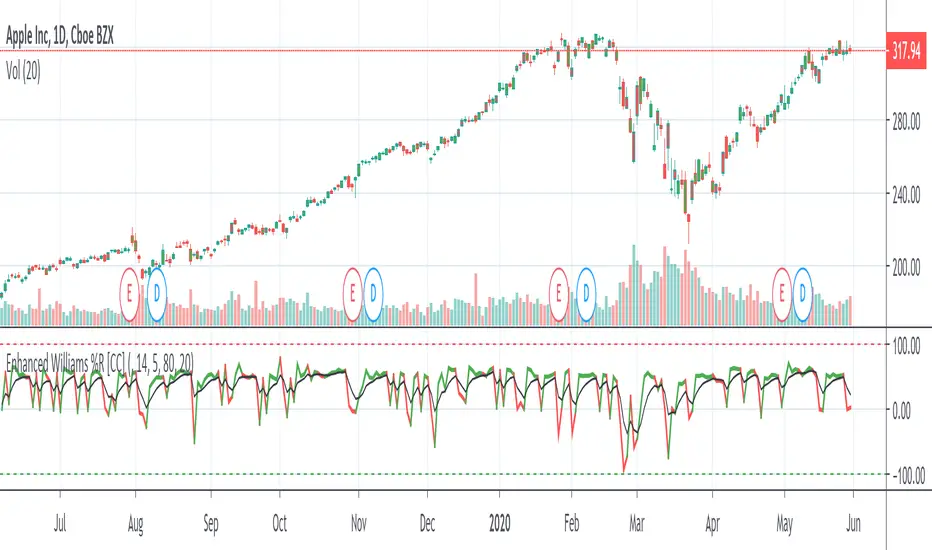
Enhanced Williams %RThe Enhanced Williams %R Indicator was created by Robert J Kinder Jr (Stocks & Commodities V5:5 (180-182)) and is based on the Williams %R Indicator. It takes volume into account and the buy and sell signals are pretty much the same. I would recommend to buy when the indicator is over the signal and if you want a confirmation then also make sure the signal is above 0. Sell if it falls below the signal or if the signal goes below 0 or of course buy or sell when the indicator goes into overbought or oversold territory.
I'm still tinkering with this indicator and it is the first time I have seen this indicator script published so let me know if you have any suggestions for me.
And of course let me know if you would like me to write indicators for you or anything else you would like to see!
Intermediate Williams %R w/ Discontinued Signal Lines [Loxx]Intermediate Williams %R w/ Discontinued Signal Lines is a Williams %R indicator with advanced options:
-Williams %R smoothing, 30+ smoothing algos found here:
-Williams %R signal, 30+ smoothing algos found here:
-DSL lines with smoothing or fixed overbought/oversold boundaries, smoothing algos are EMA and FEMA
-33 Expanded Source Type inputs including Heiken-Ashi and Heiken-Ashi Better, found here:
What is Williams %R?
Williams %R, also known as the Williams Percent Range, is a type of momentum indicator that moves between 0 and -100 and measures overbought and oversold levels. The Williams %R may be used to find entry and exit points in the market. The indicator is very similar to the Stochastic oscillator and is used in the same way. It was developed by Larry Williams and it compares a stock’s closing price to the high-low range over a specific period, typically 14 days or periods.
Included:
-Toggle on/off bar coloring
-Toggle on/off signal line

Bill Williams. Alligator, Fractals & Res/Sup combined (by vlkvr)Bill Williams indicators (each separately) are simple and quite self-sufficient, however, are most often used together. The key ones (Alligator and Fractals) are freely available and everyone can use them, but why use them on the chart separately, when "together more fun", and not conceivable, in my opinion, they are one without the other.
So, I present "split/copypasta" of two key indicators of Bill Williams, plus (as a bonus) visualization of "Support/Resistance" levels (and in fact, lines from extremes or the same fractals).
As a result, before you indicator "three-in-one".

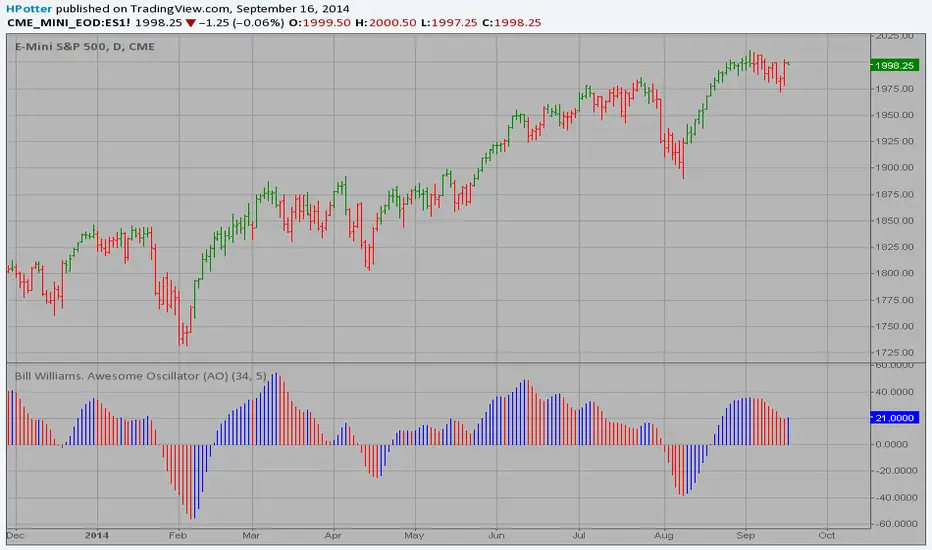
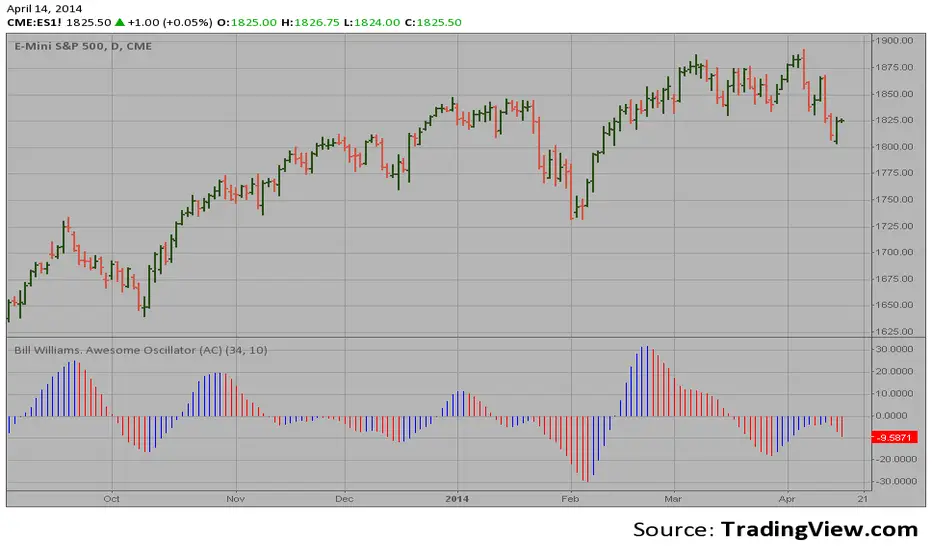
Strategy Bill Williams. Awesome Oscillator (AO) This indicator is based on Bill Williams` recommendations from his book
"New Trading Dimensions". We recommend this book to you as most useful reading.
The wisdom, technical expertise, and skillful teaching style of Williams make
it a truly revolutionary-level source. A must-have new book for stock and
commodity traders.
The 1st 2 chapters are somewhat of ramble where the author describes the
"metaphysics" of trading. Still some good ideas are offered. The book references
chaos theory, and leaves it up to the reader to believe whether "supercomputers"
were used in formulating the various trading methods (the author wants to come across
as an applied mathemetician, but he sure looks like a stock trader). There isn't any
obvious connection with Chaos Theory - despite of the weak link between the title and
content, the trading methodologies do work. Most readers think the author's systems to
be a perfect filter and trigger for a short term trading system. He states a goal of
10%/month, but when these filters & axioms are correctly combined with a good momentum
system, much more is a probable result.
There's better written & more informative books out there for less money, but this author
does have the "Holy Grail" of stock trading. A set of filters, axioms, and methods which are
the "missing link" for any trading system which is based upon conventional indicators.
This indicator plots the oscillator as a histogram where periods fit for buying are marked
as blue, and periods fit for selling as red. If the current value of AC (Awesome Oscillator)
is over the previous, the period is deemed fit for buying and the indicator is marked blue.
If the AC values is not over the previous, the period is deemed fir for selling and the indicator
is marked red.
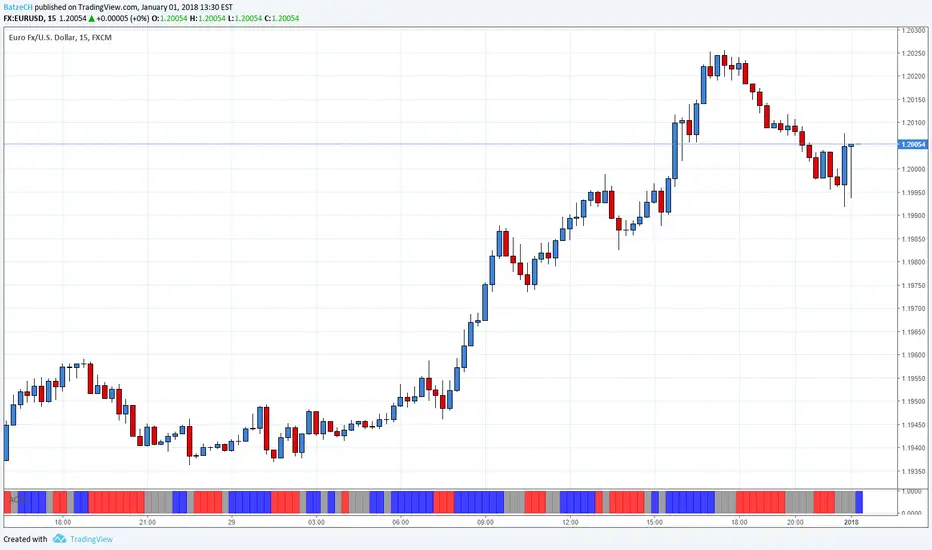
AO and AC Zones (Bill Williams)The colored Zones is the combination of the Awesome Oscillator (AO) and Accelerator Oscillator (AC) indicator by Bill Williams.
If both AO and AC bars are uptrending, the zone is blue
If both AO and AC bars are downtrending, the zone is red
If AO and AC have different colors, the zone is gray
Blue and red zones
This zones allows you to trade more aggressively, you could also add to current positions
Gray zone
You should avoid those flat (or choppy) market and don't open new positions or add to your current ones
You could use this indicator also in combination with MACD.
Please always remember, there is no holy grail indicator!
Larry Williams COT Analysis Enhanced [tradeviZion]Larry Williams COT Analysis Enhanced - Complete Description
📖 Introduction
Welcome to the Larry Williams COT Analysis Enhanced indicator. This comprehensive description explains every setting, feature, and capability of this advanced Commitments of Traders (COT) analysis tool.
This indicator implements Larry Williams' professional COT analysis methodology with enhanced features including statistical validation, combination analysis, and adaptive signal generation.
---
🎯 Quick Start
Add the indicator to your chart
The script will automatically detect your symbol's CFTC code and asset type
Review the main COT analysis table (displayed by default)
Customize settings based on your trading style
Review the Trading Edge & Signals section for signal information
---
⚙️ Settings Groups Overview
The indicator is organized into 9 logical groups of settings:
1. Core COT Settings - Data source and report configuration
2. Analysis Parameters - Calculation methods and lookback periods
3. Signal Generation - Buy/sell signals and trend weighting
4. Plot Display Settings - Visual customization of chart lines
5. Smoothing Settings - Data smoothing options
6. COT Proximity Index Settings - Price-based proxy indicator configuration
7. Common Table Settings - Shared table appearance
8. Main Table Display Settings - Main analysis table customization
9. Historical Comparison Settings - Historical data table configuration
---
📋 Group 1: Core COT Settings
COT Report Type
Options: Legacy | Disaggregated | Financial
What it is: Selects the type of COT report data to analyze.
Legacy - Traditional COT report format. Recommended for most users. Uses "Commercial Positions" and "Noncommercial Positions" metrics. Shows Commercial, Non-Commercial, and Small Speculator positions in the classic format.
Commercials: "Commercial Positions"
Speculators: "Noncommercial Positions"
Small Specs: "Nonreportable Positions"
Disaggregated - Separates managed money from other speculators. Uses different metrics than Legacy format.
Commercials: "Producer Merchant Positions"
Speculators: "Managed Money Positions"
Small Specs: "Nonreportable Positions"
Important: When using Disaggregated report type, the table will still show "Non-Comm" as the label, but the data displayed is actually " Managed Money Positions " (hedge funds and CTAs). The underlying data changes based on your report type selection, even though the table label remains "Non-Comm" for consistency.
Where you'll see this data:
📊 Current Positions section - The "Non-Comm" row shows Managed Money long, short, and net positions
📊 Open Interest Analysis section - "Non-Comm" net changes reflect Managed Money position changes
📈 Analysis section - "Non-Comm" percentile and LW Index values are calculated from Managed Money positions
Chart plots - The blue "Non-Commercial" line shows Managed Money net positions
Useful when you want to analyze hedge funds (Managed Money) separately from other large speculators. The "Commercial" row will show " Producer Merchant Positions " instead of general "Commercial Positions".
Financial - Designed for financial instruments (currencies, bonds, stock indices). Uses financial-specific metrics.
Commercials: "Dealer Positions"
Speculators: "Leveraged Funds Positions"
Small Specs: "Nonreportable Positions"
Important: When using Financial report type, the table will still show "Commercial" and "Non-Comm" as labels, but the data displayed is actually " Dealer Positions " (commercials) and " Leveraged Funds Positions " (speculators). The underlying data changes based on your report type selection.
Where you'll see this data:
📊 Current Positions section - "Commercial" row shows Dealer long/short/net, "Non-Comm" row shows Leveraged Funds positions
📊 Open Interest Analysis section - Net changes reflect Dealer and Leveraged Funds position changes
📈 Analysis section - Percentile and LW Index values are calculated from Dealer and Leveraged Funds positions
Chart plots - Lines show Dealer and Leveraged Funds net positions
Use this for currency futures, bond futures, and stock index futures.
Trading Use: Most traders use Legacy as it provides the most comprehensive view and works with all asset types. Switch to Disaggregated if you want to analyze managed money positions separately. Use Financial specifically for financial instruments (currencies, bonds, stock indices).
---
Include Options Data
Default: Off (false)
What it is: Toggles whether to include options positions in addition to futures positions.
Trading Use: Larry Williams observed no significant difference in COT analysis when including options data. Keep this disabled unless you specifically need options data. Most traders leave it off for cleaner analysis.
---
Auto-detect CFTC Code
Default: On (true)
What it is: Automatically finds the correct CFTC code for your symbol.
Trading Use: Keep this enabled unless you need a specific CFTC code. The script automatically detects codes for:
- Currency futures: CME:6E1! , CME:6B1! , CME:6J1!
- Stock index futures: CME_MINI:ES1! , CBOT_MINI:YM1! , CME_MINI:NQ1!
- Commodities: NYMEX:CL1! , COMEX:GC1! , CBOT:ZC1!
- And many more
Only disable if you're analyzing a symbol that requires a specific CFTC code not in the auto-detection database.
---
Manual CFTC Code
Default: Empty
What it is: Enter a specific CFTC code manually (e.g. for E-mini S&P 500). "13874+"
Trading Use: Only used when Auto-detect CFTC Code is disabled. Most users never need this setting.
---
📊 Group 2: Analysis Parameters
Display Mode
Options: COT Report | COT Index | COT Proximity Index
What it is: Controls what data is displayed on the chart and in the table.
COT Report - Shows raw position data (Long, Short, Net positions) plus analysis. Best for detailed analysis. Displays Commercial, Non-Commercial, Small Speculator, and Open Interest lines.
COT Index - Shows index values based on your selected Analysis Method (Percentile or LW Index). Best for quick sentiment analysis. Displays index lines for Commercial, Non-Commercial, Small Speculator, and Open Interest. Percentile can exceed 0-100% for extremes, LW Index stays 0-100%.
Percentile can exceed 0-100% for extremes
LW Index stays 0-100%
COT Proximity Index - Shows a price-based proxy indicator. Useful when COT data is delayed or unavailable. Calculates sentiment based on price action patterns.
Trading Use:
- Use COT Report for comprehensive analysis
- Use COT Index when you want to focus on extreme sentiment levels
- Use COT Proximity Index as a backup when COT data is delayed or unavailable.
---
Analysis Method
Options: Percentile | LW Index
What it is: Selects the calculation method for position rankings.
Percentile - Professional approach. Excludes current bar from range calculation. Can show extremes (>100% or <0%) when today's value breaks historical range. More sensitive to recent extremes.
LW Index - Original Larry Williams method. Includes current bar in range, always 0-100%. Traditional approach.
Trading Use:
Percentile - Better for catching new extremes and recent market shifts
LW Index - Better for traditional Larry Williams analysis
Most traders prefer Percentile for its ability to show when positions break historical ranges.
---
Lookback Mode
Options: Auto | Manual
What it is: Controls how the historical lookback period is determined.
Auto - Automatically sets lookback period based on detected asset type
Manual - Choose your own lookback period
Trading Use: Use Auto unless you have a specific reason to customize. The script automatically sets optimal periods:
Currencies: 26 weeks
Metals: 13 weeks
Grains: 26 weeks
Stocks/Indices: 13 weeks
Bonds: 52 weeks
Energies: 13 weeks
---
Manual Lookback Period
Options: 1 Month | 3 Months | 6 Months | 1 Year | 3 Years | Asset-specific presets | Manual
What it is: How far back to look for historical comparison. Only used when Lookback Mode is set to Manual .
---
Manual Lookback Weeks
Default: 18 weeks | Range: 1-500
What it is: Exact number of weeks to look back. Only used when Manual Lookback Period is set to Manual .
Trading Use: Set a custom period if you want precise control. 18 weeks = approximately one quarter (3 months).
---
🎯 Group 3: Signal Generation
Show Signal Arrows
Default: Off (false)
What it is: Displays buy/sell arrows on the chart when extreme positions are detected.
Trading Use: Enable to get visual alerts for signals. Signals use strict multi-factor conditions requiring:
- Commercial extreme positioning
- Speculator positioning alignment
- Open Interest confirmation
- Trend consistency
- And more...
---
Show Background Colors
Default: Off (false)
What it is: Colors the chart background during extreme market conditions.
Trading Use: Enable for visual market state awareness:
- Strong signals = Darker background colors
- Moderate signals = Lighter background colors
- Green background = Bullish extreme
- Red background = Bearish extreme
Useful for quick visual assessment of market conditions.
---
Use Price Trend Weighting
Default: On (true)
What it is: Weights signals based on price trend alignment.
How it works:
Uptrend + Commercials long = Stronger bullish signal
Downtrend + Commercials short = Stronger bearish signal
Counter-trend signals = Harder to trigger (more conservative)
Trading Use: Keep enabled for more reliable signals. Commercials aligned with price trend are historically more accurate.
This feature makes signals easier to trigger when commercials align with the trend and harder when they're counter-trend.
---
Trend MA Period
Default: 40 | Range: 1-200
What it is: Moving average period for price trend detection.
How it works:
Price above MA with the MA rising = Uptrend
Price below MA with the MA declining = Downtrend
---
📈 Group 4: Plot Display Settings
Commercial Line Settings
Default Color: Red | Default Width: 2
What it is: Controls the Commercial traders net position line appearance.
Trading Use: Commercials are considered "smart money." Watch for:
Extreme long positions (high index ≥74%) = Heavy buyers = BULLISH signal
Extreme short positions (low index ≤26%) = Heavy sellers = BEARISH signal
Red is traditional for commercials. When Commercials are heavy buyers (high index), it's a bullish signal. When they're heavy sellers (low index), it's a bearish signal.
---
Non-Commercial Line Settings
Default Color: Blue | Default Width: 2
What it is: Controls the Non-Commercial (Large Speculators) net position line appearance.
Trading Use: Large speculators are often trend-followers. Watch for:
Extreme long = Potential top (contrarian sell signal)
Extreme short = Potential bottom (contrarian buy signal)
They're often wrong at extremes - use as contrarian indicator.
---
Small Speculator Line Settings
Default Color: Green | Default Width: 2
What it is: Controls the Small Speculators net position line appearance.
Trading Use: Small specs are typically wrong at extremes:
Extreme long = Potential top (sell signal)
Extreme short = Potential bottom (buy signal)
Exception: In Meats markets, small specs are accurate (like commercials).
---
Small Speculator Multiplier
Default: 5.0x | Range: 0.1-20.0
What it is: Multiplies Small Speculator PLOTTED values for visual comparison.
Important: This only affects the visual plot line, NOT calculations or table values. Raw values used in all calculations remain unchanged.
Trading Use: Small spec positions are often much smaller than commercials. Use multiplier (default 5.0x) to scale the line for easier visual comparison.
---
Open Interest Line Settings
Default Color: Black | Default Width: 1
What it is: Controls the Open Interest line appearance.
Trading Use: Open Interest shows market participation:
Rising OI = New money entering (confirms trend)
Falling OI = Money leaving (potential reversal)
Watch WHO is driving OI changes - This is critical
---
Scale Open Interest
Default: On (true)
What it is: Scales Open Interest values to fit chart range.
Important: Only affects plotted lines, not table values. Scaling changes based on lookback period:
- Shorter lookback = More compressed range
- Longer lookback = Wider range
Trading Use: Keep enabled for better visual comparison. Disable if you want absolute OI values.
---
Show Reference Lines
Default: Off (false)
What it is: Toggles the display of horizontal reference lines at 0%, 50%, and 100% levels on the chart.
What it shows:
Zero Line (0%) - Dotted gray line at 0% level
Midline (50%) - Solid gray line at 50% level
100 Line (100%) - Dotted gray line at 100% level
Trading Use: Enable when you want visual reference points for:
0% = Extreme bearish positioning
50% = Neutral/middle range
100% = Extreme bullish positioning
---
🔄 Group 5: Smoothing Settings
Smoothing Method
Options: None | SMA | EMA | WMA | RMA
What it is: Selects the moving average type for smoothing data.
None - Use raw data (no smoothing)
SMA - Simple Moving Average (equal weight to all periods)
EMA - Exponential Moving Average (more weight to recent data)
WMA - Weighted Moving Average (linear weighting)
RMA - Relative Moving Average (Wilder's smoothing)
Trading Use:
None - Best for catching extremes quickly
SMA - Most common, balanced smoothing
EMA - More responsive to recent changes
WMA/RMA - Advanced smoothing methods
Smoothing reduces noise but may delay signal detection. Use None for most responsive signals.
---
Smoothing Period
Default: 4 | Range: 2-20
What it is: Number of periods for the moving average smoothing.
Trading Use:
Shorter periods (2-5) = Less smoothing, more responsive
Longer periods (10-20) = More smoothing, less noise
Default 4 = Good balance
Only used when Smoothing Method is not None.
---
Smooth COT Report Plots
Default: Off (false)
What it is: Applies smoothing to COT Report plotted lines (Commercial, Non-Commercial, Small Speculators, Open Interest).
Trading Use: Enable if you want smoother chart lines. Note: Smoothing affects visual display but calculations use raw data unless Smooth COT Index Plots is also enabled.
---
Smooth COT Index Plots
Default: Off (false)
What it is: Applies smoothing to COT Index plotted lines.
Trading Use: Enable if you want smoother index lines. Important : When enabled, smoothed values are used in table displays and signal calculations. This affects the "user-facing" index values shown in the table and used for signals.
---
📊 Group 6: COT Proximity Index Settings
Proximity Length Mode
Options: Auto | Manual
What it is: Controls how the proximity index calculation period is determined.
Auto - Calculates length based on ZigZag patterns (dynamic)
Manual - Uses fixed length setting
Trading Use: Use Auto for adaptive calculation. Use Manual if you want consistent period regardless of market conditions.
---
Manual Proximity Length
Default: 8 bars | Range: 1+
What it is: Fixed number of bars for COT Proximity Index calculation. Only used when Proximity Length Mode is Manual .
Trading Use: Set based on your timeframe. 8 bars works well for weekly chart.
---
Heavy Buyers Level
Default: 74% | Range: 50-100
What it is: COT Index level above which commercials are considered heavy buyers (extreme long positioning).
Trading Use: This threshold is used for:
- Signal generation
- Market state calculation
- Entry level recommendations
Default 74% means commercials are "heavy buyers" when LW Index ≥ 74%.
---
Heavy Sellers Level
Default: 26% | Range: 0-50
What it is: COT Index level below which commercials are considered heavy sellers (extreme short positioning).
Trading Use: This threshold is used for:
- Signal generation
- Market state calculation
- Entry level recommendations
Default 26% means commercials are "heavy sellers" when LW Index ≤ 26%.
---
ZigZag Deviation
Default: 1.0% | Range: 1-100.0
What it is: Minimum price change (%) required to create a new ZigZag pivot point.
Trading Use:
Smaller values = More sensitive, more pivots
Larger values = Less sensitive, fewer pivots
Used for Auto proximity length calculation.
---
ZigZag Depth
Default: 1 | Range: 1+
What it is: Minimum number of bars between pivot points.
Trading Use: Higher values filter out minor pivots. Default 1 captures all significant pivots.
---
Extend ZigZag to Last Bar
Default: Off (false)
What it is: Draws ZigZag lines to the current bar (may show incomplete patterns).
Trading Use: Enable to see current ZigZag pattern, but be aware it may change as new bars form.
---
Show ZigZag Lines
Default: Off (false)
What it is: Displays ZigZag pivot lines on the chart for visual reference.
Trading Use: Enable to see the ZigZag pattern used for proximity index calculation. Useful for understanding how Auto mode works.
---
🎨 Group 7: Common Table Settings
Color Theme
Options: Dark | Light | Midnight Blue | Ocean Blue | Forest Green | Amber Gold | Slate Gray
What it is: Color scheme for both main and historical comparison tables.
Trading Use: Choose based on your preference:
Dark/Light - Classic themes
Midnight Blue - Professional dark theme
Ocean Blue - Calming blue tones
Forest Green - Natural green theme
Amber Gold - Warm gold tones
Slate Gray - Modern gray theme
Theme applies to both tables simultaneously for consistency.
---
📋 Group 8: Main Table Display Settings
Show COT Table
Default: On (true)
What it is: Toggles the main COT analysis table display.
Trading Use: Disable only if you want to use chart plots only. Most traders keep this enabled for comprehensive analysis.
---
Table Mode
Options: Full | Compact
What it is: Controls the detail level of the main table.
Full - Complete analysis table with all sections
Compact - Essential info only (mobile-friendly)
Trading Use:
Full - Desktop trading, comprehensive analysis
Compact - Mobile trading, quick reference
See "Table Modes Explained" section below for details.
---
Table Position
Options: Top Right | Top Left | Bottom Right | Bottom Left | Middle Right | Middle Left
What it is: Position of the main COT analysis table on the chart.
Trading Use: Choose based on your chart layout and preference. Top Right is default and works well for most traders.
---
Table Text Size
Options: Tiny | Small | Normal | Large
What it is: Size of text in the COT analysis table.
---
Section Visibility Controls
All default: On (true)
What it is: Individual toggles to show/hide specific table sections.
⚙️ Settings - Report Type, CFTC Code, Options setting
📊 Current Positions - Long, Short, Net positions for each group
📈 Analysis - LW Index, Percentile, Market State
🎯 Trading Edge & Signals - Current Signal, Entry Level, Best Setup
💡 Trading Tips - Context-aware trading insights
📈 Trend Analysis - Trend Direction, Strength, Cum Change, ROC, vs MA
🔄 Market Maker Activity - Spreading, Activity Level, Trading Edge
Trading Use: Customize your table to show only what you need:
Quick traders - Show only Trading Edge & Signals
Detailed analysis - Show all sections
Mobile users - Hide less critical sections
Each section can be toggled independently for maximum customization.
---
📊 Group 9: Historical Comparison Settings
Show Historical Comparisons
Default: On (true)
What it is: Toggles the historical comparison table display.
Trading Use: This table shows how current positions rank over different time periods (1M, 3M, 6M, 1Y, 3Y, All Time). Very useful for context.
---
Historical Table Mode
Options: Full | Compact
What it is: Controls the detail level of the historical comparison table.
Full - Complete historical comparison with all time periods (1M, 3M, 6M, 1Y, 3Y, All Time) and all COT groups
Compact - Essential periods only (1M, 3M, 6M, 1Y, All Time) showing Commercial % only
Trading Use:
- Full - Comprehensive historical analysis
- Compact - Quick reference, mobile-friendly
---
Table Position (Historical)
Options: Top Right | Top Left | Bottom Right | Bottom Left
What it is: Position of the historical comparison table on the chart.
---
Table Text Size (Historical)
Options: Tiny | Small | Normal | Large
What it is: Size of text in the historical comparison table.
---
Trading Days
Options: Weekdays | 24/7
What it is: How to calculate time periods for historical comparisons.
Weekdays - Calculate based on trading days only (5 days/week)
24/7 - Include all calendar days (7 days/week), Use for 24/7 markets like cryptocurrencies
Used for both main COT data and COT Proximity Index historical comparisons.
---
📊 Table Modes Explained
Full Mode - Main Table
The Full mode displays all available sections:
⚙️ Settings - Report type, CFTC code, options setting
📊 Current Positions - Long, Short, Net for Commercial, Non-Commercial, Small Speculators
📊 Open Interest Analysis - OI value, change, who's driving changes, concentration
📈 Analysis - Percentile ranks, LW Index values, Market State
🎯 Trading Edge & Signals - Current Signal, Entry Level, What to Watch, Best Setup
💡 Trading Tips - Context-aware insights
📈 Trend Analysis - Trend Direction, Strength, Consistency, Cumulative Change, ROC %, vs MA
🔄 Market Maker Activity - Spreading %, Activity Level, Interpretation, Trading Edge
Best for: Desktop trading, comprehensive analysis, detailed market assessment
---
📋 Understanding Each Table Section
This section explains what each part of the main table means and how to use it for trading decisions.
⚙️ Settings Section
Report Type - Shows which COT report format you're using (Legacy, Disaggregated, or Financial). Verify this matches your asset type.
Options - Indicates if options data is included ("Included") or excluded ("Excluded"). Most traders exclude options for cleaner analysis.
CFTC Code - Unique identifier for your futures contract. Shows "Auto" when automatically detected, or displays the manual code if set.
Trading Use: Always verify your CFTC code is correct. Wrong code = wrong data = wrong signals.
---
📊 Current Positions Section
Shows the actual position sizes for each trader group.
What Each Column Means:
Long - Total long contracts held by this group
Short - Total short contracts held by this group
Net - Net position (Long - Short). This is the key number.
How to Interpret:
Commercial Net Position:
- Negative (Net Short) = Commercials expect prices to fall
- Positive (Net Long) = Commercials expect prices to rise
- Commercials are "smart money" - their positioning often precedes major moves
Non-Commercial Net Position:
- Positive (Net Long) = Large speculators bullish
- Negative (Net Short) = Large speculators bearish
- Often trend-followers, can be caught at extremes
Small Spec Net Position:
- Positive (Net Long) = Small traders bullish
- Negative (Net Short) = Small traders bearish
- Often contrarian indicator - wrong at extremes
Trading Edge: Watch for extremes in Commercial net positions. When Commercials are heavy buyers (high index ≥74%), it's a bullish signal. When they're heavy sellers (low index ≤26%), it's a bearish signal.
---
📊 Open Interest Analysis Section
Open Interest - Total number of outstanding contracts. Shows market participation level.
Change - Week-over-week change in Open Interest. Rising OI = new money entering, Falling OI = money leaving.
Net Changes - Shows which group is driving Open Interest changes. This is Larry Williams' most important insight.
🎯 Critical Question: Who is Driving OI Changes?
EXTREMELY BULLISH SIGNAL (Very Rare - Pay Close Attention):
- Commercials driving OI increase + Commercials raising positions + Uptrend market
- Meaning: Smart money (commercials) accumulating long positions while market is rising
- Action: Extremely bullish - very rare setup, pay close attention to this signal
- This is the strongest bullish signal possible
BULLISH SIGNAL (Strong Buy):
- Commercials driving OI increase + Commercials net long
- Meaning: Smart money accumulating long positions
- Action: Strong bullish setup
BEARISH SIGNAL (Strong Sell - Market Topping):
- Commercials exiting + OI increasing due to Small Specs + Non-Commercials
- Meaning: Smart money leaving while speculative money entering
- Action: Market top forming - most likely scenario for bearish reversal
- This indicates speculative excess and potential market top
BEARISH SIGNAL (Speculative Excess):
- Small Specs + Non-Commercials driving OI increase + They are net long
- Meaning: Speculative excess, "dumb money" driving market
- Action: Bearish reversal likely
Trading Use:
- Rising OI = New money entering (confirms trend)
- Falling OI = Money leaving (potential reversal)
- Watch WHO is driving OI changes - This is critical
- When Commercials drive OI increases while raising positions in an uptrend = Extremely bullish and very rare - pay attention
- When Commercials exit while OI increases due to Small Specs and Non-Commercials = Market topping signal
Concentration - Shows how much of the market is controlled by the largest traders:
- Top 4 - Four largest traders' share of total OI
- Top 8 - Eight largest traders' share of total OI
Trading Use: High concentration (>30%) means fewer dominant players, potential for volatility. Low concentration means more distributed positions, healthier market.
---
📈 Analysis Section
Proximity Index (when in COT Proximity Index mode):
- Value: Current proximity index reading (0-100%)
- Length: Number of bars used in calculation
- Status: Heavy Buyers, Heavy Sellers, or Neutral
Analysis Method - Shows whether you're using Percentile or LW Index calculation.
Small Spec Mode - Shows how Small Speculators are interpreted:
- Contrarian (Traditional) - Small specs are wrong at extremes (default)
- Accurate (Meats) - Small specs are accurate like commercials (for Meats markets)
Market State - Overall market sentiment assessment:
- STRONG BULLISH - Multiple factors aligned bullish, strong buy signal
- MODERATE BULLISH - Several bullish factors, moderate buy signal
- LEANING BULLISH - Slight bullish bias, watch for confirmation
- NEUTRAL - Mixed signals, trade with existing trend
- LEANING BEARISH - Slight bearish bias, watch for confirmation
- MODERATE BEARISH - Several bearish factors, moderate sell signal
- STRONG BEARISH - Multiple factors aligned bearish, strong sell signal
Trading Use: Start your analysis here. Market State gives you the overall picture before diving into details.
---
🎯 Trading Edge & Signals Section
Current Signal - Shows which combination is active based on current positioning extremes and its expected accuracy percentage:
- Comm+Spec+OI - All three groups at extremes (highest accuracy)
- Comm+Spec - Commercials and specs at extremes (opposite extremes - Larry Williams' favorite)
- Comm+OI - Commercials and Open Interest at extremes (smart money + participation)
- Commercials - Only Commercials at extreme (smart money indicator)
- Wait - No extremes detected, wait for setup
Entry - Trading signal based on Commercial positioning:
- LONG - Commercials are heavy buyers (≥Heavy Buyers Level), bullish signal
- SHORT - Commercials are heavy sellers (≤Heavy Sellers Level), bearish signal
- Wait - Commercials neutral, no clear signal
Best Setup - Shows the historically highest accuracy combination found in the data:
- Comm+Spec+SmallSpec+OI - All four groups aligned (strongest signal)
- Comm+Spec+OI (All) - Commercials + Speculators + Open Interest aligned
- Comm+Spec+SmallSpec - Commercials + Speculators + Small Specs aligned
- Comm+Spec (Both) - Commercials + Speculators (opposite extremes - Larry Williams' favorite)
- Comm+OI (Both) - Commercials + Open Interest (participation confirms smart money)
- Comm+SmallSpec - Commercials + Small Specs (especially strong in Meats markets)
- Commercials Alone - Commercial positioning only (baseline - smart money indicator)
Trading Use: This is your action center . Focus on Entry signals when Market State confirms. Higher accuracy setups (shown in Best Setup) are more reliable.
---
💡 Trading Tips Section
Context-aware insights based on current market conditions.
What You'll See:
Commercial positioning assessment (extreme long/short, favorable/unfavorable)
Speculator positioning (contrarian support or warning)
Open Interest guidance (who's driving changes)
Trend assessment (aligning or conflicting)
Information about entry timing, position sizing, and confirmation needs
Trading Use: Review these tips when analyzing. They provide context-specific information tailored to current conditions.
---
📈 Trend Analysis Section
Trend Direction - Overall price trend:
- Bullish - Price trending up
- Bearish - Price trending down
- Mixed - No clear direction
Consistency - How stable the trend is:
- Consistent - Trend is stable and maintaining direction
- Mixed - Trend is unstable, direction changing
- Accelerating - Trend is gaining momentum
Strength - Trend intensity:
- Strong - Powerful trend
- Steady - Moderate trend
- Weak - Weak trend
This Week - Net position change this week (percentage).
Cumulative Change - Total net position change over different periods:
- 4W - 4-week cumulative change
- 13W - 13-week cumulative change (one quarter)
- 26W - 26-week cumulative change (half year)
ROC % - Rate of Change percentage over different periods. Shows momentum.
vs MA - Current net position compared to moving average:
- Positive = Above average (strong positioning)
- Negative = Below average (weak positioning)
Trading Use: Align COT signals with trend direction for higher accuracy. When COT signals align with price trend, signals are more reliable. Counter-trend signals require more confirmation.
---
🔄 Market Maker Activity Section
Total Spreading - Percentage of open interest in spread positions (simultaneous long and short in different months).
Percentile - Where current spreading level ranks historically. High percentile = unusual spreading activity.
13W Trend - 13-week trend in spreading activity (+ = increasing, - = decreasing).
Activity Level - Market maker activity intensity:
- High - Very active, expect volatility
- Moderate - Normal activity
- Low - Quiet, less volatility expected
vs 13W Avg - Current activity compared to 13-week average.
Trading Edge - Interpretation of market maker activity:
- High & Rising - Expect volatility, market makers hedging risk
- High & Stable - Active hedging, monitor for changes
- Low & Falling - Reduced activity, potential for directional moves
Trading Use: High market maker activity often precedes volatility. Use this to adjust position sizing and risk management. When spreading is high and rising, expect choppy conditions.
---
📋 Understanding Compact Mode Fields
The Compact mode provides essential information for quick trading decisions. Here's what each field means:
State
Shows the overall market sentiment based on combined COT analysis.
Possible Values:
- STRONG BULLISH - Multiple factors aligned bullish, strong buy signal
- MODERATE BULLISH - Several bullish factors, moderate buy signal
- LEANING BULLISH - Slight bullish bias, watch for confirmation
- NEUTRAL - Mixed signals, trade with existing trend
- LEANING BEARISH - Slight bearish bias, watch for confirmation
- MODERATE BEARISH - Several bearish factors, moderate sell signal
- STRONG BEARISH - Multiple factors aligned bearish, strong sell signal
Trading Use: Start your analysis here. Strong signals (STRONG BULLISH/BEARISH) indicate higher confidence setups. Neutral means trade with price trend.
---
Entry
Your actionable trading signal based on Commercial positioning.
Possible Values:
- LONG - Commercials are heavy buyers (≥Heavy Buyers Level), bullish signal
- SHORT - Commercials are heavy sellers (≤Heavy Sellers Level), bearish signal
- Wait - Commercials neutral, no clear signal
Trading Use: This is your go/no-go decision point. Only take trades when Entry shows LONG or SHORT. When Entry = Wait, stay on sidelines until clearer signal develops.
---
Comm Index
Commercial LW Index percentage showing where Commercial net position ranks historically.
Range: 0% to 100%
- 0-26% = Commercials heavy sellers (bearish positioning)
- 27-73% = Commercials neutral (no extreme)
- 74-100% = Commercials heavy buyers (bullish positioning)
Trading Use: Commercial extremes are most reliable. Values ≥74% (heavy buyers/extreme long) = BULLISH signal. Values ≤26% (heavy sellers/extreme short) = BEARISH signal. When Commercials are heavy buyers, it indicates bullish sentiment. When they're heavy sellers, it indicates bearish sentiment.
---
OI Status
Open Interest condition showing market participation level and trend.
Format: Status (Percentile %)
Examples:
- High (100.0%) - OI at extreme high, strong participation
- Moderate (50.0%) - OI at average level
- Low (10.0%) - OI at extreme low, weak participation
Trend Indicators:
- Rising - OI increasing (new money entering)
- Falling - OI decreasing (money leaving)
- Stable - OI unchanged
Trading Use: High OI with rising trend = strong market participation, confirms directional moves. Falling OI = watch for potential reversals. Low OI = reduced participation, potential for volatility.
---
Best Setup
Shows which combination of factors has the highest historical accuracy.
Format: Combination Name (Accuracy %)
Examples:
- Commercials Alone (75.3%) - Commercial positioning only
- Commercials + Speculators (68.2%) - Commercials and specs aligned
- Commercials + Open Interest (72.1%) - Commercials with OI confirmation
- Commercials + Speculators + OI (82.1%) - All factors aligned (strongest)
Trading Use: Higher accuracy values indicate signals with higher historical accuracy. When Best Setup shows "Commercials + Speculators + OI" with high accuracy, it indicates a combination with strong historical performance.
---
Trend
13-week cumulative trend direction based on net position changes.
Possible Values:
- Bullish - Net positions trending bullish over 13 weeks
- Bearish - Net positions trending bearish over 13 weeks
- Mixed - No clear directional trend
Trading Use: Align Entry signals with Trend for higher accuracy. When Entry = LONG and Trend = Bullish, signal is stronger. When Entry = LONG but Trend = Bearish, wait for price confirmation before entering. Counter-trend signals require more confirmation.
---
Full Mode - Historical Table
The Full historical mode shows:
All time periods: 1 Month, 3 Months, 6 Months, 1 Year, 3 Years, All Time
All COT groups: Commercial, Non-Commercial, Small Speculators, Open Interest
Complete header with asset type and lookback information
Best for: Comprehensive historical analysis, understanding long-term positioning
---
Compact Mode - Historical Table
The Compact historical mode shows:
Essential periods only: 1M, 3M, 6M, 1Y, All Time
Commercial % only (most important indicator)
Simplified header
Best for: Quick reference, mobile-friendly, focused analysis
---
🎯 How to Use Each Feature for Trading
Using Display Modes
COT Report Mode - Use for:
Understanding raw position sizes
Analyzing net position changes
Comparing absolute positions across groups
Detailed market structure analysis
COT Index Mode - Use for:
Quick sentiment assessment
Identifying extremes (Percentile can show >100% or <0%, LW Index shows 0-100%)
Comparing relative positioning
Signal generation
COT Proximity Index Mode - Use for:
When COT data is delayed
Real-time sentiment estimation
Price-action based analysis
---
Using Analysis Methods
Percentile Method - Use when:
You want to catch new extremes (>100% or <0%)
You need responsive signals
You're analyzing recent market regime changes
You want to use the professional approach (excludes current bar from range)
LW Index Method - Use when:
You want traditional Larry Williams analysis
You prefer stable, conservative signals
You're doing long-term analysis
You want always 0-100% range
---
Using Signal Generation
Enable Signal Arrows when:
You want visual alerts for high-quality setups
You're scanning multiple charts
You want to catch extreme positioning
Enable Background Colors when:
You want quick visual market state assessment
You're monitoring multiple timeframes
You want to see market conditions at a glance
Use Price Trend Weighting to:
Increase signal reliability
Align COT signals with price action
Filter counter-trend signals
---
Using Smoothing
No Smoothing - Best for:
Catching extremes quickly
Responsive signal generation
Active trading
With Smoothing - Best for:
Reducing noise
Trend identification
Swing trading
Remember: Smoothing affects visual display. Enable "Smooth COT Index Plots" if you want smoothed values in calculations.
---
Using Heavy Buyers/Sellers Levels
Default 74%/26% - Good starting point
Tighter levels (80%/20%) - More conservative, fewer signals
Wider levels (70%/30%) - More signals, less extreme
Trading Use: Adjust based on your risk tolerance and signal frequency preference.
---
Using Table Sections
Settings - Verify your configuration
Current Positions - Understand current market structure
Analysis - Identify extremes and market state
Trading Edge & Signals - Most important - Entry signals based on Commercial positioning
Trading Tips - Context-aware insights
Trend Analysis - Understand momentum and direction
Market Maker Activity - Assess market maker positioning
---
💡 Key Trading Concepts
Market State Interpretation
STRONG BULLISH - Multiple factors aligned bullish. Strong buy signal.
MODERATE BULLISH - Several bullish factors. Moderate buy signal.
LEANING BULLISH - Slight bullish bias. Watch for confirmation.
NEUTRAL - Mixed signals. Trade with existing trend.
LEANING BEARISH - Slight bearish bias. Watch for confirmation.
MODERATE BEARISH - Several bearish factors. Moderate sell signal.
STRONG BEARISH - Multiple factors aligned bearish. Strong sell signal.
---
Entry Level Signals
LONG - Commercials are heavy buyers (≥Heavy Buyers Level). Bullish signal.
SHORT - Commercials are heavy sellers (≤Heavy Sellers Level). Bearish signal.
Wait - Commercials neutral. No clear signal.
When Commercials are heavy buyers (high index), it indicates bullish sentiment. When they're heavy sellers (low index), it indicates bearish sentiment.
---
Best Setup Interpretation
The Best Setup shows the historically highest accuracy combination:
Commercials Alone - Commercial positioning is most reliable
Commercials + Speculators - Both groups aligned
Commercials + Open Interest - Commercials + OI confirmation
Commercials + Speculators + OI - All factors aligned (strongest)
Higher accuracy = More reliable signal. Use this to prioritize which signals to follow.
---
Open Interest Analysis
Critical Question: Who is driving Open Interest changes?
EXTREMELY BULLISH (Very Rare):
Commercials driving OI increase + Commercials raising positions + Uptrend = EXTREMELY BULLISH
This is very rare - pay close attention when this occurs
STRONG BULLISH:
Commercials driving OI increase + Commercials long = STRONG BULLISH
BEARISH (Market Topping):
Commercials exiting + OI increasing due to Small Specs + Non-Commercials = BEARISH (market topping)
Most likely scenario for bearish reversal - speculative excess
BEARISH (Speculative Excess):
Speculators driving OI increase + Speculators long = BEARISH (speculative excess)
TREND CONFIRMATION:
Rising OI = Confirms trend (new money entering)
Falling OI = Potential reversal (money leaving)
This is one of Larry Williams' most important insights. When Commercials drive OI increases while raising positions in an uptrend, it's extremely bullish and very rare - pay attention. When Commercials exit while Small Specs and Non-Commercials drive OI increases, the market is likely topping.
---
🚀 Practical Trading Workflow
Daily Analysis Routine
Check Market State - Overall assessment
Review Entry Level - Actionable signal
Check Best Setup - Signal reliability
Review Trading Tips - Context-aware insights
Analyze Trend Analysis - Momentum confirmation
Check Historical Comparison - Context over time
Verify Open Interest - Who's driving changes
---
Signal Confirmation Checklist
Before taking a trade based on COT signals:
✓ Market State shows clear bias (not Neutral)
✓ Entry Level matches Market State
✓ Best Setup shows high accuracy (>60%)
✓ Price trend aligns with signal (if using trend weighting)
✓ Open Interest confirms (rising for trend continuation, falling for reversal)
✓ Historical comparison shows extreme positioning
✓ Price action confirms (wait for price confirmation)
---
⚠️ Important Notes
COT data is weekly - Updates every Friday afternoon
Extremes can persist - Don't expect immediate reversals
Combine with price action - COT is one tool among many
Historical context matters - Consider market conditions
Meats markets are special - Small specs are accurate (like commercials)
Signals are rare - High-quality signals don't appear every week
---
This description covers all settings and features of the Larry Williams COT Analysis Enhanced indicator. Larry Williams recommends combining COT analysis with other indicators for setup signals: Williams Sentiment Index, Williams Valuation Index, Williams True Seasonal, Pinch and Paunch Signal, along with price action, technical analysis, and fundamental factors.
---
📖 Conclusion
The Larry Williams COT Analysis Enhanced indicator provides a sophisticated framework for understanding market sentiment through the lens of different participant groups. By combining mathematical analysis with behavioral insights, it displays COT positioning data, calculates index values, and generates signals based on extreme positioning.
Remember: This is a tool for analysis, not a crystal ball. Consider combining COT analysis with other Larry Williams indicators, price action, technical analysis, and fundamental factors.
Practice with the indicator, study historical signals, and develop your understanding of how different market participants behave. Signals with multiple factors aligned - Commercials at extremes, Open Interest changes driven by the right groups, and price action confirming the COT signals - have shown higher historical accuracy.
This description provides comprehensive documentation for the Larry Williams COT Analysis Enhanced indicator. For the most current data and analysis, always refer to the latest COT reports and market conditions.
---
Acknowledgment
This tool builds upon the foundational work of Larry Williams, who developed the Commitments of Traders (COT) analysis methodology and the principles for interpreting COT data. It also incorporates enhancements including statistical validation, combination analysis, adaptive signal generation, and comprehensive historical comparison features.
Note: Always practice proper risk management and thoroughly test the indicator to ensure it aligns with your trading strategy. Past performance is not indicative of future results.

Bill Williams. Awesome Oscillator (AC)Hi
Let me introduce my Bill Williams. Awesome Oscillator (AC) script.
This indicator plots the oscillator as a histogram where blue denotes
periods suited for buying and red . for selling. If the current value
of AO (Awesome Oscillator) is above previous, the period is considered
suited for buying and the period is marked blue. If the AO value is not
above previous, the period is considered suited for selling and the
indicator marks it as red.
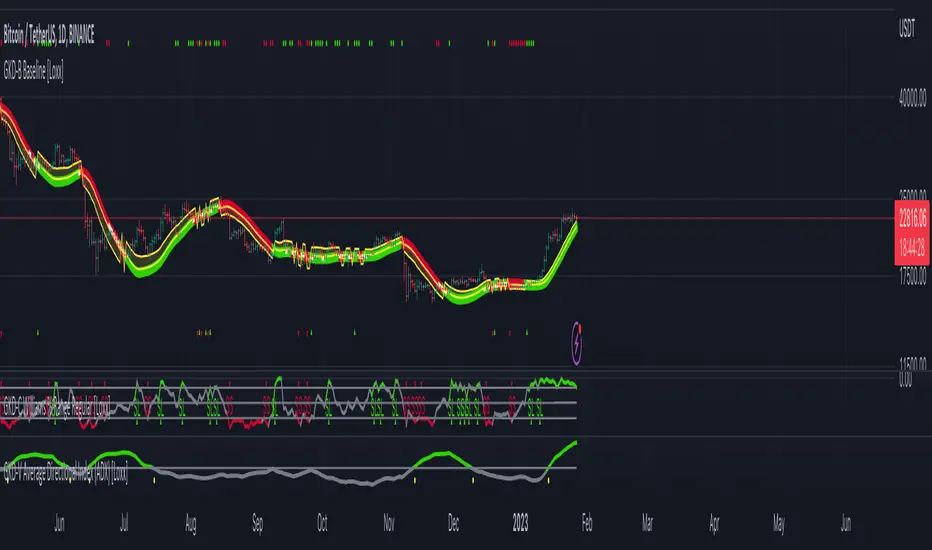
Larry Williams POIV A/D [tradeviZion]Larry Williams' POIV A/D - Release Notes v1.0
=================================================
Release Date: 01 April 2025
OVERVIEW
--------
The Larry Williams POIV A/D (Price, Open Interest, Volume Accumulation/Distribution) indicator implements Williams' original formula while adding advanced divergence detection capabilities. This powerful tool combines price movement, open interest, and volume data to identify potential trend reversals and continuations.
FEATURES
--------
- Implements Larry Williams' original POIV A/D formula
- Divergence detection system:
* Regular divergences for trend reversal signals
* Hidden divergences for trend continuation signals
- Fast Mode option for earlier pivot detection
- Customizable sensitivity for divergence filtering
- Dynamic color visualization based on indicator direction
- Adjustable smoothing to reduce noise
- Automatic fallback to OBV when Open Interest is unavailable
FORMULA
-------
POIV A/D = CumulativeSum(Open Interest * (Close - Close ) / (True High - True Low)) + OBV
Where:
- Open Interest: Current period's open interest
- Close - Close : Price change from previous period
- True High - True Low: True Range
- OBV: On Balance Volume
DIVERGENCE TYPES
---------------
1. Regular Divergences (Reversal Signals):
- Bullish: Price makes lower lows while indicator makes higher lows
- Bearish: Price makes higher highs while indicator makes lower highs
2. Hidden Divergences (Continuation Signals):
- Bullish: Price makes higher lows while indicator makes lower lows
- Bearish: Price makes lower highs while indicator makes higher highs
REQUIREMENTS
-----------
- Works best with futures and other instruments that provide Open Interest data
- Automatically adapts to work with any instrument by using OBV when OI is unavailable
USAGE GUIDE
-----------
1. Apply the indicator to any chart
2. Configure settings:
- Adjust sensitivity for divergence detection
- Enable/disable Fast Mode for earlier signals
- Customize visual settings as needed
3. Look for divergence signals:
- Regular divergences for potential trend reversals
- Hidden divergences for trend continuation opportunities
4. Use the alerts system for automated divergence detection
KNOWN LIMITATIONS
----------------
- Requires Open Interest data for full functionality
- Fast Mode may generate more signals but with lower reliability
ACKNOWLEDGEMENTS
---------------
This indicator is based on Larry Williams' work on Open Interest analysis. The implementation includes additional features for divergence detection while maintaining the integrity of the original formula.

GKD-C Williams % Range Regular [Loxx]Giga Kaleidoscope Williams Precent Range is a Confirmation module included in Loxx's "Giga Kaleidoscope Modularized Trading System".
█ Giga Kaleidoscope Modularized Trading System
What is Loxx's "Giga Kaleidoscope Modularized Trading System"?
The Giga Kaleidoscope Modularized Trading System is a trading system built on the philosophy of the NNFX (No Nonsense Forex) algorithmic trading.
What is an NNFX algorithmic trading strategy?
The NNFX algorithm is built on the principles of trend, momentum, and volatility. There are six core components in the NNFX trading algorithm:
1. Volatility - price volatility; e.g., Average True Range, True Range Double, Close-to-Close, etc.
2. Baseline - a moving average to identify price trend
3. Confirmation 1 - a technical indicator used to identify trends.
4. Confirmation 2 - a technical indicator used to identify trends.
5. Continuation - a technical indicator used to identify trends.
6. Volatility/Volume - a technical indicator used to identify volatility/volume breakouts/breakdown.
7. Exit - a technical indicator used to determine when a trend is exhausted.
How does Loxx's GKD (Giga Kaleidoscope Modularized Trading System) implement the NNFX algorithm outlined above?
Loxx's GKD v1.0 system has five types of modules (indicators/strategies). These modules are:
1. GKD-BT - Backtesting module (Volatility, Number 1 in the NNFX algorithm)
2. GKD-B - Baseline module (Baseline and Volatility/Volume, Numbers 1 and 2 in the NNFX algorithm)
3. GKD-C - Confirmation 1/2 and Continuation module (Confirmation 1/2 and Continuation, Numbers 3, 4, and 5 in the NNFX algorithm)
4. GKD-V - Volatility/Volume module (Confirmation 1/2, Number 6 in the NNFX algorithm)
5. GKD-E - Exit module (Exit, Number 7 in the NNFX algorithm)
(additional module types will added in future releases)
Each module interacts with every module by passing data between modules. Data is passed between each module as described below:
GKD-B => GKD-V => GKD-C(1) => GKD-C(2) => GKD-C(Continuation) => GKD-E => GKD-BT
That is, the Baseline indicator passes its data to Volatility/Volume. The Volatility/Volume indicator passes its values to the Confirmation 1 indicator. The Confirmation 1 indicator passes its values to the Confirmation 2 indicator. The Confirmation 2 indicator passes its values to the Continuation indicator. The Continuation indicator passes its values to the Exit indicator, and finally, the Exit indicator passes its values to the Backtest strategy.
This chaining of indicators requires that each module conform to Loxx's GKD protocol, therefore allowing for the testing of every possible combination of technical indicators that make up the six components of the NNFX algorithm.
What does the application of the GKD trading system look like?
Example trading system:
Backtest: Strategy with 1-3 take profits, trailing stop loss, multiple types of PnL volatility, and 2 backtesting styles
Baseline: Hull Moving Average as shown on the chart above
Volatility/Volume: Average Directional Index (ADX) as shown on the chart above
Confirmation 1: Williams Precent Range as shown on the chart above
Confirmation 2: Williams Percent Range
Continuation: Fisher Transform
Exit: Rex Oscillator
Each GKD indicator is denoted with a module identifier of either: GKD-BT, GKD-B, GKD-C, GKD-V, or GKD-E. This allows traders to understand to which module each indicator belongs and where each indicator fits into the GKD protocol chain.
Giga Kaleidoscope Modularized Trading System Signals (based on the NNFX algorithm)
Standard Entry
1. GKD-C Confirmation 1 Signal
2. GKD-B Baseline agrees
3. Price is within a range of 0.2x Volatility and 1.0x Volatility of the Goldie Locks Mean
4. GKD-C Confirmation 2 agrees
5. GKD-V Volatility/Volume agrees
Baseline Entry
1. GKD-B Baseline signal
2. GKD-C Confirmation 1 agrees
3. Price is within a range of 0.2x Volatility and 1.0x Volatility of the Goldie Locks Mean
4. GKD-C Confirmation 2 agrees
5. GKD-V Volatility/Volume agrees
6. GKD-C Confirmation 1 signal was less than 7 candles prior
Continuation Entry
1. Standard Entry, Baseline Entry, or Pullback; entry triggered previously
2. GKD-B Baseline hasn't crossed since entry signal trigger
3. GKD-C Confirmation Continuation Indicator signals
4. GKD-C Confirmation 1 agrees
5. GKD-B Baseline agrees
6. GKD-C Confirmation 2 agrees
1-Candle Rule Standard Entry
1. GKD-C Confirmation 1 signal
2. GKD-B Baseline agrees
3. Price is within a range of 0.2x Volatility and 1.0x Volatility of the Goldie Locks Mean
Next Candle:
1. Price retraced (Long: close < close or Short: close > close )
2. GKD-B Baseline agrees
3. GKD-C Confirmation 1 agrees
4. GKD-C Confirmation 2 agrees
5. GKD-V Volatility/Volume agrees
1-Candle Rule Baseline Entry
1. GKD-B Baseline signal
2. GKD-C Confirmation 1 agrees
3. Price is within a range of 0.2x Volatility and 1.0x Volatility of the Goldie Locks Mean
4. GKD-C Confirmation 1 signal was less than 7 candles prior
Next Candle:
1. Price retraced (Long: close < close or Short: close > close )
2. GKD-B Baseline agrees
3. GKD-C Confirmation 1 agrees
4. GKD-C Confirmation 2 agrees
5. GKD-V Volatility/Volume Agrees
PullBack Entry
1. GKD-B Baseline signal
2. GKD-C Confirmation 1 agrees
3. Price is beyond 1.0x Volatility of Baseline
Next Candle:
1. Price is within a range of 0.2x Volatility and 1.0x Volatility of the Goldie Locks Mean
3. GKD-C Confirmation 1 agrees
4. GKD-C Confirmation 2 agrees
5. GKD-V Volatility/Volume Agrees
█ Williams Precent Range
What is Williams Precent Range?
Williams %R, also known as the Williams Percent Range, is a type of momentum indicator that moves between 0 and -100 and measures overbought and oversold levels. The Williams %R may be used to find entry and exit points in the market. The indicator is very similar to the Stochastic oscillator and is used in the same way. It was developed by Larry Williams and it compares a stock’s closing price to the high-low range over a specific period, typically 14 days or periods.
Requirements
Inputs
Confirmation 1 and Solo Confirmation: GKD-V Volatility / Volume indicator
Confirmation 2: GKD-C Confirmation indicator
Outputs
Confirmation 2 and Solo Confirmation: GKD-E Exit indicator
Confirmation 1: GKD-C Confirmation indicator
Continuation: GKD-E Exit indicator
Additional features will be added in future releases.
This indicator is only available to ALGX Trading VIP group members . You can see the Author's Instructions below to get more information on how to get access.
CFB-Adaptive, Williams %R w/ Dynamic Zones [Loxx]CFB-Adaptive, Williams %R w/ Dynamic Zones is a Jurik-Composite-Fractal-Behavior-Adaptive Williams % Range indicator with Dynamic Zones. These additions to the WPR calculation reduce noise and return a signal that is more viable than WPR alone.
What is Williams %R?
Williams %R , also known as the Williams Percent Range, is a type of momentum indicator that moves between 0 and -100 and measures overbought and oversold levels. The Williams %R may be used to find entry and exit points in the market. The indicator is very similar to the Stochastic oscillator and is used in the same way. It was developed by Larry Williams and it compares a stock’s closing price to the high-low range over a specific period, typically 14 days or periods.
What is Composite Fractal Behavior ( CFB )?
All around you mechanisms adjust themselves to their environment. From simple thermostats that react to air temperature to computer chips in modern cars that respond to changes in engine temperature, r.p.m.'s, torque, and throttle position. It was only a matter of time before fast desktop computers applied the mathematics of self-adjustment to systems that trade the financial markets.
Unlike basic systems with fixed formulas, an adaptive system adjusts its own equations. For example, start with a basic channel breakout system that uses the highest closing price of the last N bars as a threshold for detecting breakouts on the up side. An adaptive and improved version of this system would adjust N according to market conditions, such as momentum, price volatility or acceleration.
Since many systems are based directly or indirectly on cycles, another useful measure of market condition is the periodic length of a price chart's dominant cycle, (DC), that cycle with the greatest influence on price action.
The utility of this new DC measure was noted by author Murray Ruggiero in the January '96 issue of Futures Magazine. In it. Mr. Ruggiero used it to adaptive adjust the value of N in a channel breakout system. He then simulated trading 15 years of D-Mark futures in order to compare its performance to a similar system that had a fixed optimal value of N. The adaptive version produced 20% more profit!
This DC index utilized the popular MESA algorithm (a formulation by John Ehlers adapted from Burg's maximum entropy algorithm, MEM). Unfortunately, the DC approach is problematic when the market has no real dominant cycle momentum, because the mathematics will produce a value whether or not one actually exists! Therefore, we developed a proprietary indicator that does not presuppose the presence of market cycles. It's called CFB (Composite Fractal Behavior) and it works well whether or not the market is cyclic.
CFB examines price action for a particular fractal pattern, categorizes them by size, and then outputs a composite fractal size index. This index is smooth, timely and accurate
Essentially, CFB reveals the length of the market's trending action time frame. Long trending activity produces a large CFB index and short choppy action produces a small index value. Investors have found many applications for CFB which involve scaling other existing technical indicators adaptively, on a bar-to-bar basis.
What is Jurik Volty used in the Juirk Filter?
One of the lesser known qualities of Juirk smoothing is that the Jurik smoothing process is adaptive. "Jurik Volty" (a sort of market volatility ) is what makes Jurik smoothing adaptive. The Jurik Volty calculation can be used as both a standalone indicator and to smooth other indicators that you wish to make adaptive.
What is the Jurik Moving Average?
Have you noticed how moving averages add some lag (delay) to your signals? ... especially when price gaps up or down in a big move, and you are waiting for your moving average to catch up? Wait no more! JMA eliminates this problem forever and gives you the best of both worlds: low lag and smooth lines.
Ideally, you would like a filtered signal to be both smooth and lag-free. Lag causes delays in your trades, and increasing lag in your indicators typically result in lower profits. In other words, late comers get what's left on the table after the feast has already begun.
What are Dynamic Zones?
As explained in "Stocks & Commodities V15:7 (306-310): Dynamic Zones by Leo Zamansky, Ph .D., and David Stendahl"
Most indicators use a fixed zone for buy and sell signals. Here’ s a concept based on zones that are responsive to past levels of the indicator.
One approach to active investing employs the use of oscillators to exploit tradable market trends. This investing style follows a very simple form of logic: Enter the market only when an oscillator has moved far above or below traditional trading lev- els. However, these oscillator- driven systems lack the ability to evolve with the market because they use fixed buy and sell zones. Traders typically use one set of buy and sell zones for a bull market and substantially different zones for a bear market. And therein lies the problem.
Once traders begin introducing their market opinions into trading equations, by changing the zones, they negate the system’s mechanical nature. The objective is to have a system automatically define its own buy and sell zones and thereby profitably trade in any market — bull or bear. Dynamic zones offer a solution to the problem of fixed buy and sell zones for any oscillator-driven system.
An indicator’s extreme levels can be quantified using statistical methods. These extreme levels are calculated for a certain period and serve as the buy and sell zones for a trading system. The repetition of this statistical process for every value of the indicator creates values that become the dynamic zones. The zones are calculated in such a way that the probability of the indicator value rising above, or falling below, the dynamic zones is equal to a given probability input set by the trader.
To better understand dynamic zones, let's first describe them mathematically and then explain their use. The dynamic zones definition:
Find V such that:
For dynamic zone buy: P{X <= V}=P1
For dynamic zone sell: P{X >= V}=P2
where P1 and P2 are the probabilities set by the trader, X is the value of the indicator for the selected period and V represents the value of the dynamic zone.
The probability input P1 and P2 can be adjusted by the trader to encompass as much or as little data as the trader would like. The smaller the probability, the fewer data values above and below the dynamic zones. This translates into a wider range between the buy and sell zones. If a 10% probability is used for P1 and P2, only those data values that make up the top 10% and bottom 10% for an indicator are used in the construction of the zones. Of the values, 80% will fall between the two extreme levels. Because dynamic zone levels are penetrated so infrequently, when this happens, traders know that the market has truly moved into overbought or oversold territory.
Calculating the Dynamic Zones
The algorithm for the dynamic zones is a series of steps. First, decide the value of the lookback period t. Next, decide the value of the probability Pbuy for buy zone and value of the probability Psell for the sell zone.
For i=1, to the last lookback period, build the distribution f(x) of the price during the lookback period i. Then find the value Vi1 such that the probability of the price less than or equal to Vi1 during the lookback period i is equal to Pbuy. Find the value Vi2 such that the probability of the price greater or equal to Vi2 during the lookback period i is equal to Psell. The sequence of Vi1 for all periods gives the buy zone. The sequence of Vi2 for all periods gives the sell zone.
In the algorithm description, we have: Build the distribution f(x) of the price during the lookback period i. The distribution here is empirical namely, how many times a given value of x appeared during the lookback period. The problem is to find such x that the probability of a price being greater or equal to x will be equal to a probability selected by the user. Probability is the area under the distribution curve. The task is to find such value of x that the area under the distribution curve to the right of x will be equal to the probability selected by the user. That x is the dynamic zone.
Included:
Bar coloring
3 signal variations w/ alerts
Divergences w/ alerts
Loxx's Expanded Source Types

Williams%R EMA CROSSESWilliams %R , also known as the Williams Percent Range, is a type of momentum indicator that moves between 0 and -100 and measures overbought and oversold levels. The Williams %R may be used to find entry and exit points in the market.
In this study, exponential moving averages are used in order to smooth out the false signals produced by Williams %R and to see more accurate signals.
In addition, it is aimed to see the divergences by using the moving averages of The Williams %R.
When the short exponential moving averages of Williams %R is above the longs, it may be a signal to think an uptrend will begin, and the long exponential moving averages of Williams %R is above the shorts, it may be a signal to think a downtrend will begin.
At the same time, a second check can be made for price movement with weighted moving averages.

TradeBeard Larry Williams A/D + Classic DivergenceName: TradeBeard – Larry Williams A/D + Classic Divergence
What it does:
This indicator plots a classic Larry Williams Accumulation/Distribution (A/D) line, using:
(Close−Open)/(High−Low)×Volume
It then looks at price swings vs. A/D swings and marks true Larry-style divergences:
Bull Div – Price makes a lower low, but the A/D line makes a higher low → buying pressure/accumulation.
Bear Div – Price makes a higher high, but the A/D line makes a lower high → selling pressure/distribution.
Lines are drawn between the two pivots on the A/D line, with a label at the most recent pivot.
How to use / read it:
Use on any timeframe; the logic is the same.
Look for Bull Div near potential bottoms as confirmation that smart money is quietly buying.
Look for Bear Div near potential tops as confirmation that smart money is unloading.
Settings:
Pivot left bars (price) / Pivot right bars (price)
Controls how “wide” a swing high/low must be.
1 / 1 ≈ very sensitive (ICT/Larry-style 3-bar swings).
Higher values = fewer but cleaner swings and fewer signals.
Show bullish divergences / Show bearish divergences
Turn each signal type on or off.
Bullish color (line + label) / Bearish color (line + label)
Color of the divergence lines and label background.
Bullish label text color / Bearish label text color
Text color inside the Bull Div / Bear Div labels.
That’s it: pure Larry Williams A/D flow, price-based pivots, and clean visual divergence signals, wrapped in a TradeBeard skin.
I hope this will help you in your trading.
// Disclaimer:
// This script is for educational and informational purposes only.
// Trading and investing involve risk. You are fully responsible for your own decisions,

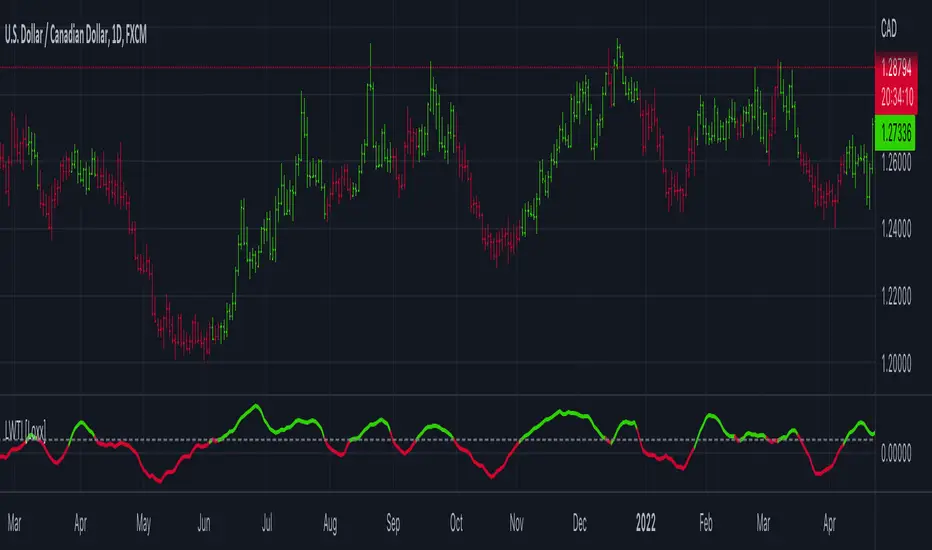
Larry Williams Large Trade Index (LWTI) [Loxx]Larry Williams Large Trade Index (LWTI) is an indicatory by Larry Williams as explained in his book "Trade Stocks and Commodities with the Insiders: Secrets of the COT Report". I've added optional smoothing if you wish to smooth the output.
What is the Larry Williams Large Trade Index (LWTI)?
The original concept was specifically based on Trader (or Market) Sentiment and predicting market reversals. It's calculated as follows:
MovingAvg(Close - Close , bars used in average)/MovingAvg(Range,bars used in average)*50 + 50
Included
Bar coloring
Signals
Alerts
Larry Williams Proxy Index (LWPI) [Loxx]Larry Williams Proxy Index (LWPI) is an indicatory by Larry Williams as explained in his book "Trade Stocks and Commodities with the Insiders: Secrets of the COT Report", pages 129-135. This is an INVERSE indicator, so follow the signals and colors to understand what it's doing. I've added optional smoothing if you wish to smooth the output.
What is the Larry Williams Proxy Index (LWPI)?
The original concept was specifically based on Trader (or Market) Sentiment and predicting market reversals. It's calculated as follows:
MovingAvg(Open-Close, bars used in average)/MovingAvg(Range, bars used in average)*50+50
Included
Bar coloring
Signals
Alerts

Inverse Fisher Transform on Williams %RInverse Fisher Transform On Williams %R
Since Williams R indicator produces negative values, I preferred to add 50 instead of subtracting 50.
It produces values between 0.5 and -0.5.
Generates clear buy and sell signals.
Williams %R determines overbought and oversold levels.
You can see more softly.

Dual Timeframe Williams Percent RangeThis is a dual timeframe Williams Percent Range indicator.
Function:
The idea behind this indicator is for trader to see what the Williams %r is doing on higher timeframes without the need to change the chart. I added the "Smoothing" function to take the jagged lines out of the higher timeframe. It has a better flow this way.
If we choose the 4H and the Daily timeframes for example. In this bullish situation I wait for the Daily WPR to cross above the -50 mid line. Then the faster 4H WPR will eventually hit the bottom and begin to rise again back into the trend.
This is the "Reset" of the 4H WPR and when the 4H WPR crosses up above the -50 mid line again it means price should begin to rise on the chart. I added the option to change the colour when the signal lines cross the -50. It is good to use a fast time frame so you can see the WPR hitting the bottom in an uptrend, but not too fast.
The Heiken Ashi candle sticks are a very good addition to this system. You can also use a colour changing 200 EMA if you run the "1H/Daily" in the WPR. Or the 50 EMA if you run the Daily 4H.
This system could be used on lower timeframes too but I have not tested it there.
The Dual WPR indicator, the colour changing 50 EMA and Heiken Ashi have been optimised for the 4H/Daily.
If you want to set alerts the the faster WPR line crossing the -50 is good, on candle close.
This way you will only need one alert per chart.
If you get an alert on the EURUSD 4H that the 4H WPR has crossed up then look to see what what the Daily WPR is doing. If it is also above the -50 mid line then EURUSD is probably trending up.
Thank you to TradingView for supplying the Williams %r template.
I hope this helps some other traders out there.
I combined the Supertrend and the Coloured EMA in the main screen into one indicator.
This is my first indicator published :-)
Have fun out there and good luck.
Eddie T.

GKD-V Williams VixFix w/ Softmax [Loxx]The Giga Kaleidoscope GKD-V Williams VixFix w/ Softmax is a Volume/Volatility module included in Loxx's "Giga Kaleidoscope Modularized Trading System."
█ GKD-V Williams VixFix w/ Softmax
The Williams' Vix Fix indicator, a creation aimed at replicating the VIX (Volatility Index) for any asset, marks a significant advancement in volatility measurement, particularly for markets or instruments lacking options data. This indicator is designed to identify periods of extreme market stress or potential reversal points by measuring the distance between the highest past prices and current lows, reflecting panic or fear levels akin to those captured by the traditional VIX for the S&P 500. Enhanced with options for softmax normalization and a threshold-based signaling mechanism, the Vix Fix becomes a highly adaptable tool. Softmax normalization introduces a sophisticated method to normalize volatility signals, improving their interpretability and responsiveness to market changes. The threshold level option, on the other hand, provides a simpler, yet effective way to generate signals based on predefined volatility levels. This innovative approach to volatility analysis enables traders and analysts to leverage a more nuanced understanding of market dynamics, tailoring the indicator to their specific needs and strategies for navigating complex financial landscapes.
█ Giga Kaleidoscope Modularized Trading System
Core components of an NNFX algorithmic trading strategy
The NNFX algorithm is built on the principles of trend, momentum, and volatility. There are six core components in the NNFX trading algorithm:
1. Volatility - price volatility; e.g., Average True Range, True Range Double, Close-to-Close, etc.
2. Baseline - a moving average to identify price trend
3. Confirmation 1 - a technical indicator used to identify trends
4. Confirmation 2 - a technical indicator used to identify trends
5. Continuation - a technical indicator used to identify trends
6. Volatility/Volume - a technical indicator used to identify volatility/volume breakouts/breakdown
7. Exit - a technical indicator used to determine when a trend is exhausted
8. Metamorphosis - a technical indicator that produces a compound signal from the combination of other GKD indicators*
*(not part of the NNFX algorithm)
What is Volatility in the NNFX trading system?
In the NNFX (No Nonsense Forex) trading system, ATR (Average True Range) is typically used to measure the volatility of an asset. It is used as a part of the system to help determine the appropriate stop loss and take profit levels for a trade. ATR is calculated by taking the average of the true range values over a specified period.
True range is calculated as the maximum of the following values:
-Current high minus the current low
-Absolute value of the current high minus the previous close
-Absolute value of the current low minus the previous close
ATR is a dynamic indicator that changes with changes in volatility. As volatility increases, the value of ATR increases, and as volatility decreases, the value of ATR decreases. By using ATR in NNFX system, traders can adjust their stop loss and take profit levels according to the volatility of the asset being traded. This helps to ensure that the trade is given enough room to move, while also minimizing potential losses.
Other types of volatility include True Range Double (TRD), Close-to-Close, and Garman-Klass
What is a Baseline indicator?
The baseline is essentially a moving average, and is used to determine the overall direction of the market.
The baseline in the NNFX system is used to filter out trades that are not in line with the long-term trend of the market. The baseline is plotted on the chart along with other indicators, such as the Moving Average (MA), the Relative Strength Index (RSI), and the Average True Range (ATR).
Trades are only taken when the price is in the same direction as the baseline. For example, if the baseline is sloping upwards, only long trades are taken, and if the baseline is sloping downwards, only short trades are taken. This approach helps to ensure that trades are in line with the overall trend of the market, and reduces the risk of entering trades that are likely to fail.
By using a baseline in the NNFX system, traders can have a clear reference point for determining the overall trend of the market, and can make more informed trading decisions. The baseline helps to filter out noise and false signals, and ensures that trades are taken in the direction of the long-term trend.
What is a Confirmation indicator?
Confirmation indicators are technical indicators that are used to confirm the signals generated by primary indicators. Primary indicators are the core indicators used in the NNFX system, such as the Average True Range (ATR), the Moving Average (MA), and the Relative Strength Index (RSI).
The purpose of the confirmation indicators is to reduce false signals and improve the accuracy of the trading system. They are designed to confirm the signals generated by the primary indicators by providing additional information about the strength and direction of the trend.
Some examples of confirmation indicators that may be used in the NNFX system include the Bollinger Bands, the MACD (Moving Average Convergence Divergence), and the MACD Oscillator. These indicators can provide information about the volatility, momentum, and trend strength of the market, and can be used to confirm the signals generated by the primary indicators.
In the NNFX system, confirmation indicators are used in combination with primary indicators and other filters to create a trading system that is robust and reliable. By using multiple indicators to confirm trading signals, the system aims to reduce the risk of false signals and improve the overall profitability of the trades.
What is a Continuation indicator?
In the NNFX (No Nonsense Forex) trading system, a continuation indicator is a technical indicator that is used to confirm a current trend and predict that the trend is likely to continue in the same direction. A continuation indicator is typically used in conjunction with other indicators in the system, such as a baseline indicator, to provide a comprehensive trading strategy.
What is a Volatility/Volume indicator?
Volume indicators, such as the On Balance Volume (OBV), the Chaikin Money Flow (CMF), or the Volume Price Trend (VPT), are used to measure the amount of buying and selling activity in a market. They are based on the trading volume of the market, and can provide information about the strength of the trend. In the NNFX system, volume indicators are used to confirm trading signals generated by the Moving Average and the Relative Strength Index. Volatility indicators include Average Direction Index, Waddah Attar, and Volatility Ratio. In the NNFX trading system, volatility is a proxy for volume and vice versa.
By using volume indicators as confirmation tools, the NNFX trading system aims to reduce the risk of false signals and improve the overall profitability of trades. These indicators can provide additional information about the market that is not captured by the primary indicators, and can help traders to make more informed trading decisions. In addition, volume indicators can be used to identify potential changes in market trends and to confirm the strength of price movements.
What is an Exit indicator?
The exit indicator is used in conjunction with other indicators in the system, such as the Moving Average (MA), the Relative Strength Index (RSI), and the Average True Range (ATR), to provide a comprehensive trading strategy.
The exit indicator in the NNFX system can be any technical indicator that is deemed effective at identifying optimal exit points. Examples of exit indicators that are commonly used include the Parabolic SAR, and the Average Directional Index (ADX).
The purpose of the exit indicator is to identify when a trend is likely to reverse or when the market conditions have changed, signaling the need to exit a trade. By using an exit indicator, traders can manage their risk and prevent significant losses.
In the NNFX system, the exit indicator is used in conjunction with a stop loss and a take profit order to maximize profits and minimize losses. The stop loss order is used to limit the amount of loss that can be incurred if the trade goes against the trader, while the take profit order is used to lock in profits when the trade is moving in the trader's favor.
Overall, the use of an exit indicator in the NNFX trading system is an important component of a comprehensive trading strategy. It allows traders to manage their risk effectively and improve the profitability of their trades by exiting at the right time.
What is an Metamorphosis indicator?
The concept of a metamorphosis indicator involves the integration of two or more GKD indicators to generate a compound signal. This is achieved by evaluating the accuracy of each indicator and selecting the signal from the indicator with the highest accuracy. As an illustration, let's consider a scenario where we calculate the accuracy of 10 indicators and choose the signal from the indicator that demonstrates the highest accuracy.
The resulting output from the metamorphosis indicator can then be utilized in a GKD-BT backtest by occupying a slot that aligns with the purpose of the metamorphosis indicator. The slot can be a GKD-B, GKD-C, or GKD-E slot, depending on the specific requirements and objectives of the indicator. This allows for seamless integration and utilization of the compound signal within the GKD-BT framework.
How does Loxx's GKD (Giga Kaleidoscope Modularized Trading System) implement the NNFX algorithm outlined above?
Loxx's GKD v2.0 system has five types of modules (indicators/strategies). These modules are:
1. GKD-BT - Backtesting module (Volatility, Number 1 in the NNFX algorithm)
2. GKD-B - Baseline module (Baseline and Volatility/Volume, Numbers 1 and 2 in the NNFX algorithm)
3. GKD-C - Confirmation 1/2 and Continuation module (Confirmation 1/2 and Continuation, Numbers 3, 4, and 5 in the NNFX algorithm)
4. GKD-V - Volatility/Volume module (Confirmation 1/2, Number 6 in the NNFX algorithm)
5. GKD-E - Exit module (Exit, Number 7 in the NNFX algorithm)
6. GKD-M - Metamorphosis module (Metamorphosis, Number 8 in the NNFX algorithm, but not part of the NNFX algorithm)
(additional module types will added in future releases)
Each module interacts with every module by passing data to A backtest module wherein the various components of the GKD system are combined to create a trading signal.
That is, the Baseline indicator passes its data to Volatility/Volume. The Volatility/Volume indicator passes its values to the Confirmation 1 indicator. The Confirmation 1 indicator passes its values to the Confirmation 2 indicator. The Confirmation 2 indicator passes its values to the Continuation indicator. The Continuation indicator passes its values to the Exit indicator, and finally, the Exit indicator passes its values to the Backtest strategy.
This chaining of indicators requires that each module conform to Loxx's GKD protocol, therefore allowing for the testing of every possible combination of technical indicators that make up the six components of the NNFX algorithm.
What does the application of the GKD trading system look like?
Example trading system:
Backtest: Multi-Ticker CC Backtest
Baseline: Hull Moving Average
Volatility/Volume: Hurst Exponent
Confirmation 1: Advance Trend Pressure as shown on the chart above
Confirmation 2: uf2018
Continuation: Coppock Curve
Exit: Rex Oscillator
Metamorphosis: Baseline Optimizer
Each GKD indicator is denoted with a module identifier of either: GKD-BT, GKD-B, GKD-C, GKD-V, GKD-M, or GKD-E. This allows traders to understand to which module each indicator belongs and where each indicator fits into the GKD system.
█ Giga Kaleidoscope Modularized Trading System Signals
Standard Entry
1. GKD-C Confirmation gives signal
2. Baseline agrees
3. Price inside Goldie Locks Zone Minimum
4. Price inside Goldie Locks Zone Maximum
5. Confirmation 2 agrees
6. Volatility/Volume agrees
1-Candle Standard Entry
1a. GKD-C Confirmation gives signal
2a. Baseline agrees
3a. Price inside Goldie Locks Zone Minimum
4a. Price inside Goldie Locks Zone Maximum
Next Candle
1b. Price retraced
2b. Baseline agrees
3b. Confirmation 1 agrees
4b. Confirmation 2 agrees
5b. Volatility/Volume agrees
Baseline Entry
1. GKD-B Baseline gives signal
2. Confirmation 1 agrees
3. Price inside Goldie Locks Zone Minimum
4. Price inside Goldie Locks Zone Maximum
5. Confirmation 2 agrees
6. Volatility/Volume agrees
7. Confirmation 1 signal was less than 'Maximum Allowable PSBC Bars Back' prior
1-Candle Baseline Entry
1a. GKD-B Baseline gives signal
2a. Confirmation 1 agrees
3a. Price inside Goldie Locks Zone Minimum
4a. Price inside Goldie Locks Zone Maximum
5a. Confirmation 1 signal was less than 'Maximum Allowable PSBC Bars Back' prior
Next Candle
1b. Price retraced
2b. Baseline agrees
3b. Confirmation 1 agrees
4b. Confirmation 2 agrees
5b. Volatility/Volume agrees
Volatility/Volume Entry
1. GKD-V Volatility/Volume gives signal
2. Confirmation 1 agrees
3. Price inside Goldie Locks Zone Minimum
4. Price inside Goldie Locks Zone Maximum
5. Confirmation 2 agrees
6. Baseline agrees
7. Confirmation 1 signal was less than 7 candles prior
1-Candle Volatility/Volume Entry
1a. GKD-V Volatility/Volume gives signal
2a. Confirmation 1 agrees
3a. Price inside Goldie Locks Zone Minimum
4a. Price inside Goldie Locks Zone Maximum
5a. Confirmation 1 signal was less than 'Maximum Allowable PSVVC Bars Back' prior
Next Candle
1b. Price retraced
2b. Volatility/Volume agrees
3b. Confirmation 1 agrees
4b. Confirmation 2 agrees
5b. Baseline agrees
Confirmation 2 Entry
1. GKD-C Confirmation 2 gives signal
2. Confirmation 1 agrees
3. Price inside Goldie Locks Zone Minimum
4. Price inside Goldie Locks Zone Maximum
5. Volatility/Volume agrees
6. Baseline agrees
7. Confirmation 1 signal was less than 7 candles prior
1-Candle Confirmation 2 Entry
1a. GKD-C Confirmation 2 gives signal
2a. Confirmation 1 agrees
3a. Price inside Goldie Locks Zone Minimum
4a. Price inside Goldie Locks Zone Maximum
5a. Confirmation 1 signal was less than 'Maximum Allowable PSC2C Bars Back' prior
Next Candle
1b. Price retraced
2b. Confirmation 2 agrees
3b. Confirmation 1 agrees
4b. Volatility/Volume agrees
5b. Baseline agrees
PullBack Entry
1a. GKD-B Baseline gives signal
2a. Confirmation 1 agrees
3a. Price is beyond 1.0x Volatility of Baseline
Next Candle
1b. Price inside Goldie Locks Zone Minimum
2b. Price inside Goldie Locks Zone Maximum
3b. Confirmation 1 agrees
4b. Confirmation 2 agrees
5b. Volatility/Volume agrees
Continuation Entry
1. Standard Entry, 1-Candle Standard Entry, Baseline Entry, 1-Candle Baseline Entry, Volatility/Volume Entry, 1-Candle Volatility/Volume Entry, Confirmation 2 Entry, 1-Candle Confirmation 2 Entry, or Pullback entry triggered previously
2. Baseline hasn't crossed since entry signal trigger
4. Confirmation 1 agrees
5. Baseline agrees
6. Confirmation 2 agrees
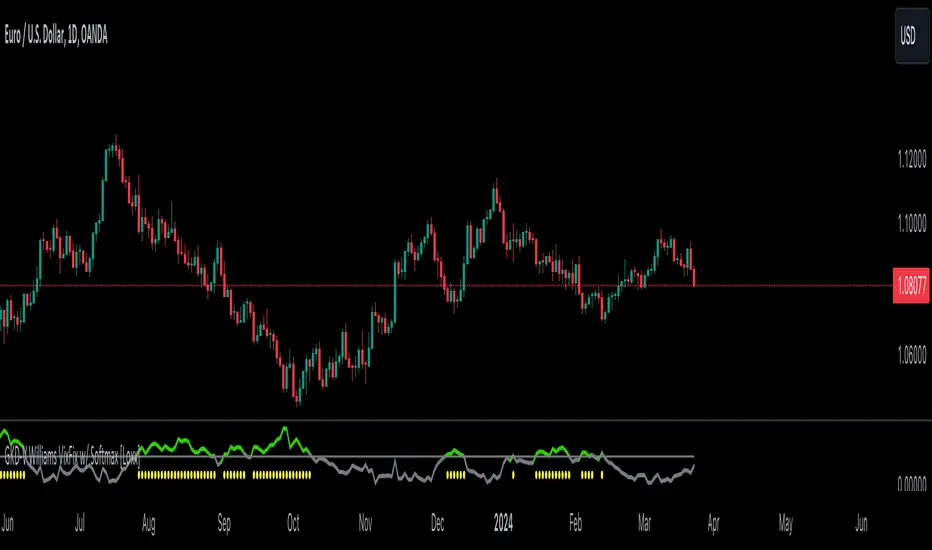
Ace Pro Custom Williams %R Indicator [FREE]The Ace Pro Custom Williams %R Indicator comes preset with most of Ace’s favorite options in one: the Williams %R, the LSMA, and the EMA, and horizontal lines.
Adding these options manually can take up lots of time and space, so this indicator is designed to help traders save both.
Special note about selecting colors:
Order of items in the menu:
1. %R = %R
2. Plot = LSMA
3. Plot = EMA
To confirm, the first plot option is for the color of the LSMA, while the second plot option is for the color of the EMA.

Williams %RWilliams %R indicator with Bollinger Bands.
A bound oscillator from a formula by Larry Williams.
The oscillator ranges from 0 to -100. Overbought is at -20 and oversold is -80.
You can change the %R period, toggle the Bollinger Bands on and off and change the Bollinger Band period.
MACD Signal with Williams %R ColoringA simple fused indicator of 2, 1) MACD signal lines made colouring when 2) Williams % R is in overbought or oversold. not my own coding, just took two readily available indicators and coded them together.
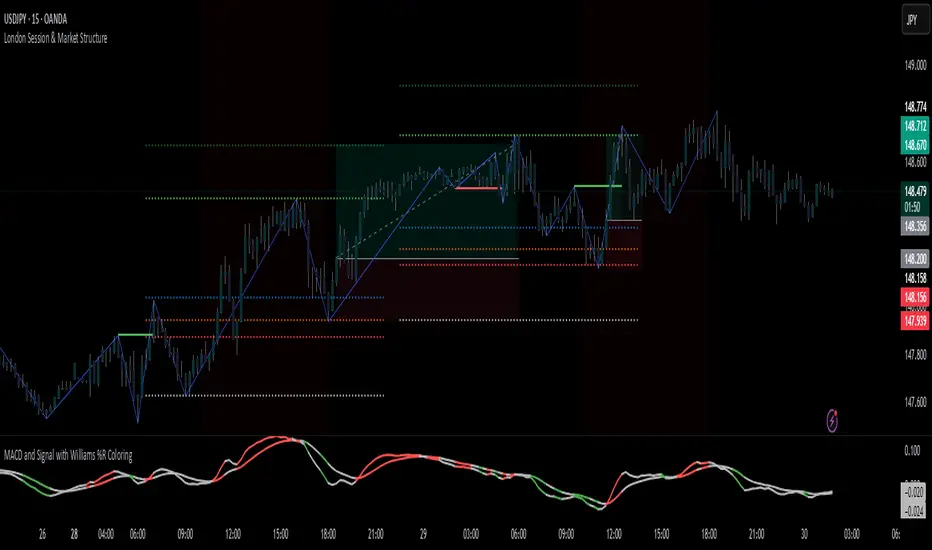
Jurik Smoothed Williams %R by jwammo12This is Williams %R that has been used using Jurik's method. This removes a lot of the chop and false signals of William's %R while adding only minimal lag.

Setup 9.4 - Larry Williams---IN-US---
Hi traders, this simple setup was created by the professional Trader Larry Willians.
This trade system is based on 9 EMA .
Setup EMA 9.3
1) Find a stock with 9 EMA uptrend and turns down, but the low of the candle which made turn go down can't be lose, 9 EMA can go down ONLY ONE candle.
2) Wait for 9 EMA go up in the next candle and mark the high.
3) If the price doesnt across the high, mark the next high.
4) Buy when the price cross the mark.
5) Stop-loss in the low of the marked candle.
--PT-BR---
Olá traders, setup universal, criado pelo famoso Trader Larry Williams , e divulgado pelo Trader Palex. Setup baseado na MME de 9 períodos.
Setup MME 9.4
1) Achar ativo com a MME9 esteja subindo; A MME9 vem subindo e vira para baixo, mas o candle que fez essa virada ocorrer não tem a mínima perdida e a MME9 volta a virar para cima no candle seguinte. Só pode ficar virada pra baixo 1 candle e logo no candle seguinte a média vira pra cima.
2) Marcamos a máxima do candle que fez a MME9 virar para cima e no seu rompimento temos a entrada na
ponta compradora.
3) Se a máxima não for rompida, marcar a próxima máxima;
4) Compra no rompimento dessa máxima (qualquer negócio acima dessa máxima);
5)Stop-loss na mínima do candle que fez a MME9 virar para baixo.
Bons trades a todos.