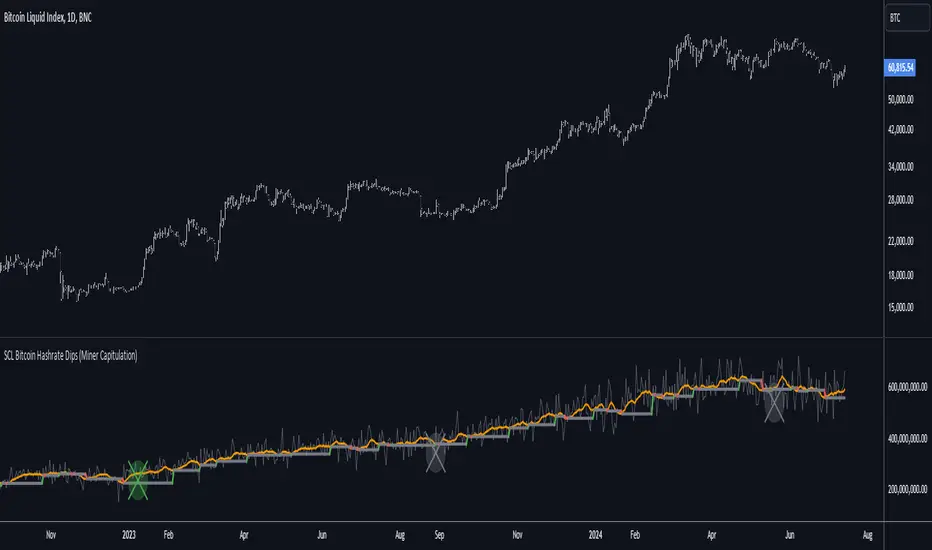
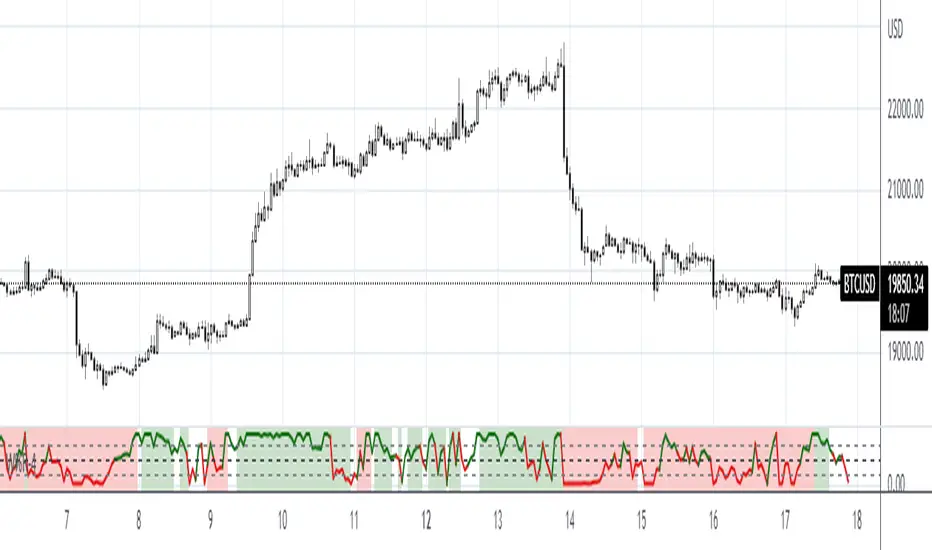
[SCL] Bitcoin Hashrate Dips (Miner Capitulation)Gives long-term buy signals for Bitcoin from dips and recoveries in the hashrate (the "miner capitulation" theory). It has an overlay and a standalone mode and is fully configurable. It uses Williams Lows and ATR instead of moving averages.
Features that might be interesting for Pinescripters:
+ Automatic (as far as is possible currently) adjustment of plots for overlay and standalone display modes.
+ A neat label function for debugging floats
+ Fully commented
+ The debug that I used to overcome problems in developing it is left in
+ Ideas for how to deal with a wildly oscillating and exponentially increasing data source
You need to run this indicator on the Bitcoin daily chart for it to make any sense. The best is a BTC/USD chart with a long history, such as BNC:BLX.
Cari dalam skrip untuk "williams"
2xIchimoku Cloud + 4xEMA + Williams FractalCopy+Pasted/edited the code from :
Moku
www.tradingview.com
EMA
www.tradingview.com
Fractal
www.tradingview.com
VIX BanditThis is a momentum indicator that identifies potential VIX bottoms by using seven configurable Williams %R oscillators simultaneously.
Green dots🟢appear below the bar when all %R series agree the VIX is extremely oversold.
Fuchsia dots🟣appear above the bar when VIX reverts to its long-term average (an EMA).
I hope this helps you spot moments of maximum optimism and trade the subsequent panic, somehow.


Williams %R I needed the %R code in one of my indicators and TradingVeiw have it hidden. So here is my attempt.
CM_Williams_Vix_Fix_V3_Upper_Text PlotsWilliams Vix Fix Text Plots! Alert Capable!
Use With Lower Indicator or as Single Indicator!
Has Text Plots For All Plot Types Lower Indicator Uses.
To Get Lower Indicator:
Info On Lower Indicator - Discussion:

Williams AC/AO ZonesPaints price bars green when AO+AC are both green, paints bars red when both are red, and paints bars grey when both are different. (IGNORE THE CHART DIDNT MEAN TO PUBLISH IT ON THIS CHART.. OPPS)

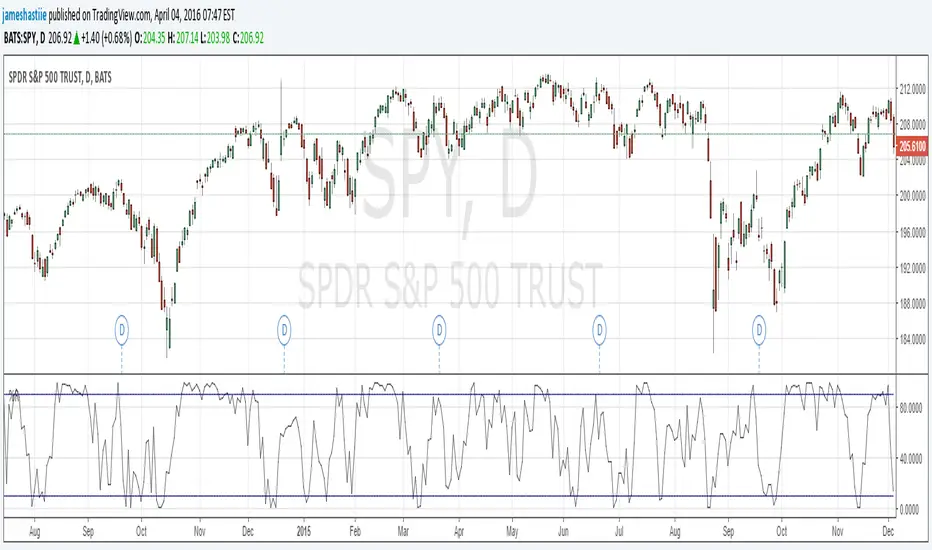
Williams %R StrategyThe Williams %R Strategy implemented in Pine Script™ is a trading system based on the Williams %R momentum oscillator. The Williams %R indicator, developed by Larry Williams in 1973, is designed to identify overbought and oversold conditions in a market, helping traders time their entries and exits effectively (Williams, 1979). This particular strategy aims to capitalize on short-term price reversals in the S&P 500 (SPY) by identifying extreme values in the Williams %R indicator and using them as trading signals.
Strategy Rules:
Entry Signal:
A long position is entered when the Williams %R value falls below -90, indicating an oversold condition. This threshold suggests that the market may be near a short-term bottom, and prices are likely to reverse or rebound in the short term (Murphy, 1999).
Exit Signal:
The long position is exited when:
The current close price is higher than the previous day’s high, or
The Williams %R indicator rises above -30, indicating that the market is no longer oversold and may be approaching an overbought condition (Wilder, 1978).
Technical Analysis and Rationale:
The Williams %R is a momentum oscillator that measures the level of the close relative to the high-low range over a specific period, providing insight into whether an asset is trading near its highs or lows. The indicator values range from -100 (most oversold) to 0 (most overbought). When the value falls below -90, it indicates an oversold condition where a reversal is likely (Achelis, 2000). This strategy uses this oversold threshold as a signal to initiate long positions, betting on mean reversion—an established principle in financial markets where prices tend to revert to their historical averages (Jegadeesh & Titman, 1993).
Optimization and Performance:
The strategy allows for an adjustable lookback period (between 2 and 25 days) to determine the range used in the Williams %R calculation. Empirical tests show that shorter lookback periods (e.g., 2 days) yield the most favorable outcomes, with profit factors exceeding 2. This finding aligns with studies suggesting that shorter timeframes can effectively capture short-term momentum reversals (Fama, 1970; Jegadeesh & Titman, 1993).
Scientific Context:
Mean Reversion Theory: The strategy’s core relies on mean reversion, which suggests that prices fluctuate around a mean or average value. Research shows that such strategies, particularly those using oscillators like Williams %R, can exploit these temporary deviations (Poterba & Summers, 1988).
Behavioral Finance: The overbought and oversold conditions identified by Williams %R align with psychological factors influencing trading behavior, such as herding and panic selling, which often create opportunities for price reversals (Shiller, 2003).
Conclusion:
This Williams %R-based strategy utilizes a well-established momentum oscillator to time entries and exits in the S&P 500. By targeting extreme oversold conditions and exiting when these conditions revert or exceed historical ranges, the strategy aims to capture short-term gains. Scientific evidence supports the effectiveness of short-term mean reversion strategies, particularly when using indicators sensitive to momentum shifts.
References:
Achelis, S. B. (2000). Technical Analysis from A to Z. McGraw Hill.
Fama, E. F. (1970). Efficient Capital Markets: A Review of Theory and Empirical Work. The Journal of Finance, 25(2), 383-417.
Jegadeesh, N., & Titman, S. (1993). Returns to Buying Winners and Selling Losers: Implications for Stock Market Efficiency. The Journal of Finance, 48(1), 65-91.
Murphy, J. J. (1999). Technical Analysis of the Financial Markets: A Comprehensive Guide to Trading Methods and Applications. New York Institute of Finance.
Poterba, J. M., & Summers, L. H. (1988). Mean Reversion in Stock Prices: Evidence and Implications. Journal of Financial Economics, 22(1), 27-59.
Shiller, R. J. (2003). From Efficient Markets Theory to Behavioral Finance. Journal of Economic Perspectives, 17(1), 83-104.
Williams, L. (1979). How I Made One Million Dollars… Last Year… Trading Commodities. Windsor Books.
Wilder, J. W. (1978). New Concepts in Technical Trading Systems. Trend Research.
This explanation provides a scientific and evidence-based perspective on the Williams %R trading strategy, aligning it with fundamental principles in technical analysis and behavioral finance.

Williams %R IntensityOverview
"Williams %R Intensity" is a unique indicator that combines the classic Williams %R with a dynamic intensity-based visualization. This indicator helps traders identify overbought and oversold conditions with enhanced clarity while also predicting potential future crossovers using smoothed slope calculations. It is tailored for traders seeking a more nuanced approach to trend detection and momentum analysis.
Features and How It Works
Core Calculation:
Williams %R : Measures the current closing price relative to the highest high and lowest low over a user-defined length (default: 14).
Exponential Moving Average (EMA) : Smoothens the %R values for better trend tracking (default length: 14).
Overbought/Oversold Zones :
Upper and lower threshold levels are set at -20 (overbought) and -80 (oversold), making it easier to identify extreme conditions.
Intensity Visualization:
The intensity is calculated based on the absolute distance between Williams %R and its EMA.
The closer the value is to extreme levels, the more pronounced the visual intensity, capping at 90% transparency.
Overbought conditions are highlighted in red; oversold conditions in teal.
Crossover Signals:
Bullish Cross: When Williams %R crosses above its EMA in the oversold zone.
Bearish Cross: When Williams %R crosses below its EMA in the overbought zone.
The background color changes (lime for bullish, red for bearish) to highlight these critical moments when enabled via the "Show Cross & Predicted Cross Signal" option.
Future Cross Prediction:
Uses the smoothed slope of %R to estimate future values over a customizable number of steps.
Predicts potential bullish or bearish crosses based on the interaction between the predicted Williams %R and EMA.
Light green and light red background colors indicate predicted bullish and bearish crosses, respectively.
How to Use
Trend Detection: Use the Williams %R and its EMA to identify ongoing trends and confirm their strength.
Overbought/Oversold Analysis: Pay attention to crosses in extreme zones (-20 and -80) for potential reversals.
Intensity-Based Filtering: The intensity visualization helps to focus on the most significant conditions, reducing noise.
Cross Prediction: Enable "Show Cross & Predicted Cross Signal" to anticipate future turning points and plan trades proactively.
Example Applications
Scalping: Monitor rapid crossovers in lower timeframes for quick entries and exits.
Swing Trading: Use the overbought/oversold zones and cross predictions to identify longer-term reversal opportunities.
Risk Management: The intensity visualization can be used to filter out weak signals, ensuring higher-quality trade setups.
Chart Information
For clarity and compliance with publishing standards:
The chart should display the full symbol, timeframe, and the script name ("Williams %R Intensity").
Ensure the indicator is visible and properly configured for the chart.

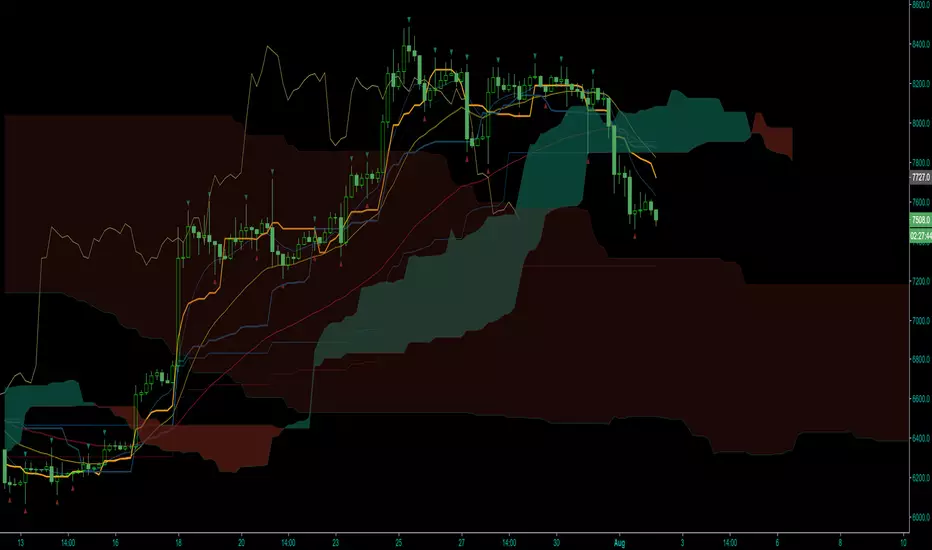
Williams Vix Fix OHLC candles plot indicator (Tartigradia)OHLC candles plot of the Williams VixFix indicator, which allows to draw trend lines.
Williams VixFix is a realized volatility indicator developed by Larry Williams, and can help in finding market bottoms.
Indeed, as Williams describe in his paper, markets tend to find the lowest prices during times of highest volatility, which usually accompany times of highest fear. The VixFix is calculated as how much the current low price statistically deviates from the maximum within a given look-back period.
The Williams VixFix indicator is usually presented as a curve or histogram. The novelty of this indicator is to present the data as a OHLC candles plot: whereas the original Williams VixFix calculation only involves the close value, we here use the open, high and low values as well. This led to some mathematical challenges because some of these calculations led to absurd values, so workarounds had to be found, but in the end I think the result was worth it, it reproduces the VIX chart quite well.
A great additional value of the OHLC chart is that it shows not just the close value, but all the values during the session: open, high and low in addition to close. This allows to draw trend lines and can provide additional information on momentum and sentiment. In addition, other indicators can be used on it, as if it was a price chart, such as RSI indicators (see RSI+ (alt) indicator for example).
For more information on the Vix Fix, which is a strategy published under public domain:
The VIX Fix, Larry Williams, Active Trader magazine, December 2007, web.archive.org
Fixing the VIX: An Indicator to Beat Fear, Amber Hestla-Barnhart, Journal of Technical Analysis, March 13, 2015, ssrn.com
Replicating the CBOE VIX using a synthetic volatility index trading algorithm, Dayne Cary and Gary van Vuuren, Cogent Economics & Finance, Volume 7, 2019, Issue 1, doi.org
This indicator includes only the Williams VixFix as an OHLC candles or bars plot, and price / vixfix candles plot, as well as the typical vixfix histogram. Indeed, it is much more practical for unbounded range indicators to be plotted in their own separate panel, hence why this indicator is released separately, so that it can work and be scaled adequately out of the box.
Note that the there are however no bottom buy signals. For a more complete indicator, which also includes the OHLC candles plots present here, but also bottom signals and Inverse VixFix (top signals), see:
Set Index symbol to SPX, and index_current = false, and timeframe Weekly, to reproduce the original VIX as close as possible by the VIXFIX (use the Add Symbol option, because you want to plot CBOE:VIX on the same timeframe as the current chart, which may include extended session / weekends). With the Weekly timeframe, off days / extended session days should not change much, but with lower timeframes this is important, because nights and weekends can change how the graph appears and seemingly make them different because of timing misalignment when in reality they are not when properly aligned.
Williams %R Cross Strategy with 200 MA Filter
1. The script is a trading strategy based on the Williams %R indicator and a 200-period moving average (MA) filter.
2. The user can input the length of the Williams %R indicator (`wrLength`), the threshold for %R crossing (`crossPips`), the take profit level in pips (`takeProfitPips`), and the stop loss level in pips (`stopLossPips`).
3. The script calculates the Williams %R using the `ta.highest` and `ta.lowest` functions to find the highest high and lowest low over the specified length (`wrLength`).
4. It also calculates a 200-period simple moving average (`ma200`) using the `ta.sma` function.
5. The entry conditions are defined as follows:
- For a long entry, it checks if the Williams %R crosses above the -50 line by a threshold of `crossPips` and if the close price is above the 200-period MA.
- For a short entry, it checks if the Williams %R crosses below the -50 line by a threshold of `crossPips` and if the close price is below the 200-period MA.
6. The exit conditions are defined as follows:
- For a long position, it checks if the close price reaches the take profit level (defined as the average entry price plus `takeProfitPips` in pips) or the stop loss level (defined as the average entry price minus `stopLossPips` in pips).
- For a short position, it checks if the close price reaches the take profit level (defined as the average entry price minus `takeProfitPips` in pips) or the stop loss level (defined as the average entry price plus `stopLossPips` in pips).
7. The script uses the `strategy.entry` function to place long and short orders when the respective entry conditions are met.
8. It uses the `strategy.close` function to close the long and short positions when the respective exit conditions are met.
The script allows you to customize the parameters such as the length of Williams %R, the crossing threshold, take profit and stop loss levels, and the moving average period to suit your trading preferences.

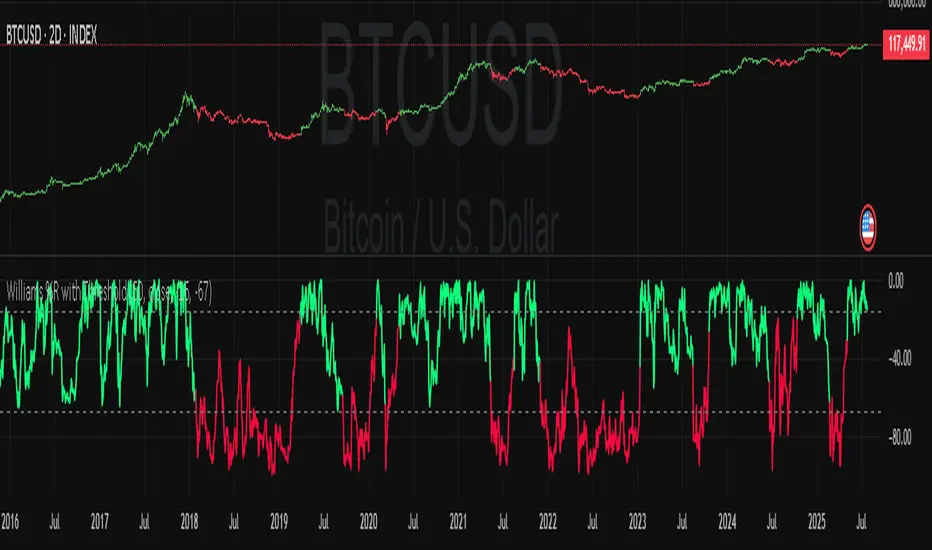
Williams Percent Range with ThresholdEnhance your trading analysis with the "Williams Percent Range with Threshold" indicator, a powerful modification of the classic Williams %R oscillator. This custom version introduces customizable uptrend and downtrend thresholds, combined with dynamic candlestick coloring to visually highlight market trends. Originally designed to identify overbought and oversold conditions, this script takes it a step further by allowing traders to define specific threshold levels for trend detection, making it a versatile tool for momentum and trend-following strategies.
Key Features:
Customizable Thresholds: Set your own uptrend (default: -16) and downtrend (default: -67) thresholds to adapt the indicator to your trading style.
Dynamic Candlestick Coloring: Candles turn green during uptrends, red during downtrends, and gray in neutral conditions, providing an intuitive visual cue directly on the price chart.
Flexible Length: Adjust the lookback period (default: 50) to fine-tune sensitivity.
Overlay Design: Integrates seamlessly with your price chart, enhancing readability without clutter.
How It Works:
The Williams %R calculates the current closing price's position relative to the highest and lowest prices over a specified period, expressed as a percentage between -100 and 0. This version adds trend detection based on user-defined thresholds, with candlestick colors reflecting the trend state. The indicator plots the %R line with color changes (green for uptrend, red for downtrend) and includes dashed lines for the custom thresholds.
Usage Tips:
Use the uptrend threshold (-16 by default) to identify potential buying opportunities when %R exceeds this level.
Apply the downtrend threshold (-67 by default) to spot selling opportunities when %R falls below.
Combine with other indicators (e.g., moving averages or support/resistance levels) for confirmation signals.
Adjust the length and thresholds based on the asset's volatility and your trading timeframe.
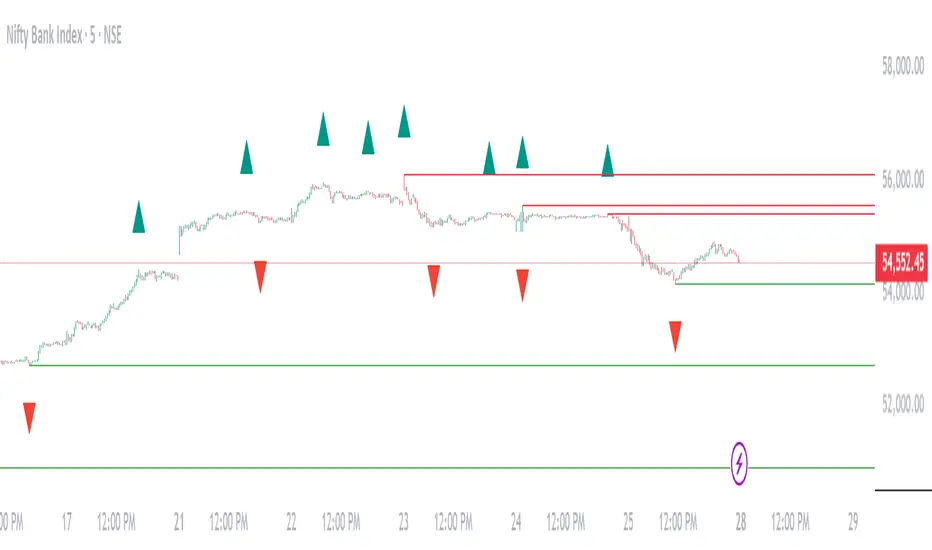
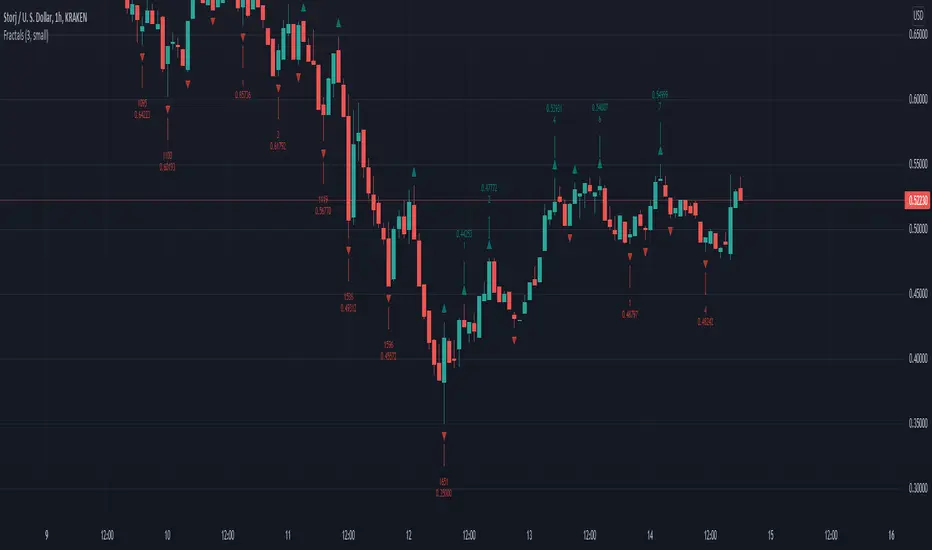
Williams Fractals Dynamic Horizontal LinesWilliams Fractals with Dynamic Horizontal Lines
Overview
This script identifies Williams Fractals (support and resistance points) on any chart and automatically draws horizontal lines at those fractal levels.
The lines extend right and disappear when price breaks them — giving a clean and real-time view of key support and resistance levels.
Features
Detects upward fractals (potential resistances).
Detects downward fractals (potential supports).
Draws horizontal lines at each fractal point.
Automatically deletes a line when:
Price closes above a resistance.
Price closes below a support.
Clean and lightweight — minimal performance impact.
Inputs
Setting Description Default
Periods (n) Number of candles on each side required to confirm a fractal (minimum 2). 2
How It Works
Fractal Detection:
An up fractal is confirmed when a candle has the highest high compared to its neighbors.
A down fractal is confirmed when a candle has the lowest low compared to its neighbors.
Custom logic supports different "ties" — not just strict greater-than or less-than comparisons.
Drawing Lines:
When an up fractal is detected → a red horizontal resistance line is drawn.
When a down fractal is detected → a green horizontal support line is drawn.
Lines are drawn starting at the fractal candle and extend right across the chart.
Dynamic Line Deletion:
Every new candle is checked:
If high > resistance line → delete that resistance line.
If low < support line → delete that support line.
Only unbroken lines are kept on the chart, providing live, updated support/resistance zones.
Visual Elements
Up Fractal: 🡅 Triangular marker (teal color) above the fractal candle.
Down Fractal: 🡇 Triangular marker (red color) below the fractal candle.
Resistance Line: Red horizontal line.
Support Line: Green horizontal line.
Technical Details
Version: Pine Script v6
Arrays Used:
To store and manage active lines (line arrays).
To track the price associated with each line (float arrays).
Error Handling:
Backward iteration is handled using a while loop instead of a for loop to comply with Pine Script restrictions.
Offset Handling:
Fractal markers are plotted with an offset of -n bars for visual alignment.
Possible Enhancements (Future Ideas)
Sensitivity Settings: Allow a small margin (buffer) to define breakouts.
Extend Options: Let users choose between extending "infinite" or "limited" bars.
Custom Alerts: Generate alerts when fractal levels are broken.
Multi-timeframe Support: Detect fractals from higher timeframes on lower timeframe charts.
Example Usage
Swing Trading:
Use the fractal lines to identify and react to key breakouts or breakdowns dynamically.
Intraday Trading:
Spot live support/resistance on smaller timeframes for quick trades.
Trend Reversal Spotting:
Notice when a major fractal level is broken, possibly indicating trend changes.
Example Visual — Williams Fractals Dynamic Lines
Price Chart View:
What This Diagram Shows:
▲ Up Fractals:
Form resistance lines.
Line extends until price breaks above it.
▼ Down Fractals:
Form support lines.
Line extends until price breaks below it.
Lines are removed from the chart as soon as broken.
📈 Real Chart Example
Here's a rough idea how it will look live on your TradingView chart:
Feature Visual
Up Fractal 🔺 Green triangle above bar
Resistance Line ➖ Horizontal red line across the chart
Down Fractal 🔻 Red triangle below bar
Support Line ➖ Horizontal green line across the chart
Line Break 🚫 Line disappears when price crosses
Williams Percent Range with Trendlines and BreakoutsHere is my "Williams Percent Range with Trendlines and Breakouts" indicator, a simple yet powerful tool for traders. This indicator combines the classic Williams %R oscillator, which helps identify overbought and oversold levels, with added trendlines for easier trend analysis at a glance.
It's designed to make spotting potential breakouts easier by drawing attention to significant price movements. With customizable settings for the Williams %R period and trendline sensitivity, it's a flexible tool for various symbols and trading styles.
Whether you're looking to refine your trading strategy or just need a clearer view of market trends, this indicator should offer a straight forward approach to hopefully enhance your trading decisions.
Disclaimer: This indicator is intended for educational and informational purposes only. Always conduct your own research and analysis before making trading decisions.

Williams %R + Bollinger %B📊 Williams %R + Bollinger %B Indicator
This indicator blends two complementary oscillators to provide a clearer view of market momentum, volatility, and extreme zones:
🔹 Williams %R (W%R):
Measures the price’s position within its recent range, helping identify overbought/oversold conditions and potential reversal points. It reacts quickly to market shifts, making it useful for spotting short-term exhaustion.
🔹 Bollinger %B (BB%):
Shows where the price sits relative to the Bollinger Bands, highlighting volatility expansions, contractions, and pressure around the bands. It helps confirm breakouts, squeezes, and volatility-driven moves.
🎯 What This Combined Indicator Offers
Dual insight: Momentum (W%R) + volatility (BB%).
Higher precision: Identifies areas where both range extremes and volatility extremes align.
Better timing: Provides clearer entry/exit confirmation based on price behavior relative to range and volatility.
🧠 Suggested Use
Look for confluences, such as W%R showing oversold while BB% signals a lower-band rejection or squeeze.
Spot true breakouts when BB% expands while W%R exits extreme zones.
Filter out noise by analyzing the relationship between both oscillators.

Williams Fractals Tiny IconsA version of Williams Fractals but the script has been altered to make the icons smaller. Use these for trailing stop loss, adding to positions, or entering a position late.
Williams AD + MA“I’ve added an MA to the Williams Accumulation/Distribution (AD) indicator. You can use it to infer potential trend inflection points and to assess the persistence of the trend.”

Williams Fractals with Buy/Sell Signals🧠 Concept:
This indicator is based on the concept of fractal swing highs and lows, commonly used in Bill Williams’ trading methods. A fractal forms when a candle’s high or low is higher/lower than a set number of candles on both sides. This structure helps identify local market turning points.
⚙️ Inputs:
Fractal Sensitivity (swingSensitivity):
Number of candles required on each side of the central bar to validate a fractal.
For example, if set to 2, a swing high is detected when a bar’s high is higher than the previous 2 bars and the next 2 bars.
✅ Features:
Fractal Detection:
Plots white triangles above swing highs (down fractals).
Plots white triangles below swing lows (up fractals).
Buy/Sell Signals:
Buy Signal: Triggered when the candle closes above the most recent down fractal.
Sell Signal: Triggered when the candle closes below the most recent up fractal.
Signals alternate — a Buy must follow a Sell and vice versa to reduce noise.
Signal Labels:
"BUY" label appears below the candle in green.
"SELL" label appears above the candle in red.
Alerts:
Real-time alerts are available for both Buy and Sell signals via alertcondition().
📌 Use Case:
This indicator can help you:
Detect short-term reversals.
Confirm breakouts or structure shifts.
Time entries with clear logic based on price action.
Williams %R (v.4)This is an upgrade and an update of my Williams %R indicator modification.
As before this implementation is enhanced with CCI in the form of background colors. These colors can be used as a confirmation signal and indication of a current trend. Thee also can be employed in deciding when to enter/exit the market.
Besides, added is a scaling function and Lower/Upper Bound inputs.
Williams Divergent Bar (First Wise Man)Based on Bill Williams' First Wise Man. Bull candles are marked with purple and Bear candles with blue.
Requirements:
- Candle height must be greater than ATR (filter out tiny Doji candles)
- Open and Close must be beyond the HL2 (midpoint) for either Bull or Bear scenarios
- Candle HL2 must be more than 1x ATR from the Alligator Jaw (13-period SMMA, pushed forward 8 periods). The dark blue line in my example.
- ATR is calculated using a 13-period RMA of the true range
Williams Fractals with BreaksThis is a Bill Williams fractal indicator with breaks.
I was turned onto fractals and the importance of their breaks by ChaosTrader63.
I know several version of this indicator have been done.
I chose this as a first project because of it's simplicity , but also because of the poor code quality of some other versions I looked at.
This is the first draft that successfully met my three criteria:
* Must identify all fractals, including simultaneous up/down fractals.
* Must identify fractal breaks with a clear indicator.
* Must provide information on how many fractals
For the first bullet, I wanted to provide a more concise modern version than the boolean logic composition I was seeing in other examples.
The later two required tracking the past which was not present in the other versions I looked at.
Code here can be improved for more uses and better integration, but it is functional and elegant enough to use.
Thanks for checking it out.
Jolly Wizard
Williams Fractals with alerts ABCAll the original Williams Fractals algorithm but with a useful way to set up alerts.

Williams Alligator Trend FilterI've edited the normal Bill Williams Alligator indicator to have a color fill that indicates the trend. There is a percentage range filter which checks if the 2 outer lines are enough far away from eachother to indicate a trend. The indicator also checks if the lines are below or above eachother in the right order as a last check to confirm Trend
