CM_Williams_Vix_Fix - Market Top and Bottom with multi-timeframeThis is a modification of CM_Williams_Vix_Fix indicator to include both market tops and bottoms with multi-timeframe support. The original indicator only finds market bottoms.
All credits go to the original author ChrisMoody.
Original script link
Working:
The histogram above 0 signifies the trend of market going UP and the histogram below 0 signifies the trend of market going DOWN.
The histogram bar is calculated using "LookBack Period Standard Deviation High" number of candles. A threshold is calculated using bollinger bands and based on percentile of "Look Back Period Percentile High" number of candles.
If the histogram bar above 0 crosses the up threshold then we have market top which is signified by histogram bar having the color green. If the histogram bar below 0 crosses the down threshold then we have market bottom which is signified by histogram bar having the color red.
The market tops and bottoms can also be calculated across multiple timeframes.
Sample usage:
Suppose the market is in an uptrend and the indicator displays red market bottom bar, this might be an indication that the market has reached the end of a pullback. We can use additional indicators like stochastic or rsi to get additional confluence.
This indicator does not repaint but you need to wait for the candle to close.
Cari dalam skrip untuk "williams"

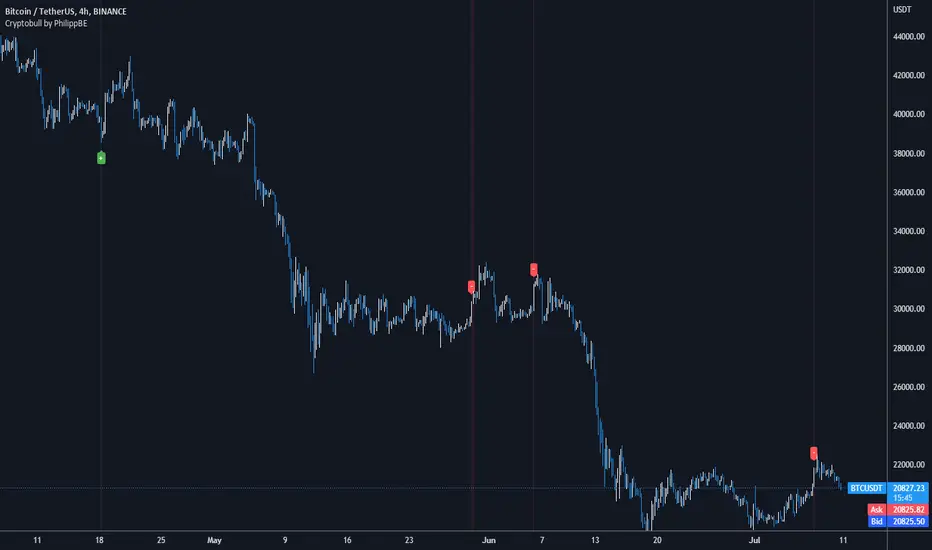
Cryptobull | Long / Short IndicatorCryptobull is a indicator based on the Williams R and Bollinger Band to find Long / Short entries (together with your strategy).
!!! The indicator is not working in every market situation -> so i recommend to add the indicator to your existing strategy !!!
Designed for:
->15m Chart
->5m Chart
->Crypto
->(Stocks)
I recommend using this indicator with Price Action or your own strategy to enter trades.
Haos Visual @PuppyTherapyToday I am bringing to you my interpretation of the Haos Visual Oscillator with a trend which is derived from two Williams R% indicators smoothed by T3. I have been inspired by this idea in the following post.
www.prorealcode.com
Is a pretty unique indicator indeed that due to its smoothing provide nice entries. Your Entry signal is when the histogram, which is the longer term willy is green that signalizes strong bullish momentum. If you then receive a momentum change which is the dot on the short willy or you breach the -30 to -40 area it is a strong buy signal.
Also, this is my first V4 Script thanks to Tradingview to adding to the platform :)

Klinger Volume Oscillator (KVO) Backtest The Klinger Oscillator (KO) was developed by Stephen J. Klinger. Learning
from prior research on volume by such well-known technicians as Joseph Granville,
Larry Williams, and Marc Chaikin, Mr. Klinger set out to develop a volume-based
indicator to help in both short- and long-term analysis.
The KO was developed with two seemingly opposite goals in mind: to be sensitive
enough to signal short-term tops and bottoms, yet accurate enough to reflect the
long-term flow of money into and out of a security.
The KO is based on the following tenets:
Price range (i.e. High - Low) is a measure of movement and volume is the force behind
the movement. The sum of High + Low + Close defines a trend. Accumulation occurs when
today's sum is greater than the previous day's. Conversely, distribution occurs when
today's sum is less than the previous day's. When the sums are equal, the existing trend
is maintained.
Volume produces continuous intra-day changes in price reflecting buying and selling pressure.
The KO quantifies the difference between the number of shares being accumulated and distributed
each day as "volume force". A strong, rising volume force should accompany an uptrend and then
gradually contract over time during the latter stages of the uptrend and the early stages of
the following downtrend. This should be followed by a rising volume force reflecting some
accumulation before a bottom develops.
You can change long to short in the Input Settings
Please, use it only for learning or paper trading.

Klinger Volume Oscillator (KVO) Strategy The Klinger Oscillator (KO) was developed by Stephen J. Klinger. Learning
from prior research on volume by such well-known technicians as Joseph Granville,
Larry Williams, and Marc Chaikin, Mr. Klinger set out to develop a volume-based
indicator to help in both short- and long-term analysis.
The KO was developed with two seemingly opposite goals in mind: to be sensitive
enough to signal short-term tops and bottoms, yet accurate enough to reflect the
long-term flow of money into and out of a security.
The KO is based on the following tenets:
Price range (i.e. High - Low) is a measure of movement and volume is the force behind
the movement. The sum of High + Low + Close defines a trend. Accumulation occurs when
today's sum is greater than the previous day's. Conversely, distribution occurs when
today's sum is less than the previous day's. When the sums are equal, the existing trend
is maintained.
Volume produces continuous intra-day changes in price reflecting buying and selling pressure.
The KO quantifies the difference between the number of shares being accumulated and distributed
each day as "volume force". A strong, rising volume force should accompany an uptrend and then
gradually contract over time during the latter stages of the uptrend and the early stages of
the following downtrend. This should be followed by a rising volume force reflecting some
accumulation before a bottom develops.
WARNING:
This script to change bars colors.

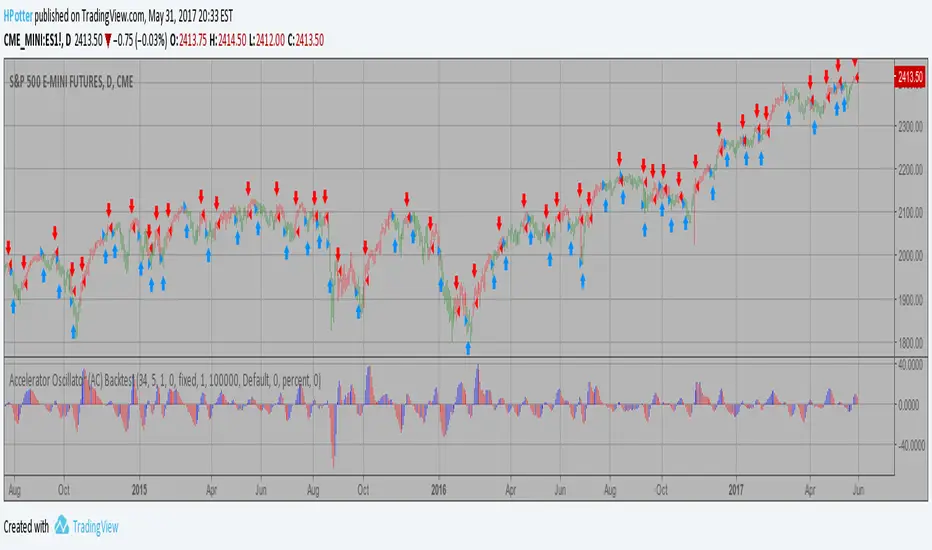
Accelerator Oscillator (AC) Backtest The Accelerator Oscillator has been developed by Bill Williams
as the development of the Awesome Oscillator. It represents the
difference between the Awesome Oscillator and the 5-period moving
average, and as such it shows the speed of change of the Awesome
Oscillator, which can be useful to find trend reversals before the
Awesome Oscillator does.
You can change long to short in the Input Settings
Please, use it only for learning or paper trading. Do not for real trading
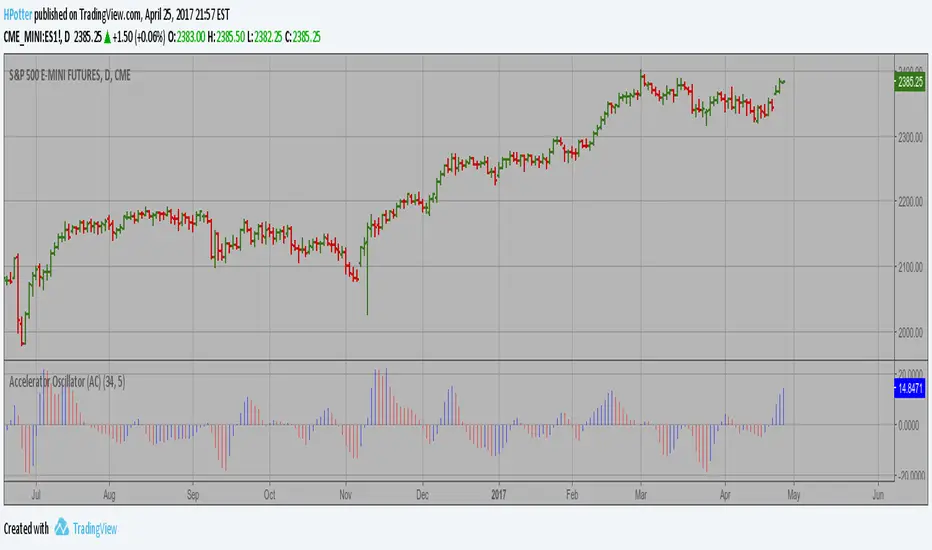
Accelerator Oscillator (AC) The Accelerator Oscillator has been developed by Bill Williams
as the development of the Awesome Oscillator. It represents the
difference between the Awesome Oscillator and the 5-period moving
average, and as such it shows the speed of change of the Awesome
Oscillator, which can be useful to find trend reversals before the
Awesome Oscillator does.
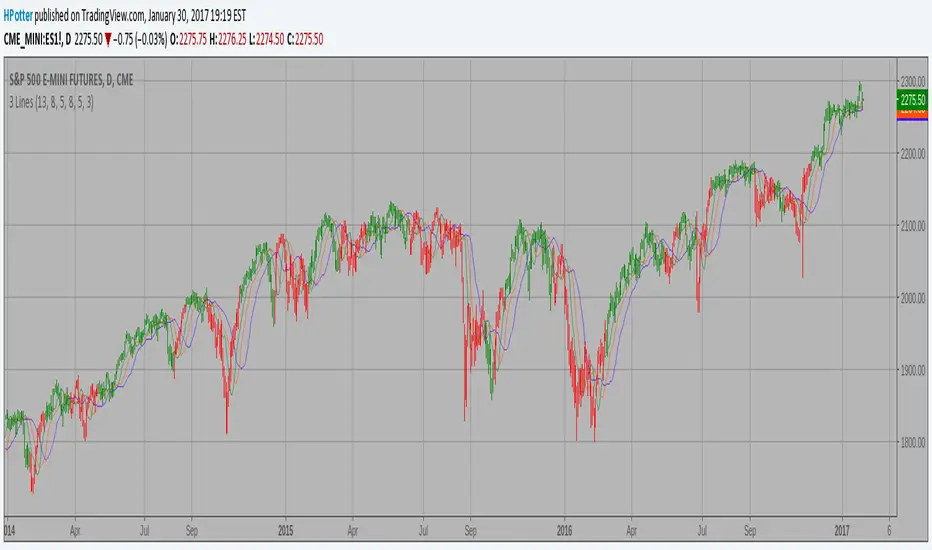
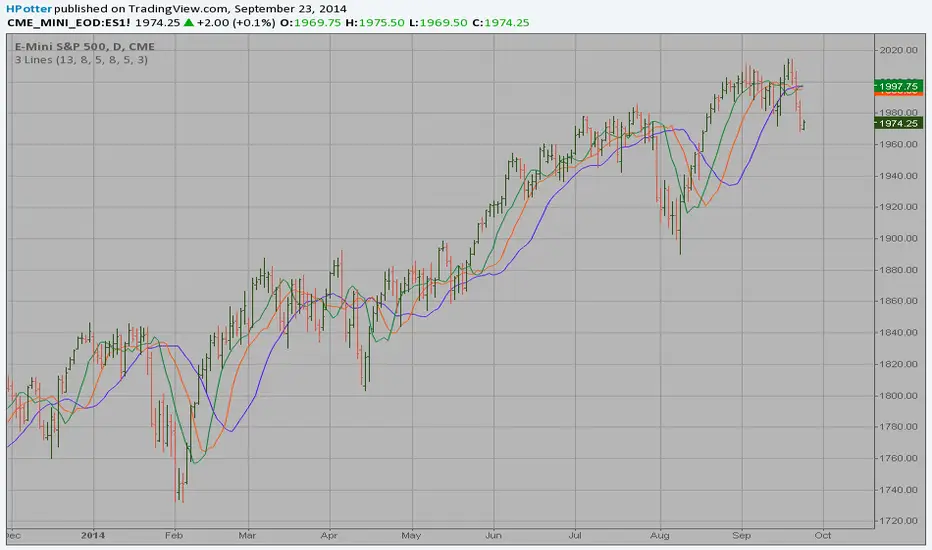
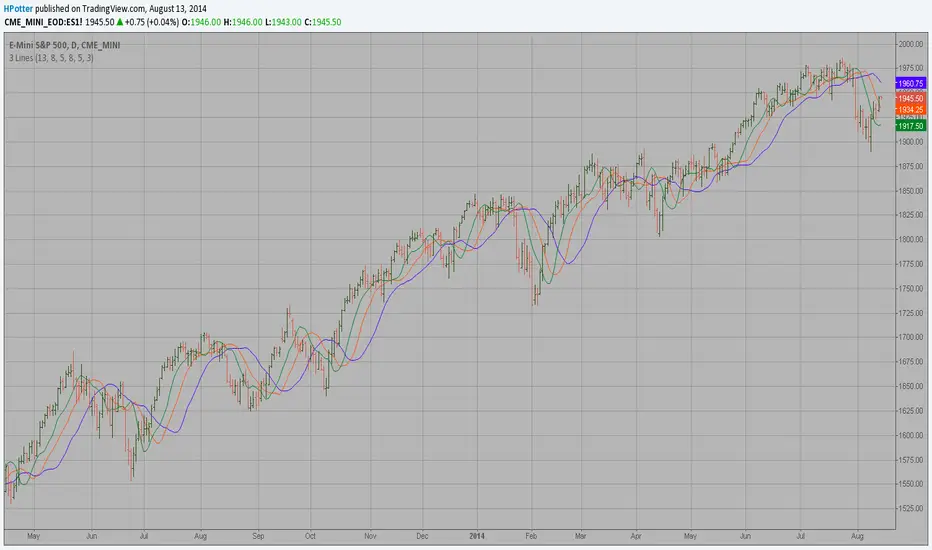
Bill Williams Averages. 3Lines Backtest This indicator calculates 3 Moving Averages for default values of
13, 8 and 5 days, with displacement 8, 5 and 3 days: Median Price (High+Low/2).
The most popular method of interpreting a moving average is to compare
the relationship between a moving average of the security's price with
the security's price itself (or between several moving averages).

Bill Williams Averages. 3Lines Strategy This indicator calculates 3 Moving Averages for default values of
13, 8 and 5 days, with displacement 8, 5 and 3 days: Median Price (High+Low/2).
The most popular method of interpreting a moving average is to compare
the relationship between a moving average of the security's price with
the security's price itself (or between several moving averages).
Bill Williams Averages SMMA This indicator calculates 3 Smoothed moving average for default values of
13, 8 and 5 days, with displacement 8, 5 and 3 days.
The most popular method of interpreting a moving average is to compare
the relationship between a moving average of the security's price with
the security's price itself (or between several moving averages).
Bill Williams Averages This indicator calculates 3 Moving Averages for default values of
13, 8 and 5 days, with displacement 8, 5 and 3 days: Median Price (High+Low/2).
The most popular method of interpreting a moving average is to compare
the relationship between a moving average of the security's price with
the security's price itself (or between several moving averages).
Gator OscillatorThis is Bill Williams' Gator Oscillator
It's purpose is to easily show the varying distance between the lines of the Alligator indicator.
The lower part of the oscillator is the distance between the red and green lines.
The upper part of the oscillator is the distance between the red and blue lines.
A value greater than the last results in a green bar; less than the last results in a red bar.
In a bear or a bull trend, green indicates that it is still getting stronger, red that it is weakening either temporarily or permanently.

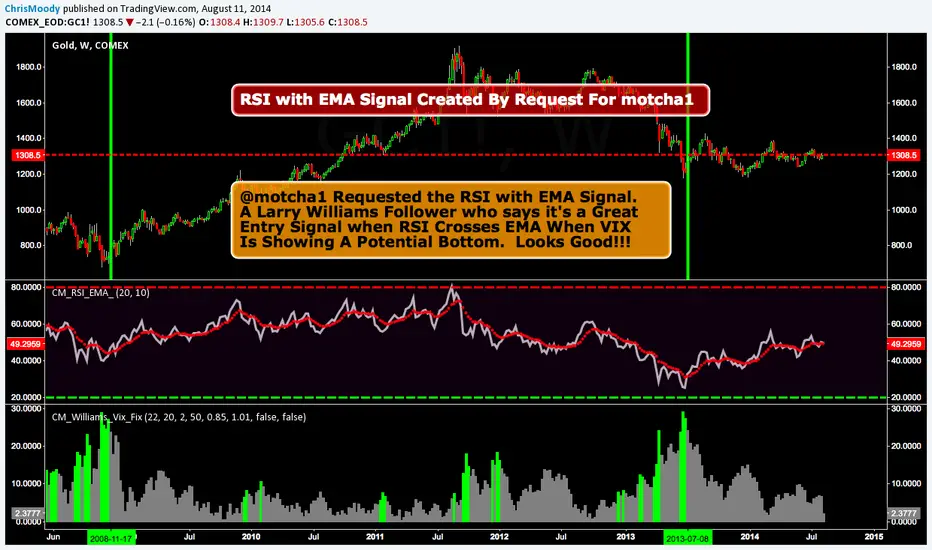
CM_RSI Plus EMARSI with EMA Signal Created By Request For @motcha1
@motcha1 Requested the RSI with EMA Signal.
A Larry Williams Follower who says it's a Great
Entry Signal when RSI Crosses EMA When VIX
Is Showing A Potential Bottom. Looks Good!!!
Link to Lower Indicator CM_Williams_Vix_Fix
Moonhub IndexMoonhub Index combines several popular technical indicators to create an aggregated index that aims to give a clearer overall picture of the market. The index takes into account the current market condition (trending, ranging, or volatile) to adjust its calculations accordingly.
The indicators used in this composite index are:
Hull Moving Average (HMA)
Fisher Transform (FT)
Williams Alligator
Moving Average Convergence Divergence (MACD)
Average True Range (ATR)
On-Balance Volume (OBV)
Money Flow Index (MFI)
Accumulation/Distribution (AD)
Pivot Points
True Strength Index (TSI)
Volume-Weighted Average Price (VWAP)
The script calculates the values of each indicator and then normalizes and weighs them according to predefined weights. The composite index is formed by summing the weighted values of each indicator. The final Moon Index is plotted on the chart, along with several other related lines like the exponential moving averages (EMA) and simple moving averages (SMA) of the index.
This custom index can be used by traders to get a more comprehensive view of the market and make better-informed trading decisions based on the combined insights of multiple indicators.

Typical Price Difference - TPD © with reversal zones and signalsv1.0 NOTE: The maths have been tested only for BTC and weekly time frame.
This is a concept that I came through after long long hours of VWAP trading and scalping.
The idea is pretty simple:
1) Typical Price is calculated by (h+l+c) / 3. If we take this price and adjust it to volume we get the VWAP value. The difference between this value and the close value, i call it " Typical Price Difference - TPD ".
2) We get the Historical Volatility as calculated by TradingView script and we add it up to TPD and divide it by two (average). This is what I call " The Source - TS ".
3) We apply the CCI formula to TS .
4) We calculate the Rate of Change (roc) of the CCI formula.
5) We apply the VIX FIX of Larry Williams (script used is from ChrisMoody - CM_Williams_Vix_Fix Finds Market Bottoms) *brilliant script!!!
How to use it:
a) When the (3) is over the TPD we have a bullish bias (green area). When it's under we have a bearish bias (red area).
b) If the (1) value goes over or under a certain value (CAUTION!!! it varies in different assets or timeframes) we get a Reversal Zone (RZ). Red/Green background.
c) If we are in a RZ and the VIX FIX gives a strong value (look for green bars in histogram) and roc (4) goes in the opposite direction, we get a reversal signal that works for the next week(s).
I applied this to BTC on a weekly time frame and after some corrections, it gives pretty good reversal zones and signals. Especially bottoms. Also look for divergences in the zones/signals.
As I said I have tested and confirmed it only on BTC/weekly. I need more time with the maths and pine to automatically adjust it to other time frames. You can play with it in different assets or time frames to find best settings by hand.
Feel free to share your thoughts or ideas on this.
P.S. I realy realy realy try to remember when or how or why I came up with the idea to combine typical price with historical volatility and CCI. I can't! It doesn't make any sense LOL

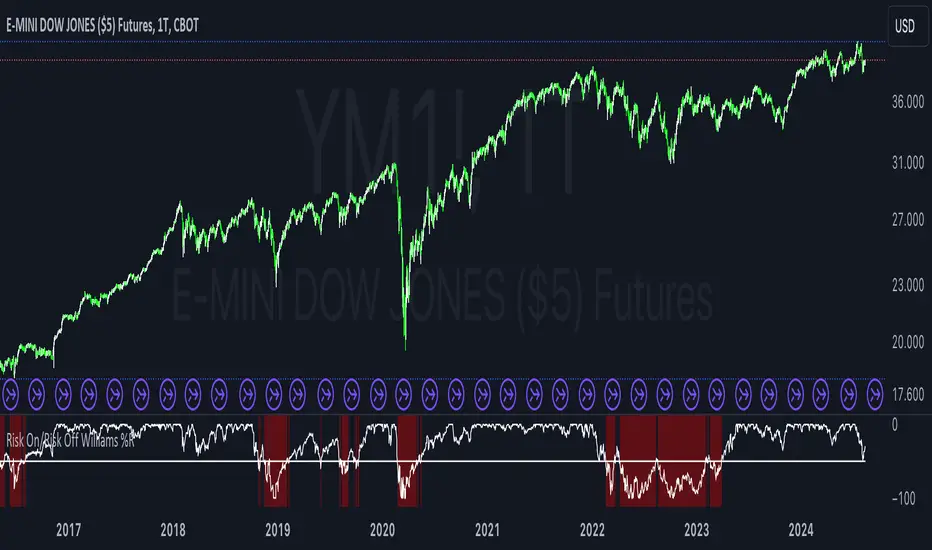
Risk On/Risk Off Williams %RThe Risk On/Risk Off Williams %R indicator is a technical analysis tool designed to gauge market sentiment by comparing the performance of risk-on and risk-off assets. This indicator combines the Williams %R, a momentum oscillator, with a composite index derived from various financial assets to determine the prevailing market risk sentiment.
Components:
Risk-On Assets: These are typically more volatile and are expected to perform well during bullish market conditions. The indicator uses the following risk-on assets:
SPY (S&P 500 ETF)
QQQ (Nasdaq-100 ETF)
HYG (High-Yield Corporate Bond ETF)
XLF (Financial Select Sector SPDR Fund)
XLK (Technology Select Sector SPDR Fund)
Risk-Off Assets: These are generally considered safer investments and are expected to outperform during bearish market conditions. The indicator includes:
TLT (iShares 20+ Year Treasury Bond ETF)
GLD (SPDR Gold Trust)
DXY (U.S. Dollar Index)
IEF (iShares 7-10 Year Treasury Bond ETF)
XLU (Utilities Select Sector SPDR Fund)
Calculation:
Risk-On Index: The average closing price of the risk-on assets.
Risk-Off Index: The average closing price of the risk-off assets.
The composite index is computed as:
Composite Index=Risk On Index−Risk Off Index
Composite Index=Risk On Index−Risk Off Index
Williams %R: This momentum oscillator measures the current price relative to the high-low range over a specified period. It is calculated as:
\text{Williams %R} = \frac{\text{Highest High} - \text{Composite Index}}{\text{Highest High} - \text{Lowest Low}} \times -100
where "Highest High" and "Lowest Low" are the highest and lowest values of the composite index over the lookback period.
Usage:
Williams %R: A momentum oscillator that ranges from -100 to 0. Values above -50 suggest bullish conditions, while values below -50 indicate bearish conditions.
Background Color: The background color of the chart changes based on the Williams %R relative to a predefined threshold level:
Green background: When Williams %R is above the threshold level, indicating a bullish sentiment.
Red background: When Williams %R is below the threshold level, indicating a bearish sentiment.
Purpose:
The indicator is designed to provide a visual representation of market sentiment by comparing the performance of risk-on versus risk-off assets. It helps traders and investors understand whether the market is leaning towards higher risk (risk-on) or safety (risk-off) based on the relative performance of these asset classes. By incorporating the Williams %R, the indicator adds a momentum-based dimension to this analysis, allowing for better decision-making in response to shifting market conditions.
Bill Williams. Candles bear / bullish spread + Alligator.Bill Williams. Candles bear / bullish spread + Alligator.

Larry Williams Valuation Index [tradeviZion]Larry Williams Valuation Index
Welcome to the Larry Williams Valuation Index by tradeviZion! This script is an interpretation of Larry Williams' famous WillVal (Valuation) Index, originally developed in 1990 to help traders determine whether a market or asset is overvalued or undervalued. We've extended it to support multiple securities and offer alerts for different valuation levels, helping you make more informed trading decisions.
What is the Valuation Index?
The Valuation Index measures how a security's current price compares to its historical price action. It helps identify whether the security is overvalued (priced too high), undervalued (priced too low), or in a normal range.
This version supports multiple securities and uses valuation parameters to help you assess the relative valuation of three securities simultaneously. It can help you determine the best times to enter (buy) or exit (sell) the market.
Key Features
Multi-Security Analysis: Analyze up to three securities simultaneously to get a broader view of market conditions.
Valuation Levels: Automatically calculate overvaluation and undervaluation levels or set manual levels for consistent analysis.
Custom Alerts: Create custom alerts when securities move between overvalued, undervalued, or normal ranges.
Customizable Table Display: Display a table with valuation values and their status on the chart.
Getting Started
Step 1: Adding the Script to Your Chart
First, add the Larry Williams Valuation Index script to your chart on TradingView. The script is designed to work with any timeframe, but for best results, use weekly or daily timeframes for a longer-term perspective.
Step 2: Configuring Securities
The script allows you to analyze up to three different securities :
Security 1 (Default: DXY)
Security 2 (Default: GC1!)
Security 3 (Default: ZB1!)
You can enable or disable each security individually.
Custom Timeframe Option: You have the option to select a custom timeframe for analysis. This allows you to see whether the security is overvalued or undervalued in lower or higher timeframes. Note that this feature is experimental and has not been extensively tested. Larry Williams originally used the weekly timeframe to determine if a stock was overvalued or undervalued. By default, the indicator compares the current price with the security based on the selected timeframe, except if you choose to use a custom timeframe.
Pro Tip : New users can start with the default securities to understand the concept before using other assets.
Step 3: Valuation Index Settings
Short EMA Length : This is the short-term average used for calculations. A lower value makes it more responsive to recent price changes.
Long EMA Length : This is the long-term average, used to smooth the valuation over time.
Valuation Length (Default: 156) : Represents approximately three years of daily bars (as recommended by Larry Williams).
How is the Valuation Index Calculated?
The valuation calculation is done using a method called WVI (WillVal Index), which compares the current price of a security to the price of another correlated security. Here’s a step-by-step explanation:
1. Data Collection: The script takes the closing price of the security you are analyzing and the closing price of the correlated security.
2. Ratio Calculation : The ratio of the two prices is calculated:
Price Ratio = (Price of your security) / (Price of correlated security) * 100.
This ratio helps determine how expensive or cheap your security is compared to the correlated one.
3. Exponential Moving Averages (EMAs) : The price ratio is used to calculate short-term and long-term EMAs (Exponential Moving Averages). EMAs are used to create smooth lines that represent the average price of a security over a specific period of time, with more weight given to recent data. By calculating both short-term and long-term EMAs, we can identify the trend direction and how the security is performing compared to its historical averages.
4. Valuation Index Calculation:
The Valuation Index is calculated as the difference between the short-term EMA and the long-term EMA. This difference helps to determine if the security is currently overvalued or undervalued:
A positive value indicates that the price is above its longer-term trend, suggesting potential overvaluation.
A negative value indicates that the price is below its longer-term trend, suggesting potential undervaluation.
5. Normalization:
To make the valuation easier to interpret, the calculated valuation index is then normalized using the highest and lowest values over the selected valuation length (e.g., 156 bars).
This normalization process converts the index into a percentage between 0 and 100, where higher values indicate overvaluation and lower values indicate undervaluation.
Step 4: Understanding Valuation Levels
The valuation levels indicate whether a security is currently undervalued, overvalued, or in a normal range.
Manual Levels : You can manually set the overvaluation and undervaluation thresholds (default is 85 for overvalued and 15 for undervalued).
Auto Levels : The script can automatically calculate these levels based on recent price action, allowing you to adapt to changing market conditions.
Auto Levels Calculation Explained:
The Auto Levels are calculated by taking the average of the valuation indices for all three securities (e.g., index1, index2, and index3).
The script then looks at the highest and lowest values of this average over a selected number of recent bars (e.g., 50 bars).
The overvaluation level is determined by taking the highest value and multiplying it by a multiplier (e.g., 5). Similarly, the undervaluation level is calculated using the lowest value and the multiplier.
These dynamic levels adjust according to recent price action, providing an adaptive approach to identifying overvalued and undervalued conditions.
Step 5: How to Use the Script to Make Trading Decisions
For new users, here's a step-by-step trading strategy you can use with the Valuation Index:
1. Identify Undervalued Opportunities
When two or more securities are in the undervalued range (below 15 for manual or below automatically calculated undervalue levels), wait for at least two of these securities to turn from undervalued to normal .
This transition indicates a potential buy opportunity .
2. Buying Signal
When at least two securities transition from undervalued to normal, you can consider buying the asset.
This indicates that the market may be recovering from undervalued conditions and could be moving into a growth phase.
3. Selling Signal
Exit when the price high closes below the EMA 21 (21-day exponential moving average).
Alternatively, if the valuation index reaches overvalued levels (above 85 manually or auto-calculated), wait for it to drop back to normal . This can be another point to exit the trade .
You can also use any other sell condition based on your r isk management strategy .
Alerts for Valuation Levels
The script includes alerts to notify you of changing market conditions:
To activate these alerts, follow these steps, referring to the provided screenshot with detailed steps:
1. Enable Alerts : Click on the settings gear icon on the script title in your chart. In the settings menu, scroll to the section labeled Alerts Settings .
Enable Alerts by checking the Enable Alerts box.
Set the Required Securities for Alert (default is 2 securities).
Choose the Alert Frequency : Selecting Once Per Bar Close will trigger alerts only at the close of each bar, ensuring you receive confirmed signals rather than potentially noisy intermediate signals.
2. Select Alert Type : Choose the type of alert you want to activate, such as Alert on Overvalued, Alert on Undervalued, Alert on Over to Normal , or Alert on Under to Normal .
3. Save Settings : Click OK to save your alert settings.
4. Add Alert on Indicator : Click the "..." (More button) next to the indicator name on the chart and select " Add alert on tradeviZion - WillVal ".
5. Create Alert : In the Create Alert window:
Set Condition to tradeviZion - WillVal .
Ensure Any alert() function call is selected.
Set the Alert Name and select your Expiration preferences.
6. Set Notification Preferences : Go to the Notifications tab and select how you want to receive notifications, such as via app notification, toast notification, email , or sound alert . Adjust these preferences to best suit your needs.
7. Click Create : Finally, click Create to activate the alert.
These alerts will help you stay informed about key market conditions and take action accordingly, ensuring you do not miss critical trading opportunities.
Understanding the Table Display
The script includes an interactive table on the chart to show the valuation status of each security:
Security : The name of the security being analyzed.
Value : The current valuation index value.
Status : Indicates whether the security is overvalued, undervalued , or in a normal range.
Color: Displays a color code for easy identification of status:
Red for overvalued.
Green for undervalued.
Other colors represent normal valuation levels.
Empowering Messages : Motivational messages are displayed to encourage disciplined trading. These messages will change periodically, helping keep a positive trading mindset.
Acknowledgment
This tool builds upon the foundational work of Larry Williams, who developed the WillVal (Valuation) Index concept. It also incorporates enhancements to extend multi-security analysis, valuation normalization, and advanced alerting features, providing a more versatile and powerful indicator. The Larry Williams Valuation Index [ tradeviZion ] helps traders make informed decisions by assessing overvalued and undervalued conditions for multiple securities simultaneously.
Note : Always practice proper risk management and thoroughly test the indicator to ensure it aligns with your trading strategy. Past performance is not indicative of future results.
Trade smarter with TradeVizion—unlock your trading potential today!

Phase Accumulation, Smoothed Williams %R Histogram [Loxx]Phase Accumulation, Smoothed Williams %R Histogram is a Williams %R indicator using dynamic inputs from Ehlers Phase Accumulation Dominant Cycle Period Algorithm. This indicator includes alerts and signals and is in a smoothed histogram form. The version of Phase Accumulation in this indicator is a modified form of of Ehlers algorithm to allow for better smoothing and cycle length selection.
What is Williams %R?
Williams %R , also known as the Williams Percent Range, is a type of momentum indicator that moves between 0 and -100 and measures overbought and oversold levels. The Williams %R may be used to find entry and exit points in the market. The indicator is very similar to the Stochastic oscillator and is used in the same way. It was developed by Larry Williams and it compares a stock’s closing price to the high-low range over a specific period, typically 14 days or periods.
What is Phase Accumulation?
The phase accumulation method of computing the dominant cycle is perhaps the easiest to comprehend. In this technique, we measure the phase at each sample by taking the arctangent of the ratio of the quadrature component to the in-phase component. A delta phase is generated by taking the difference of the phase between successive samples. At each sample we can then look backwards, adding up the delta phases.When the sum of the delta phases reaches 360 degrees, we must have passed through one full cycle, on average.The process is repeated for each new sample.
The phase accumulation method of cycle measurement always uses one full cycle’s worth of historical data.This is both an advantage and a disadvantage.The advantage is the lag in obtaining the answer scales directly with the cycle period.That is, the measurement of a short cycle period has less lag than the measurement of a longer cycle period. However, the number of samples used in making the measurement means the averaging period is variable with cycle period. longer averaging reduces the noise level compared to the signal.Therefore, shorter cycle periods necessarily have a higher out- put signal-to-noise ratio.
Included:
-Toggle on/off bar coloring
-Toggle on/off signals
-Alerts long/short
-Loxx's Expanded Source Types Library

Abacus Community Williams %R + Bollinger %B📌 Indicator Description (Professional & Clear)
Williams %R + Bollinger %B Momentum Indicator (ThinkOrSwim Style)
This custom indicator combines Williams %R and Bollinger %B into a single, unified panel to provide a powerful momentum-and-positioning view of price action. Modeled after the ThinkOrSwim version used by professional traders, it displays:
✅ Williams %R (10-period) – Yellow Line
This oscillator measures the market's position relative to recent highs and lows.
It plots on a 0% to 100% scale, where:
80–100% → Overbought region
20–0% → Oversold region
50% → Momentum equilibrium
Williams %R helps identify exhaustion, trend strength, and potential reversal zones.
✅ Bollinger %B (20, 2.0) – Turquoise Histogram Bars
%B shows where price is trading relative to the Bollinger Bands:
Above 50% → Price is in the upper half of the band (bullish pressure)
Below 50% → Price is in the lower half (bearish pressure)
Near 100% → Price pushing upper band (possible breakout)
Near 0% → Price testing lower band (possible breakdown)
The histogram visually represents momentum shifts in real time, creating a clean profile of volatility and strength.
🎯 Why This Combination Works
Together, Williams %R and Bollinger %B reveal:
Momentum direction
Overbought/oversold conditions
Volatility compression & expansion
Trend continuation vs reversal zones
High-probability inflection points
Williams %R shows oscillation and exhaustion, while %B shows pressure inside volatility bands.
The combination helps identify whether momentum supports the current trend or is weakening.
🔍 Use Cases
Detect early trend reversals
Validate breakouts and breakdowns
Spot momentum failure in price extremes
Confirm pullbacks and continuation setups
Time entries and exits with higher precision
💡 Best For
Swing traders
Momentum traders
Trend-followers
Options traders (for timing premium decay or volatility expansion)

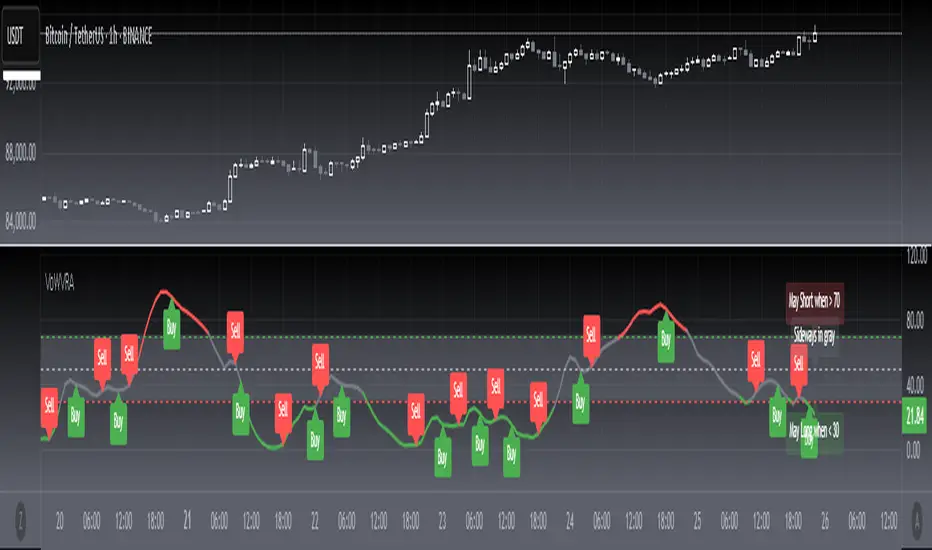
[blackcat] L2 Votatility of Williams VixFix Risk AssessmentHey there! I previously wrote an article about the Larry Williams ViX Fix technical indicator. Soon after, friends from the TradingView community told me that this indicator could be combined with the Risk Assessment indicator I wrote about earlier to determine when to go long or short. At the time, I found it a bit cumbersome to use both indicators together, so I came up with a solution: to merge them. This way, we can use one technical indicator to visually see whether we should go long or short. Isn't that cool? The indicator has a very common name: ** L2 Votatility of Williams VixFix Risk Assessment, or VoWVRA for short.**
This TradingView Pine Script is a custom indicator based on the Larry Williams ViX Fix technical indicator, designed to help traders with risk assessment and trading decisions. The Larry Williams ViX Fix indicator is derived from the volatility of the S&P 500 index and is mainly used to display changes in current market sentiment. The indicator determines market volatility by calculating the distance between the highest price, the lowest price, and the closing price. The higher the value of the indicator, the more tense the market sentiment, and the higher the market volatility; conversely, the lower the value, the more stable the market sentiment and the lower the market volatility.
The VoWVRA indicator is based on the Larry Williams ViX Fix indicator, combined with technical indicators such as Bollinger Bands and EMA, to assess market risk. The indicator can be customized with input parameters to suit different markets and investor needs. Using the VoWVRA indicator can help traders make wiser choices in risk control and trading decisions.
In addition, this TradingView Pine Script also includes a risk assessment indicator. The indicator calculates a series of values and then applies the exponential moving average (EMA) to the percentage change between the closing price and the highest and lowest prices within a certain range to determine the safety level. The safety level is then compared to different thresholds to determine the market's risk level. The risk assessment indicator can be customized with input parameters such as risk length, safety length, and EMA length to suit different market conditions and investor preferences. Using the risk assessment indicator can help traders make wiser decisions in risk management and trading strategies.
By using the VoWVRA and risk assessment indicators, traders can more accurately assess market risk and make wiser choices in trading decisions.
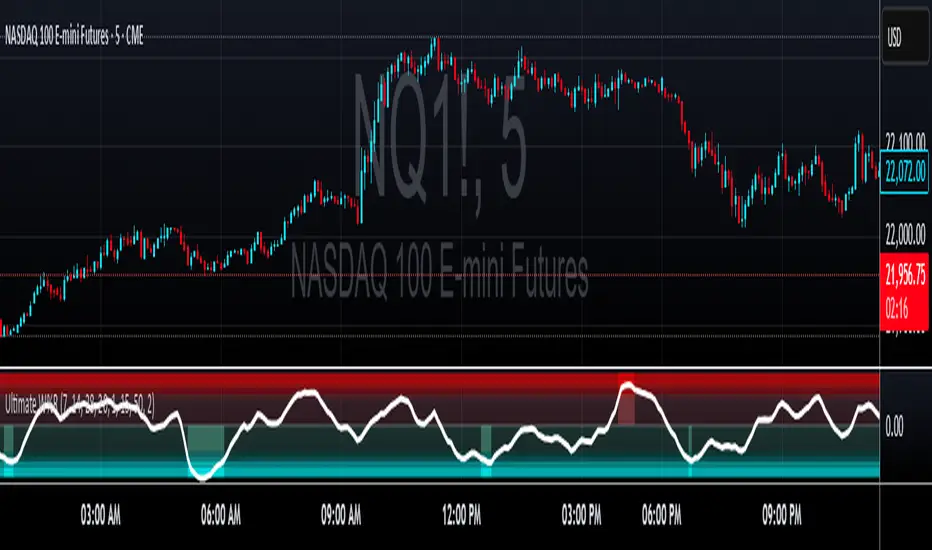
Ultimate Williams %RUltimate Williams %R
The most advanced Williams %R indicator available - featuring multi-timeframe analysis, zero-lag processing, volatility adaptivity, and intelligent extreme zone detection.
Key Improvements Over Standard Williams %R
Multi-Timeframe: Combines short, medium, and long-term Williams %R calculations with Ultimate Oscillator-style weighting for superior signal quality
Zero-Lag Implementation: Utilizes Ehler's Zero-Lag EMA with error correction, eliminating traditional oscillator lag while maintaining smoothness
Volatility Adaptive: Automatically adjusts periods based on ATR volatility analysis for optimal performance in all market conditions
Z-Score Normalization: Provides consistent, statistically-based extreme level detection across different market environments
Perfect For
Overbought/Oversold Identification: Instantly spot extreme market conditions with visual intensity that scales with signal strength
Divergence Analysis: Enhanced responsiveness and smooth operation make divergence patterns clearer and more reliable
Multi-Timeframe Confirmation: Built-in timeframe combination eliminates the need for multiple Williams %R indicators
Entry/Exit Timing: Zero-lag processing provides earlier signals without sacrificing accuracy
Customizable Settings
Timeframe Periods: Adjustable short (7), medium (14), and long (28) periods
Volatility Adaptation: Configurable ATR-based period adjustment
Zero-Lag Processing: Toggle and fine-tune the smoothing system
Z-Score Normalization: Adjustable lookback period for statistical analysis
Extreme Levels: Customizable threshold for extreme signal detection
MTF Williams Vix Market Bottoms [CryptoSea]MTF Williams Vix Fix Indicator is a dynamic tool tailored for traders looking to capture market extremes with high precision. This multi-timeframe indicator leverages the concept of the Williams Vix Fix to spot potential reversals before they occur.
Key Features
Multi-Timeframe Analysis: Provides simultaneous visibility across multiple timeframes, enabling traders to assess market conditions comprehensively from a single chart.
Advanced Volatility Detection: Utilizes a modified Vix Fix formula to highlight extreme price deviations, which often precede significant market reversals.
Customizable Settings: Offers extensive input options to tweak the lookback periods, percentile thresholds, and visibility settings, aligning with various trading strategies.
Visual Band Indicators: Features upper bands and range highs that signal potential overbought and oversold conditions, enhancing trading decision-making.
Below, you can see how the indicator performs across different timeframes, providing valuable insights into market behavior.
How it Works
Vix Fix Calculation: Determines the worst-case 'panic' sell-offs in price as a percentage of the high, capturing the emotional extremes of the market.
Statistical Bands: Employs Bollinger bands over the Vix Fix values to define normal and extreme volatility conditions.
Color-Coded Indicators: Uses color differentiation to instantly highlight when readings surpass critical upper band or range high thresholds, signaling key trading opportunities.
For instance, in the analysis provided below, notice how the indicator flags significant market moves, allowing traders to anticipate potential entry or exit points.
Application
Risk Management: Aids in identifying extreme market conditions where prices may revert, helping in effective position sizing and risk management.
Strategic Planning: Enhances strategic trading plans by identifying not only when but also where market extremes may occur, considering multiple timeframes.
Customization: Adapts seamlessly to different market environments with adjustable settings for volatility thresholds and visual display preferences.
The MTF Williams Vix Fix Indicator by is an essential tool for traders aiming to leverage market volatility for optimal entry and exit, ensuring they are well-equipped to handle market extremes with confidence.
