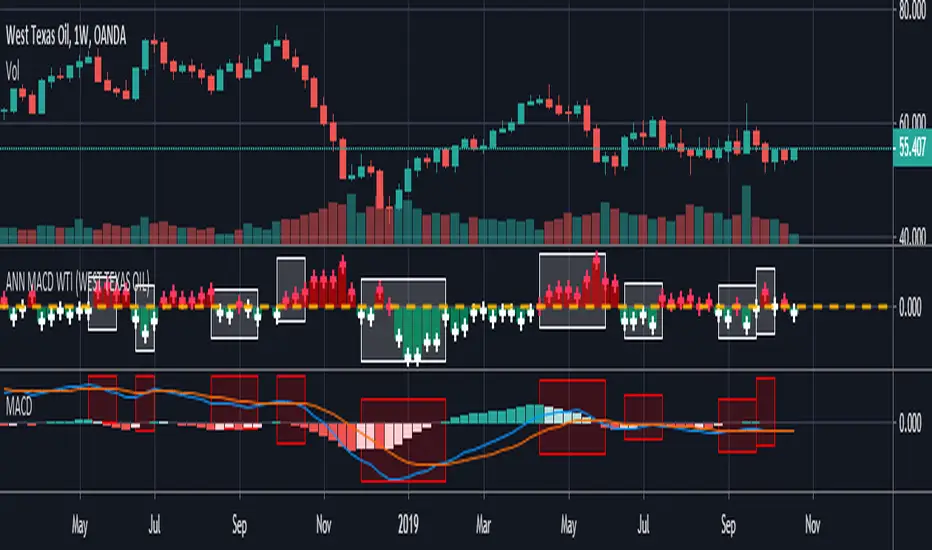
ANN MACD WTI (West Texas Intermediate) This script created by training WTI 4 hour data , 7 indicators and 12 Guppy Exponential Moving Averages.
Details :
Learning cycles: 1
AutoSave cycles: 100
Training error: 0.007593 ( Smaller than average target ! )
Input columns: 19
Output columns: 1
Excluded columns: 0
Training example rows: 300
Validating example rows: 0
Querying example rows: 0
Excluded example rows: 0
Duplicated example rows: 0
Input nodes connected: 19
Hidden layer 1 nodes: 2
Hidden layer 2 nodes: 6
Hidden layer 3 nodes: 0
Output nodes: 1
Learning rate: 0.7000
Momentum: 0.8000
Target error: 0.0100
Special thanks to wroclai for his great effort.
Deep learning series will continue. But I need to rest my eyes a little :)
Stay tuned ! Regards.
Cari dalam skrip untuk "wti原油期货实时行情"
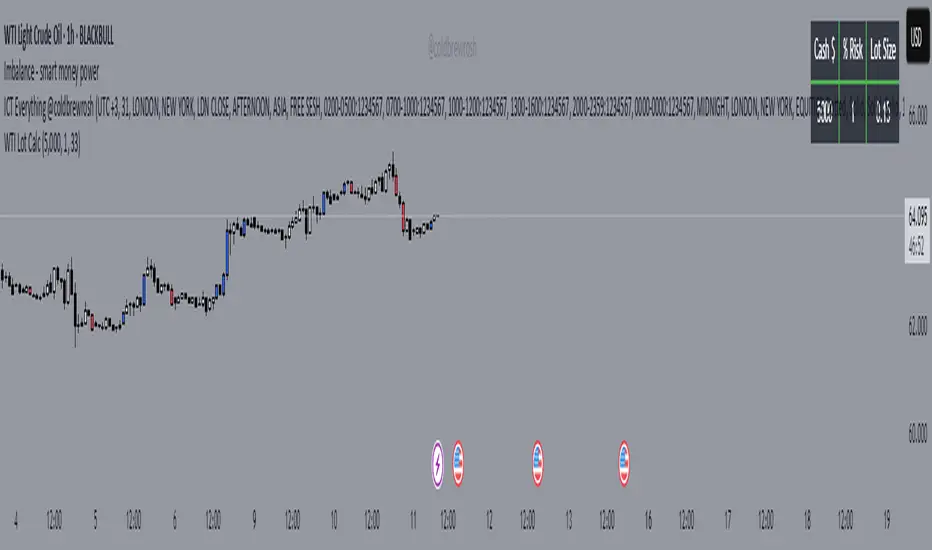
WTI Crude Oil Lot Size Calculator by AdrianFx94Indicator on Trading Chart: Once you add this script to your trading chart (specifically a WTI Crude Oil chart), it appears as an indicator. This means it runs alongside the price data and other technical analysis tools you might be using.
Input Your Trading Parameters:
Balance (USD): You need to enter your trading account balance in USD. This is the amount of money you have in your account.
Risk Percentage (%): This is where you define the percentage of your account balance that you're willing to risk in a single trade. For example, if your account balance is $5000 and you set the risk percentage to 1%, you're willing to risk $50 on a trade.
Stop Loss Pip Size (Pip): Here, you enter the size of your stop loss in pips. A pip is a small measure of change in a currency pair in the forex market. In the context of WTI Crude Oil trading, it represents a small change in the price.
Automated Lot Size Calculation: Based on the inputs you provide, the script automatically calculates the lot size you should use for your trade. The calculation takes into account the balance you're willing to risk, the percentage of risk, and the stop loss size. This helps in managing risk by suggesting the amount of WTI Crude Oil you should trade (in lots) that aligns with your risk tolerance.
Display Results in a Table: The script generates a table displayed on the top right corner of your chart. This table shows:
Your entered balance (in USD).
The risk percentage you've set.
The calculated lot size, which indicates how many lots of WTI Crude Oil you can trade based on your risk management parameters.
Real-Time Updates: As this script is part of an indicator on your chart, it updates in real time. This means if your account balance changes or if you decide to adjust your risk parameters, you can re-enter these values, and the script will update the lot size accordingly.
This tool is particularly useful for WTI Crude Oil traders who follow strict risk management rules. By automating the calculation of the lot size, it saves time and helps in making informed and disciplined trading decisions.
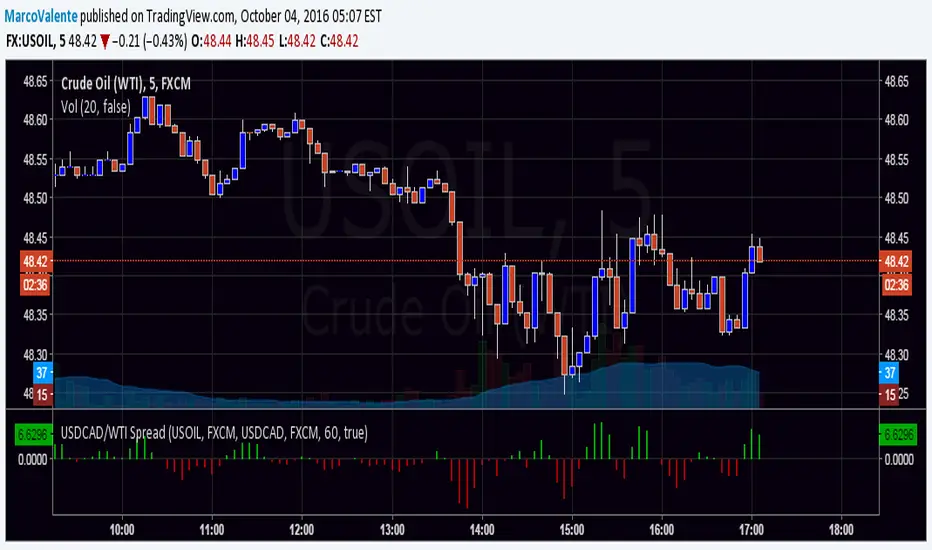
USDCAD/WTI SpreadOne more spread , this is USDCAD/WTI . Is the change of the moment of this 2 security.

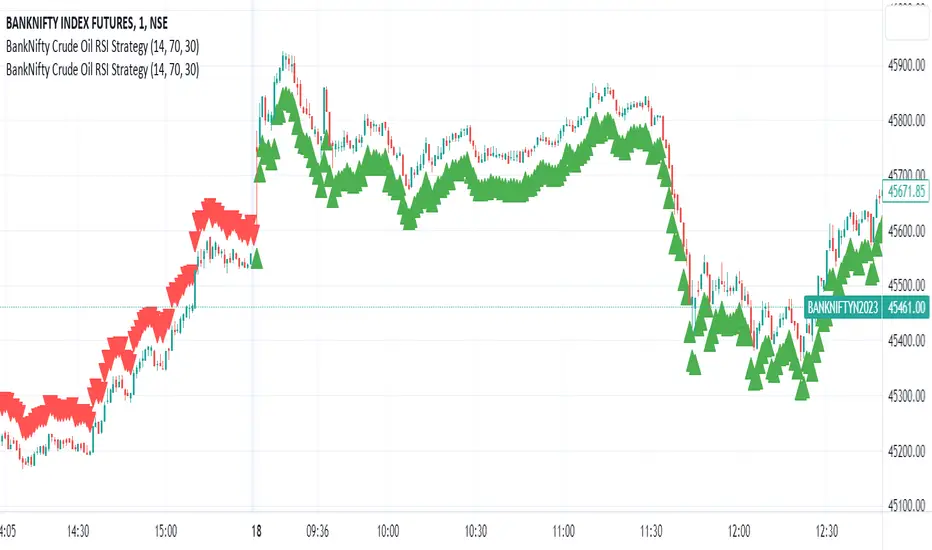
BankNifty Crude Oil RSI Strategy
The "BankNifty Crude Oil RSI Strategy" is a trading strategy that combines the BankNifty index with the WTI Crude Oil price index using the Relative Strength Index (RSI) as the primary indicator. The strategy aims to generate buy and sell signals based on the RSI of the Crude Oil price index, which might influence the BankNifty index.
Here's how the strategy works step by step:
Data Fetching:
The strategy fetches the daily closing prices of WTI Crude Oil from the provided TradingView link "TVC:USOIL" using the request.security function.
RSI Calculation:
The Relative Strength Index (RSI) is calculated using the closing prices of WTI Crude Oil. The RSI is a momentum oscillator that measures the speed and change of price movements. It oscillates between 0 and 100, indicating overbought conditions when above a specified threshold (overbought level) and oversold conditions when below a specified threshold (oversold level).
Buy and Sell Conditions:
The strategy defines two conditions based on the RSI values:
Buy Signal: When the Crude Oil RSI falls below a specified rsiOversold level (default is 30), the strategy generates a buy signal. This implies that the Crude Oil is in an oversold condition, and there might be a potential buying opportunity in the BankNifty index.
Sell Signal: When the Crude Oil RSI rises above a specified rsiOverbought level (default is 70), the strategy generates a sell signal. This implies that the Crude Oil is in an overbought condition, and there might be a potential selling opportunity in the BankNifty index.
Buy and Sell Signal Visualization:
The strategy uses the plotshape function to plot triangular shapes (upward for buy and downward for sell) below and above the price bars, respectively, to indicate the buy and sell signals on the chart visually.
KTUtilsLibrary "KTUtils"
Utility functions for technical analysis indicators, trend detection, and volatility confirmation.
MGz(close, length)
MGz
@description Moving average smoother used for signal processing
Parameters:
close (float) : float Price input (typically close)
length (int) : int Length of smoothing period
Returns: float Smoothed value
atrConf(length)
atrConf
@description Calculates Average True Range (ATR) for volatility confirmation
Parameters:
length (simple int) : int Length for ATR calculation
Returns: float ATR value
f(input)
f
@description Simple Moving Average with fixed length
Parameters:
input (float) : float Input value
Returns: float Smoothed average
bcwSMA(s, l, m)
bcwSMA
@description Custom smoothing function with weight multiplier
Parameters:
s (float) : float Signal value
l (int) : int Length of smoothing
m (int) : int Weighting multiplier
Returns: float Smoothed output
MGxx(close, length)
MGxx
@description Custom Weighted Moving Average (WMA) variant
Parameters:
close (float) : float Price input
length (int) : int Period length
Returns: float MGxx smoothed output
_PerChange(lengthTime)
_PerChange
@description Measures percentage price change over a period and range deviation
Parameters:
lengthTime (int) : int Period for change measurement
Returns: tuple Measured change, high deviation, low deviation
dirmov(len)
dirmov
@description Calculates directional movement components
Parameters:
len (simple int) : int Lookback period
Returns: tuple Plus and Minus DI values
adx(dilen, adxlen)
adx
@description Calculates Average Directional Index (ADX)
Parameters:
dilen (simple int) : int Length for DI calculation
adxlen (simple int) : int Length for ADX smoothing
Returns: float ADX value
trChopAnalysis()
trChopAnalysis
@description Identifies chop and trend phases based on True Range Bollinger Bands
Returns: tuple TR SMA, chop state, trending state
wtiAnalysis(haclose, close, filterValue)
wtiAnalysis
@description Wave Trend Indicator (WTI) with signal crossover logic
Parameters:
haclose (float) : float Heikin-Ashi close
close (float) : float Standard close
filterValue (simple int) : int Smoothing length
Returns: tuple WTI lines and direction states
basicTrend(hahigh, halow, close, open, filterValue)
basicTrend
@description Determines trend direction based on HA high/low and close
Parameters:
hahigh (float) : float Heikin-Ashi high
halow (float) : float Heikin-Ashi low
close (float) : float Standard close
open (float) : float Standard open
filterValue (simple int) : int Smoothing period
Returns: tuple Uptrend, downtrend flags
metrics(close, filterValue)
metrics
@description Common market metrics
Parameters:
close (float) : float Price input
filterValue (int) : int RSI smoothing length
Returns: tuple VWMA, SMA10, RSI, smoothed RSI
piff(close, trend_change)
piff
@description Price-Informed Forward Forecasting (PIFF) model for trend strength
Parameters:
close (float) : float Price input
trend_change (float) : float Change in trend
Returns: tuple Percent change, flags for trend direction
getMACD()
getMACD
@description Returns MACD, signal line, and histogram
Returns: tuple MACD line, Signal line, Histogram
getStoch()
getStoch
@description Returns K and D lines of Stochastic Oscillator
Returns: tuple K and D lines
getKDJ()
getKDJ
@description KDJ momentum oscillator
Returns: tuple K, D, J, Average
getBBRatio()
getBBRatio
@description Bollinger Band Ratio (BBR) and signal flags
Returns: tuple Basis, Upper, Lower, BBR, BBR Up, BBR Down
getSupertrend()
getSupertrend
@description Supertrend values and direction flags
Returns: tuple Supertrend, Direction, Up, Down
Hidden SMT Divergence ICT 01 [TradingFinder] HSMT SMC Technique🔵 Introduction
Hidden SMT Divergence, an advanced concept within the Smart Money Technique (SMT), identifies discrepancies between correlated assets by focusing on their closing prices.
Unlike the standard SMT Divergence, which uses high and low prices for analysis, Hidden SMT Divergence uncovers subtle signals by examining divergences based on the assets' closing values.
These divergences often highlight potential reversals or trend continuations, making this technique a valuable tool for traders aiming to anticipate market movements.
This approach applies across various markets and asset classes, including :
Commodities : CAPITALCOM:GOLD vs. CAPITALCOM:SILVER or BLACKBULL:BRENT vs. BLACKBULL:WTI .
Indices : NASDAQ:NDX vs. TVC:SPX vs. FX:US30 .
FOREX : FX:EURUSD vs. OANDA:GBPUSD vs. TVC:DXY (US Dollar Index).
Cryptocurrencies : BITSTAMP:BTCUSD vs. COINBASE:ETHUSD vs. KUCOIN:SOLUSDT vs. CRYPTOCAP:TOTAL3 .
Volatility Measures : FOREXCOM:XAUUSD vs. TVC:VIX (Volatility Index).
By identifying divergences within these asset groups, traders can gain actionable insights into potential market reversals or shifts in trend direction. Hidden SMT Divergence is particularly effective for pinpointing subtle market signals that traditional methods may overlook.
Bullish Hidden SMT Divergence : This divergence emerges when one asset forms a higher low, while the correlated asset creates a lower low in terms of their closing prices. It often signals weakening downward momentum and a potential reversal to the upside.
Bearish Hidden SMT Divergence : This occurs when one asset establishes a higher high, while the correlated asset forms a lower high based on their closing prices. It typically reflects declining upward momentum and a probable shift to the downside.
🔵 How to Use
The Hidden SMT Divergence indicator provides traders with a systematic approach to identify market reversals or trend continuations through divergences in closing prices between two correlated assets.
🟣 Bullish Hidden SMT Divergence
Bullish Hidden SMT Divergence occurs when the closing price of the primary asset forms a higher low, while the correlated asset creates a lower low. This pattern indicates weakening downward momentum and signals a potential reversal to the upside.
After identifying the divergence, confirm it using additional tools like support levels, volume trends, or indicators such as RSI and MACD. Enter a buy position as the price shows signs of reversal near support zones, ensuring proper risk management by placing a stop-loss below the support level.
Bearish Hidden SMT Divergence
Bearish Hidden SMT Divergence is identified when the closing price of the primary asset forms a higher high, while the correlated asset creates a lower high. This divergence suggests a weakening uptrend and a likely reversal to the downside.
Validate the signal by examining resistance levels, declining volume, or complementary indicators. Consider entering a sell position as the price starts declining from resistance levels, and set a stop-loss above the resistance zone to limit potential losses.
🔵 Setting
Second Symbol : Select the secondary asset to compare with the primary asset. By default, "XAUUSD" (Gold) is used, but it can be customized to any stock, cryptocurrency, or currency pair.
Divergence Fractal Periods : Defines the number of past candles considered for identifying divergences. The default value is 2, but traders can adjust it for greater precision.
Bullish Divergence Line : Displays a dashed line connecting the points of bullish divergence.
Bearish Divergence Line : Shows a similar line for bearish divergence points.
Bullish Divergence Label : Marks areas of bullish divergence with a "+SMT" label.
Bearish Divergence Label : Highlights bearish divergences with a "-SMT" label.
Chart Type : Choose between Line or Candle charts for enhanced visualization.
🔵 Conclusion
Hidden SMT Divergence offers traders a refined method for identifying market reversals by analyzing closing price discrepancies between correlated assets. Its ability to uncover subtle divergences makes it an essential tool for traders who aim to stay ahead of market trends.
By integrating this technique with other technical analysis tools and sound risk management, traders can enhance their decision-making process and capitalize on market opportunities with greater confidence.
Hidden SMT Divergence’s focus on closing prices ensures more precise signals, helping traders refine their strategies across various markets, including Forex, commodities, indices, and cryptocurrencies.
Its open-source nature allows for customization and verification, providing transparency and flexibility to suit diverse trading needs. Hidden SMT Divergence stands as a powerful addition to the arsenal of any trader seeking to unlock hidden opportunities in dynamic financial markets.

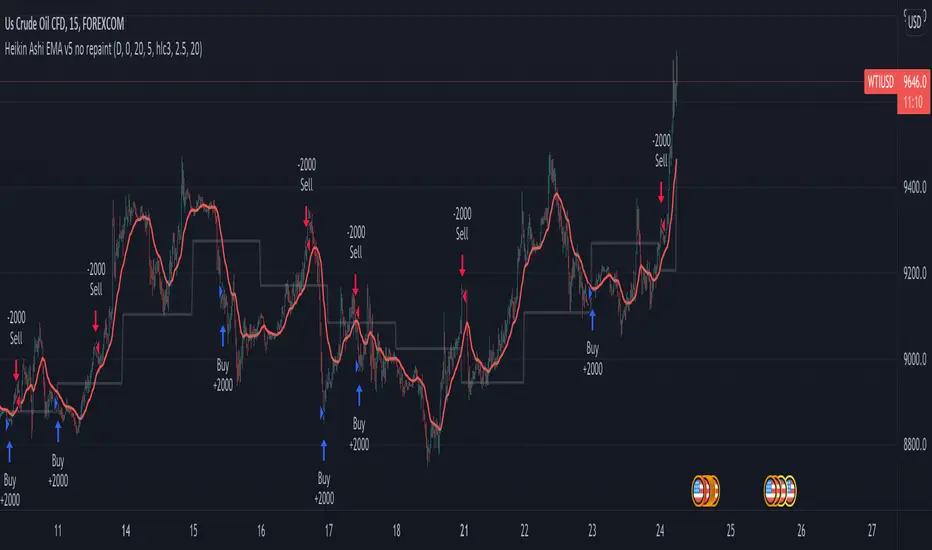
Heikin Ashi EMA v5 no repaint This script was inspired by the "Heikin/Kaufman Strategy" from marco valente built on v2.
The script was rebuilt on the v5 and most importantly removed the repaint function that was driving surrealistic backtesting inflated numbers.
This script is now fully functional and not repainting - At the time of testing worked efficiently 90% WR and 2x profit factor on CFD WTI OIL with a 15m time frame indexed on forex.com price.
You should utilize this script with caution, especially on high volatility cycles you can try plotting against a volatility relative index or stop.
I also strongly recommend understanding the fundamentals of WTI OIL to balance the indications of the strategy with fundamentals.
Thanks to Clovis Warlop and Nilesh Sharma for their contribution.
Cheers,
Gustavo Bramao
Alpha Spread Indicator Panel - [AlphaGroup.Live]Alpha Spread Indicator Panel –
This sub-panel plots the OLS spread between two assets, normalized into percent .
• Green area = spread above zero (Buy Leg1 / Sell Leg2)
• Red area = spread below zero (Sell Leg1 / Buy Leg2)
• The white line shows the exact % deviation of the spread from its fitted baseline
• Optional ±1% and ±2% guides give clear statistical thresholds
Because it’s expressed in percent relative to midprice , the scale remains consistent even if absolute prices change over years.
⚠️ Important: This panel is designed to be used together with the overlay chart:
👉 Alpha Spread Indicator Chart –
Pre-selected asset pairs included:
EURUSD / GBPUSD
AUDUSD / NZDUSD
USDJPY / USDCHF
USDCAD / USDNOK
EURJPY / GBPJPY
AUDJPY / NZDJPY
XAUUSD / XAGUSD
WTI (USOIL) / Brent (UKOIL)
NatGas / Crude
HeatingOil / RBOB
Corn / Wheat
Platinum / Palladium
XOM / CVX
KO / PEP
V / MA
JPM / BAC
NVDA / AMD
BHP / RIO
SHEL / BP
SPY / QQQ
Want more institutional-grade setups? Get our 100 Trading Strategies eBook free at:
alphagroup.live
Tags: pairs-trading, spread-trading, statistical-arbitrage, ols-regression, zscore, mean-reversion, arbitrage, quant, hedge, alphagroup

Alpha Spread Indicator Chart - [AlphaGroup.Live]Alpha Spread Indicator Chart –
This overlay plots the two legs of a pair trade directly on the price chart .
• Leg1 is shown in teal
• Leg2 (fitted) is shown in orange
• The green/red filled area shows the distance (spread) between the two
The spread is calculated using OLS regression fitting , which keeps Leg2 scaled to Leg1 so the overlay always sticks to the chart’s price axis. When the fill turns green , the model suggests Buy Leg1 / Sell Leg2; when it turns red , it suggests Sell Leg1 / Buy Leg2.
Optional Z-Score bands help visualize statistical stretch from the mean.
⚠️ Important: To use this tool properly, you also need to install the companion script:
👉 Alpha Spread Indicator Panel –
Pre-selected asset pairs included:
EURUSD / GBPUSD
AUDUSD / NZDUSD
USDJPY / USDCHF
USDCAD / USDNOK
EURJPY / GBPJPY
AUDJPY / NZDJPY
XAUUSD / XAGUSD
WTI (USOIL) / Brent (UKOIL)
NatGas / Crude
HeatingOil / RBOB
Corn / Wheat
Platinum / Palladium
XOM / CVX
KO / PEP
V / MA
JPM / BAC
NVDA / AMD
BHP / RIO
SHEL / BP
SPY / QQQ
Ready to take your trading further? Download our free eBook with 100 trading strategies at:
alphagroup.live
Tags: pairs-trading, spread-trading, statistical-arbitrage, ols-regression, zscore, mean-reversion, arbitrage, quant, hedge, alphagroup

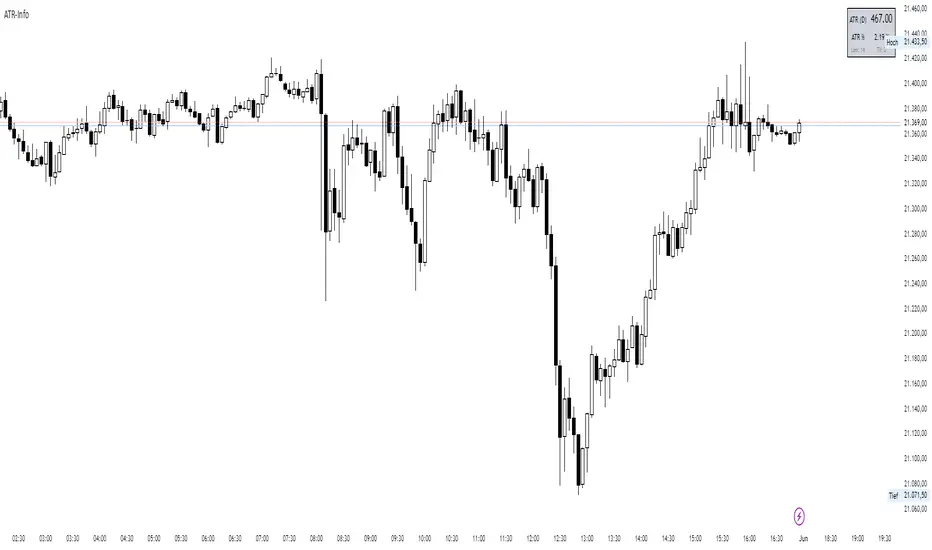
ATR-InfoWHAT IT SHOWS
- ATR (): Average True Range of the chosen timeframe, printed with the instrument’s native tick precision (format.mintick).
- ATR % PRICE: ATR divided by the latest close, multiplied by 100 – the range as a percentage of current price.
- LEN / TF: The ATR length and timeframe you selected (shown in small print).
INPUTS
- ATR Length (default 14)
- ATR Timeframe (for example 60, D, W)
- Design settings: table position, font size, colours, border
EXAMPLES
BTC-USD: price 67 800, ATR 2 450, ATR % 3.6
NQ E-Mini: price 18 230, ATR 355, ATR % 1.9
CL WTI: price 76.40, ATR 2.10, ATR % 2.8
EUR-USD: price 1.0860, ATR 0.0075, ATR % 0.69
USE CASES
Volatility-adjusted stops: place your stop roughly one ATR beyond the entry price.
Position sizing: money at risk divided by ATR gives the number of contracts or coins.
Market selection: trade assets only when their ATR % sits in your preferred range.
Strategy filter: trigger entries or exits only when ATR % crosses a chosen threshold.
LIMITS
ATR is descriptive; it does not predict future moves.
Illiquid symbols may show exaggerated ATR spikes.
ATR % ignores differing session lengths (24/7 crypto versus exchange-traded hours).
Modern Economic Eras DashboardOverview
This script provides a historical macroeconomic visualization of U.S. markets, highlighting long-term structural "eras" such as the Bretton Woods period, the inflationary 1970s, and the post-2020 "Age of Disorder." It overlays key economic indicators sourced from FRED (Federal Reserve Economic Data) and displays notable market crashes, all in a clean and rescaled format for easy comparison.
Data Sources & Indicators
All data is loaded monthly from official FRED series and rescaled to improve readability:
🔵 Real GDP (FRED:GDP): Total output of the U.S. economy.
🔴 Inflation Index (FRED:CPIAUCSL): Consumer price index as a proxy for inflation.
⚪ Debt to GDP (FRED:GFDGDPA188S): Federal debt as % of GDP.
🟣 Labor Force Participation (FRED:CIVPART): % of population in the labor force.
🟠 Oil Prices (FRED:DCOILWTICO): Monthly WTI crude oil prices.
🟡 10Y Real Yield (FRED:DFII10): Inflation-adjusted yield on 10-year Treasuries.
🔵 Symbol Price: Optionally overlays the charted asset’s price, rescaled.
Historical Crashes
The dashboard highlights 10 major U.S. market crashes, including 1929, 2000, and 2008, with labeled time spans for quick context.
Era Classification
Six macroeconomic eras based on Deutsche Bank’s Long-Term Asset Return Study (2020) are shaded with background color. Each era reflects dominant economic regimes—globalization, wars, monetary systems, inflationary cycles, and current geopolitical disorder.
Best Use Cases
✅ Long-term macro investors studying structural market behavior
✅ Educators and analysts explaining economic transitions
✅ Portfolio managers aligning strategy with macroeconomic phases
✅ Traders using history for cycle timing and risk assessment
Technical Notes
Designed for monthly timeframe, though it works on weekly.
Uses close price and standard request.security calls for consistency.
Max labels/lines configured for broader history (from 1860s to present).
All plotted series are rescaled manually for better visibility.
Originality
This indicator is original and not derived from built-in or boilerplate code. It combines multiple economic dimensions and market history into one interactive chart, helping users frame today's markets in a broader structural context.

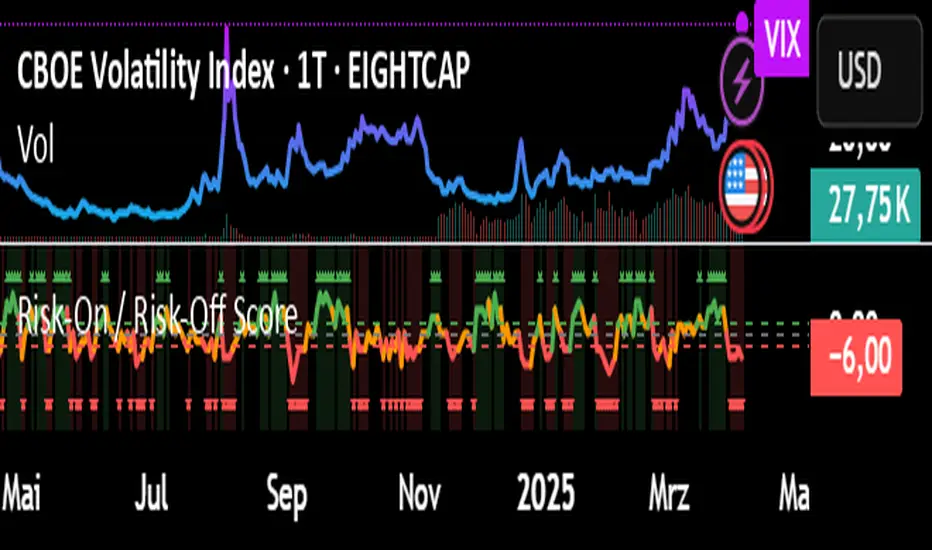
Risk-On / Risk-Off ScoreRisk-On / Risk-Off Score (Macro Sentiment Indicator)
This indicator calculates a custom Risk-On / Risk-Off Score to objectively assess the current market risk sentiment using a carefully selected basket of macroeconomic assets and intermarket relationships.
🧠 What does this indicator do?
The score is based on 14 key components grouped into three categories:
🟢 Risk-On Assets (rising = appetite for risk)
(+1 if performance over X days is positive, otherwise –1)
NASDAQ 100 (NAS100USD)
S&P 500 (SPX)
Bitcoin (BTCUSD)
Copper (HG1!)
WTI Crude Oil (CLK2025)
🔴 Risk-Off Assets (rising = flight to safety)
(–1 if performance is positive, otherwise +1)
Gold (XAUUSD)
US Treasury Bonds (TLT ETF) (TLT)
US Dollar Index (DXY)
USD/CHF
USD/JPY
US 10Y Yields (US10Y) (yields are interpreted inversely)
⚖️ Risk Spreads / Relative Indicators
(+1 if rising, –1 if falling)
Copper/Gold Ratio → HG1! / XAUUSD
NASDAQ/VIX Ratio → NAS100USD / VIX
HYG/TLT Ratio → HYG / TLT
📏 Score Calculation
Total score = sum of all components
Range: from –14 (extreme Risk-Off) to +14 (strong Risk-On)
Color-coded output:
🟢 Score > 2 = Risk-On
🟠 –2 to +2 = Neutral
🔴 Score < –2 = Risk-Off
Displayed as a line plot with background color and signal markers
🧪 Timeframe of analysis:
Default: 5 days (adjustable via input)
Calculated using Rate of Change (% change)
🧭 Use Cases:
Quickly assess macro sentiment
Filter for position sizing, hedging, or intraday bias
Especially useful for:
Swing traders
Day traders with macro filters
Volatility and options traders
📌 Note:
This is not a buy/sell signal indicator, but a contextual sentiment tool designed to help you stay aligned with overall market conditions.
Accurate BUY & SELL 5 mins TF by RRAlways trade using 5 mins Time frame of chart.
For Buy entry always buy 1 point above the candle closing price & SL would be previous candle low or 30 points.
For Sell Entry Always Sell 1 point below the candle opening price & SL would be previous candle high or 30 points.
Do not take trades using 3 mins Time frame, as there is lot of noise. It works best with 5 mins Time frame.
I have adjusted/set according my trading pattern, if needed use the settings options to set accordingly .
Removed range highlighter to keep the chart simple.
Original Version credits to ZacVaughn
Actual Version i just set alerts and change the parameters for Crude OIL 5min Chart.
NO REPAINT.
Wait For Barclose

vol_premiaThis script shows the volatility risk premium for several instruments. The premium is simply "IV30 - RV20". Although Tradingview doesn't provide options prices, CBOE publishes 30-day implied volatilities for many instruments (most of which are VIX variations). CBOE calculates these in a standard way, weighting at- and out-of-the-money IVs for options that expire in 30 days, on average. For realized volatility, I used the standard deviation of log returns. Since there are twenty trading periods in 30 calendar days, IV30 can be compared to RV20. The "premium" is the difference, which reflects market participants' expectation for how much upcoming volatility will over- or under-shoot recent volatility.
The script loads pretty slow since there are lots of symbols, so feel free to delete the ones you don't care about. Hopefully the code is straightforward enough. I won't list the meaning of every symbols here, since I might change them later, but you can type them into tradingview for data, and read about their volatility index on CBOE's website. Some of the more well-known ones are:
ES: S&P futures, which I prefer to the SPX index). Its implied volatility is VIX.
USO: the oil ETF representing WTI future prices. Its IV is OVX.
GDX: the gold miner's ETF, which is usually more volatile than gold. Its IV is VXGDX.
FXI: a china ETF, whose volatility is VXFXI.
And so on. In addition to the premium, the "percentile" column shows where this premium ranks among the previous 252 trading days. 100 = the highest premium, 0 = the lowest premium.

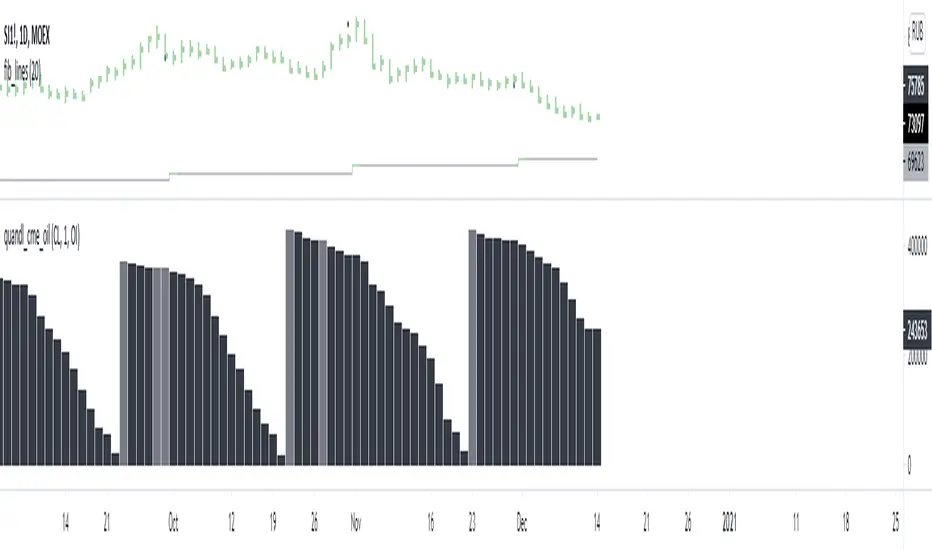
quandl_cme_oilquandl data for oil (set for 1Day)
-Brent and WTI
-Contract selection
-Data type selection
Rain On Me IndicatorFinally, we made it :D
Rain On Me Indicator, As the name suggests this indicator will make money rain on you. More seriously, this indicator contains :
This indicator contains:
-Bullish and bearish RSI divergences showing on chart with alerts.
-Parabolic SAR with Labels on chart with buying or selling alerts.
-3 Moving Average (MA 1 : 7, MA 2 : 21 MA 3 HIDDEN : 50 (Cross alerts for Pullback)
-Customizable Bollinger band
-Fibonacci on 10 levels with the level 0 to the middle. This Fibonacci help a lot since it can let you find easily entry/exit point, trend and even where to place your Take Profit and Stop Loss. It have alerts for most important levels (0.382, 0.§, 0.618) for Crossunder and Crossover in Bullish or Bearish trend.
-Fully Customizable Ichimoku Cloud.
-Trend Buy/Sell Labels on chart with buying or selling signal alerts.
-Trend color visible on candles.
If an alert trigger of Buy/Sell Signal with the same alert based on PSAR, so you can be confident to enter in position. Alway checking fibs level that is the key thing with this indicator. the script has been set to have the best possible results on as many market as possible. But.best result for zfter backtesting is on
Forex : EUR/USD, USDJPY, USDCAD.
Indice : S&P500, NASDAQ, DOWJONES
Commodities : OIL, WTI
Everything work on following timeframe :
15MN, 1H, 4H, DAILY, WEEKLY.
So that you can avoid having to set it again, whether it be in minutes, hours, days, months.
So you can easily trade in the mode that suits you best. It works well on everything from indices to forex to commodities etc. I thank all those who allowed me to carry out this project. IF you feelt free to give your ideas, suggestions, for improve it by sending me messages.
This is really a first version sp it may contain bugs / errors that will be fixed over time.
A BIG THANK YOU TO QUANTNOMAD WHO GIVE ME HIS PERMISSION TO USE, MODIFY AND REPUBLISH HIS "Ultimate Pivot Points Alerts" Script Indicator :
Good trade to all !

Position Size Calculator ATRThis tool calculates your position size based on the ATR.
Caution: You MUST convert the capital amount into the same currency as the instrument you are trading before inputting it into the calculator.
Ex) Assume your capital is in USD...
Ex) GBP/JPY >>> So convert 10,000 USD capital into JPY.
Ex) BTC/USD >>> No conversion necessary.
Ex) Apple stock traded on US stock exchange; AAPL/USD >>> Capital must be in USD; thus, no conversion necessary.
Ex) WTI Oil/USD >>> Capital is already in USD, no conversion necessary.
Hopefully this helps, if your confused about the conversion process, message me or comment below.
Feel free to follow me, and happy trading guys!

ANN MACD : 25 IN 1 SCRIPTIn this script, I tried to fit deep learning series to 1 command system up to the maximum point.
After selecting the ticker, select the instrument from the menu and the system will automatically turn on the appropriate ann system.
Listed instruments with alternative tickers and error rates:
WTI : West Texas Intermediate (WTICOUSD , USOIL , CL1! ) Average error : 0.007593
BRENT : Brent Crude Oil (BCOUSD , UKOIL , BB1! ) Average error : 0.006591
GOLD : XAUUSD , GOLD , GC1! Average error : 0.012767
SP500 : S&P 500 Index (SPX500USD , SP1!) Average error : 0.011650
EURUSD : Eurodollar (EURUSD , 6E1! , FCEU1!) Average error : 0.005500
ETHUSD : Ethereum (ETHUSD , ETHUSDT ) Average error : 0.009378
BTCUSD : Bitcoin (BTCUSD , BTCUSDT , XBTUSD , BTC1!) Average error : 0.01050
GBPUSD : British Pound (GBPUSD,6B1! , GBP1!) Average error : 0.009999
USDJPY : US Dollar / Japanese Yen (USDJPY , FCUY1!) Average error : 0.009198
USDCHF : US Dollar / Swiss Franc (USDCHF , FCUF1! ) Average error : 0.009999
USDCAD : Us Dollar / Canadian Dollar (USDCAD) Average error : 0.012162
SOYBNUSD : Soybean (SOYBNUSD , ZS1!) Average error : 0.010000
CORNUSD : Corn (ZC1! ) Average error : 0.007574
NATGASUSD : Natural Gas (NATGASUSD , NG1!) Average error : 0.010000
SUGARUSD : Sugar (SUGARUSD , SB1! ) Average error : 0.011081
WHEATUSD : Wheat (WHEATUSD , ZW1!) Average error : 0.009980
XPTUSD : Platinum (XPTUSD , PL1! ) Average error : 0.009964
XU030 : Borsa Istanbul 30 Futures ( XU030 , XU030D1! ) Average error : 0.010727
VIX : S & P 500 Volatility Index (VX1! , VIX ) Average error : 0.009999
YM : E - Mini Dow Futures (YM1! ) Average error : 0.010819
ES : S&P 500 E-Mini Futures (ES1! ) Average error : 0.010709
GAZP : Gazprom Futures (GAZP , GZ1! ) Average error : 0.008442
SSE : Shangai Stock Exchange Composite (Index ) ( 000001 ) Average error : 0.011287
XRPUSD : Ripple (XRPUSD , XRPUSDT ) Average error : 0.009803
Note 1 : Australian Dollar (AUDUSD , AUD1! , FCAU1! ) : Instrument has been removed because it has an average error rate of over 0.13.
The average error rate is 0.1850.
I didn't delete it from the menu just because there was so much request,
You can use.
Note 2 : Friends have too many requests, it took me a week in total and 1 other script that I'll share in 2 days.
Reaching these error rates is a very difficult task, and when I keep at a low learning rate, they are trained for a very long time.
If I don't see the error rate at an average low, I increase the layers and go back into a longer process.
It takes me 45 minutes per instrument to command artificial neural networks, so I'll release one more open source, and then we'll be laying 70-80 percent of the world trade volume with artificial neural networks.
Note 3 :
I would like to thank wroclai for helping me with this script.
This script is subject to MIT License on behalf of both of us.
You can review my original idea scripts from my Github page.
You can use it free but if you are going to modify it, just quote this script .
I hope it will help everyone, after 1-2 days I will share another ann script that I think is of the same importance as this, stay tuned.
Regards , Noldo .

Open Interest:CME e-o-d vs CFTC e-o-wCFTC only publishes total OI on fridays, related to last Tuesday.
But what happened since last Tuesday?
CME Vol & Open Interest data is recorded&exported daily by quandl.com to tradingview
via the che CHRIS/CME datasets
www.quandl.com
Eg. Nat Gas next outstanding cntract n. 20, field n. 7(OI)
@quandl.com:
www.quandl.com
is exported @tradingview:
www.tradingview.com
Every outstanding contract's OI & vol is exported (black column), but not the total (yellow line):
tiny.cc
This script sums up all the existing outstanding contract's OI for the future (the black column), so one can have an idea of the total OI for the day (Yellow line).
As numer of outstanding contracts varies from future to future,Eg:
E-mini (ES) has 4 contracts, Gold(GC) 16 cntrcts, NatGas(NG) has 43, WTI(CL) has 38 etc
the scrips tries to guess how many exist for it and sums them up, to have the total OI for tha day
Number ofoutstanding contracts exported by quandl.com to tradingview is taken from
s3.amazonaws.com
There are 2 params you can enter on the script:
* override the ticket symbol on the chart ,if script cannot guessit or you need a different one
* enter the "preliminary" OI that is published by CME early the next day, butb not yet exported by quandl to tradingview
This script is Open so anyone can copy and modifyit for its use.
Please post comments and ideas if you find it useful
I try to keep a log of my work here:

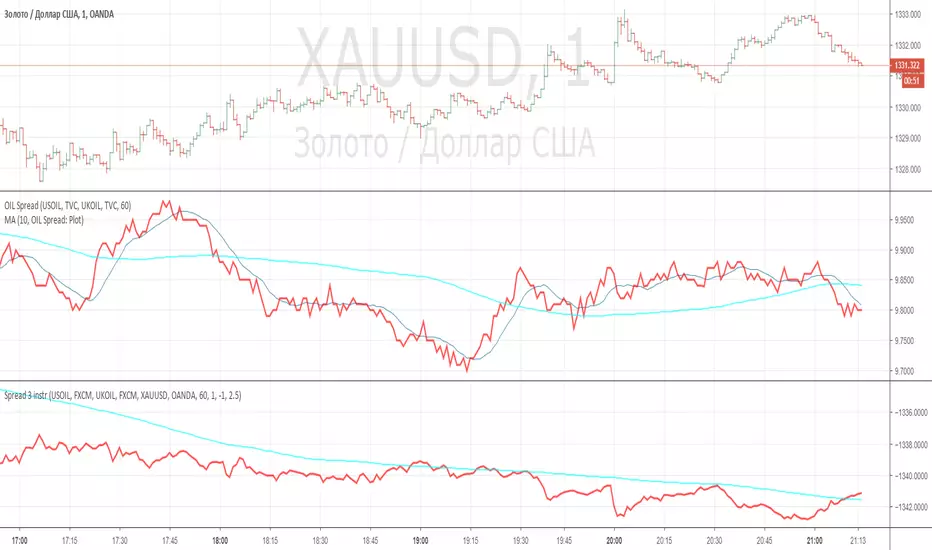
Spread 3 instr with multiplayerThis indicator helps to create 3 legs spread - like brent, wti and gold
Average True Range (ATR %) Stop Loss CalculatorThis indicator takes the average of a series of ATR to calculate what I would consider an optimum stop loss placement represented in percentage (read below for full overview).
While the data is plotted what is most helpful are the actual numbers presented and for my charts I remove most of the plotting.
This indicator is most helpful on the daily timeframe but can be used for all timeframes such as the 4HR, 1HR or even 15M.
This indicator should not be used alone. It should be used in conjunction with proper price action analysis. It’s also a great indicator if you chart using Value Channels. Ideally you want your stop placement to be below at least one core Value Channel boundary range. In addition to standard support and resistance and some key moving averages the market respects. This also works best when trading with the prevailing BIAS of the instrument (bull or bear).
Cryptos: Generally, that means you’re buying on retracements that fit the end of a structured move. The other option is using this in a clear up trending market where the pull backs are clearly being supported with buying.
FOREX: I built another indicator for FOREX search: ATRPIPS with SL
WTI: Helpful but I have different rules for when I trade WTI. I rely upon VCs and diagnal VCs much more when trading this.
Equities: Helpful but with the increase of volatility as well as uncertainty of Bias of the market-- this should be used as more of a guide than
What is most important is the actual percentage numbers but I've found graphing 1-3 of the actual ATRs is helpful. The rest just uncheck the checkbox in the options.
Indicator Overview:
Value 1 - 3 Period ATR (maroon)
Value 2 - 7 Period ATR (green)
Value 3 - 30 Period ATR (blue)
Value 4 - 90 Period ATR (blue, bold)
Value 5 - 1 Period ATR (green)
Value 6 - 1 Period ATR (red)
Value 6 – Prime Stop Loss Placement (maroon). This is the average of all above ATRs multiplied by 1.5
Value 7 - Move Left (red). Experimental value. This is the difference between (prime stop loss) and 1 day period move. Two ways to use this value. Use as a tighter stop loss placement. The other option is to use as a retrace target for purchase and using the Prime Stop Placement value as you’re stop loss.
All ATRs use the LOW price of the period. After testing both the low and close I’ve settled on the low to capture the most volatility you will typically experience.
Once again, this indicator should be used in conjunction with your proven trade system.
Also, by knowing what the values are within the indicator you could just eye ball what would be the best stop placement depending on the ATR or 1 or 2 ATRs you find most represent the volatility of what you are trading.
I will be expanding on this indicator by bringing in average measured moves as well as volume analysis and most likely with color changes and modifications.
Background:
While using and refining my trade system I've noticed that most moves happen in 3 periods. So we start there. The 7 period is good for a 24 hour market such as crypto (although weekend trading can be a hit or miss) and to some extent FOREX. The longer periods of 30 & 90 are to smooth out the data set. The final value of the 1 period is to bring a little more recency to the calculation.
Why multiply the average by 1.5? I've found in my own trading and system I built to be the best placement (in conjunction with VCs) to ensure you're stop isn't to close and is within the instrument you are trading volatility .
I'm looking at making this more intelligent as well as take into account volume and structured moves.

