Cari dalam skrip untuk "北证50+股票+新浪财经"

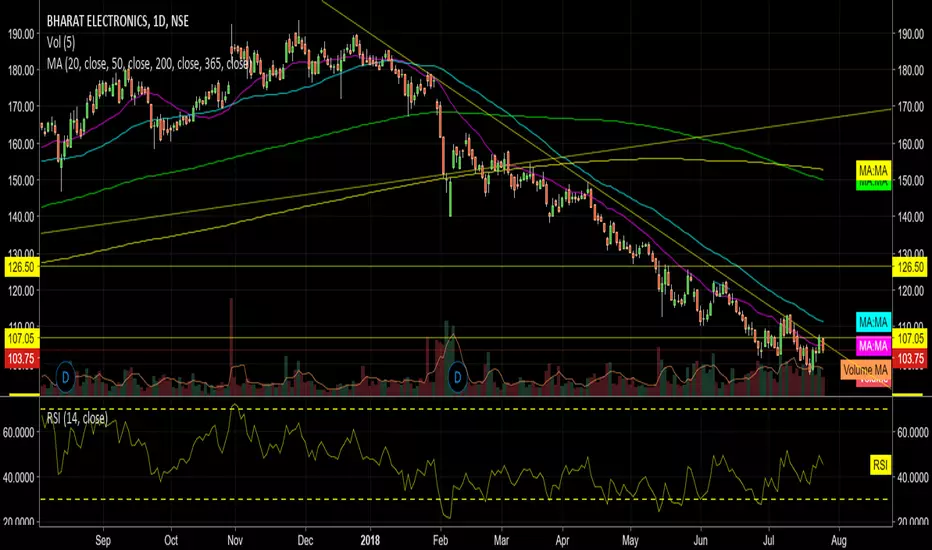
Anupam's MAs (20,50,200,365)This shows Multiple MAs of 20, 50, 200 and 365 as one common Indicator, thus it can save 4 Different Indicator inputs for Free users.

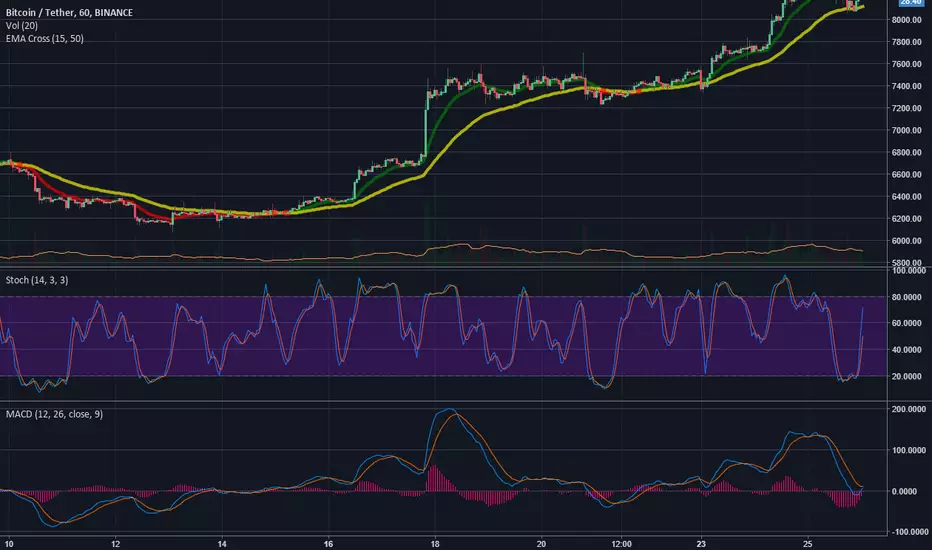
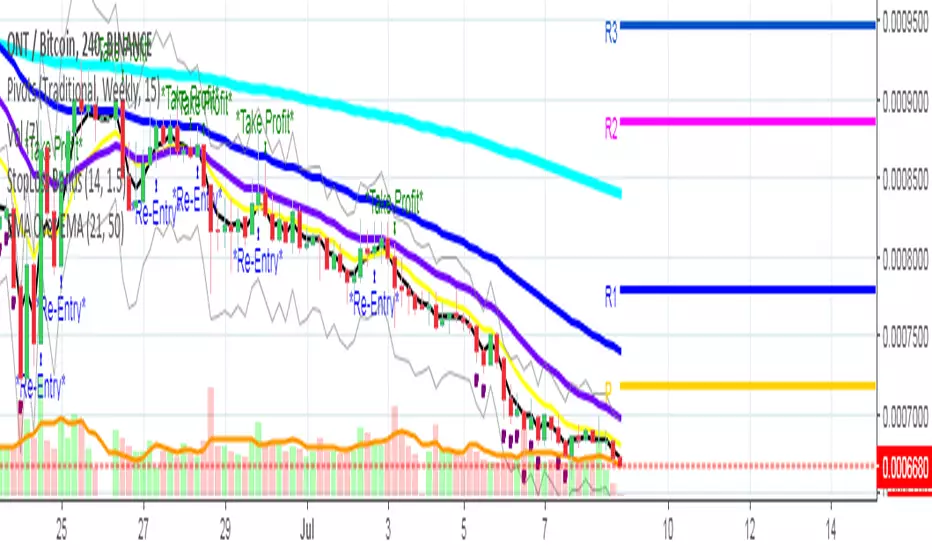
EMA Cross EMA 21 50This script marks trending analisys when EMA 21 crosses EMA 50 in order to stablish a bullish or bearish trend. Also shows entry and quit points depending of EMA 3 crosses EMA 9.
EMA 200 is showed in order to take a better analisys of in or out
Also when RSI is down 30 level a purple flag is showed and an orange flag when 80 level is crossed up
This script works better in 4 hrs period
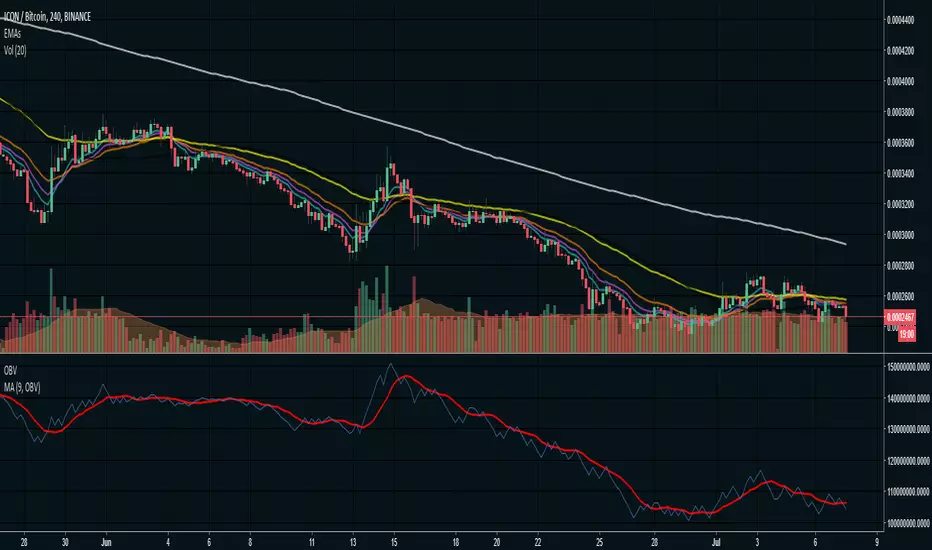
Philakone 4EMAs + 2MAs (200+50)Hi guys ^^
This is script combined all EMAs philakone use plus i added death and golden cross MA which is 200 MA + 50 MA
you can customize it hide show change colors all
and you can change the code add it do what ever you like
if you like this and want to support
BTC
3BMEXA9mJMhMBJR9MR3t7othh7BijxUNW7
Thanks ^^

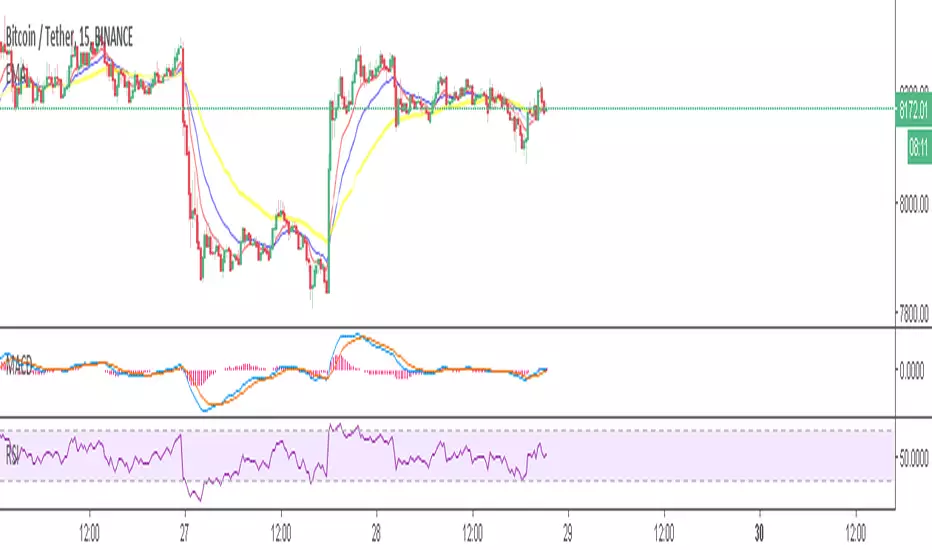
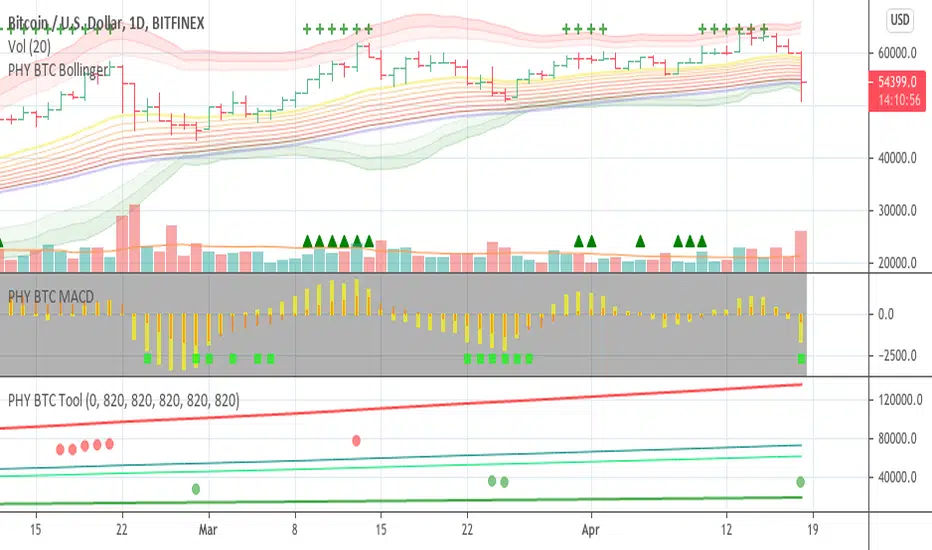
Bollinger Bands Physics with SMA 50 and EMA 15// opening bollinger bands green triangle at bottom
// sma 50 orange line
// ema 15 green line
// low above ema, and ema above sma, and diff of sma and ema increasing teal on top
// opposite red X at bottom
// use with MACD double Physics
// thank you to other users on tradingview for code for bollinger bands, sma, ema script

Simple Moving Averages (7, 30, 50, 100, 200)7, 30, 50, 100, 200 simple moving averages, bundled in one indicator (for users who are using the free TradingView service and can only load limited number of indicators at any given time).
You can turn each moving average on or off at will and change the colors.

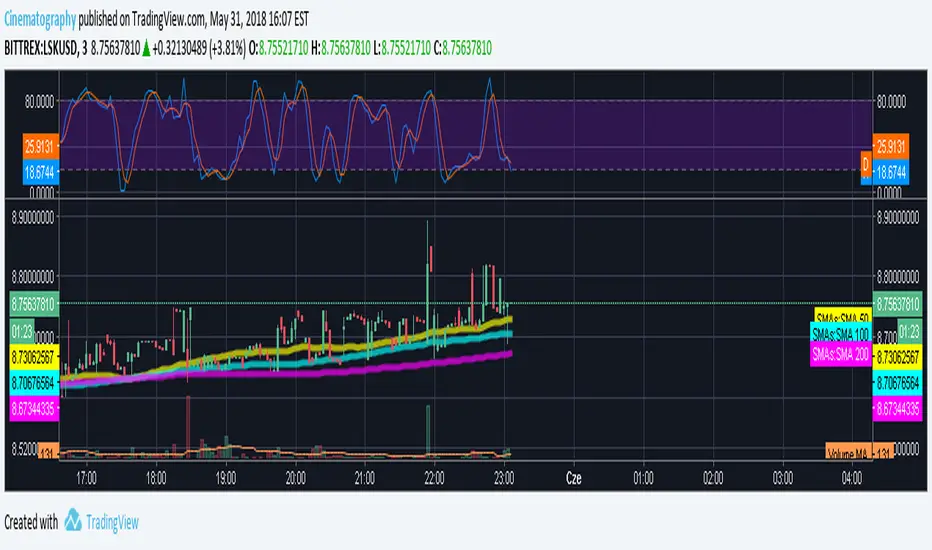
SMA 50/100 / 200Couldn't find a simple moving average that combined the three i was looking for so I made it. Nothing special.

Multi Indicators v1 - 20 50 200 EMA/SMA, Bollinger Bands, VWAPMulti Indicators v1
20 50 200 EMA/SMA, Bollinger Bands, VWAP
These can be turned on and off
I'll be adding to this multi indicator in future updates
30, 50, 100 and 200 Day Simple Moving AveragesEasy to Use to see 30, 50, 100 and 200 Day Simple Moving Averages.