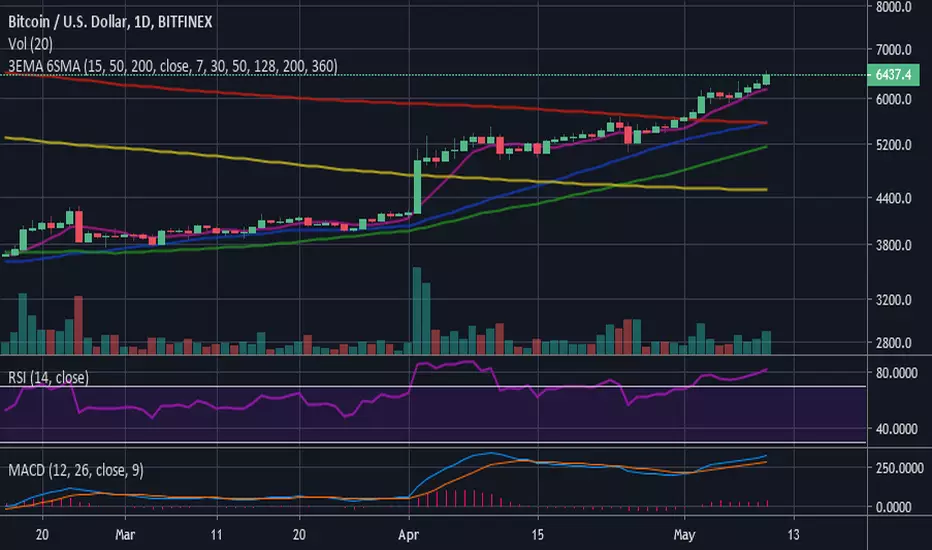
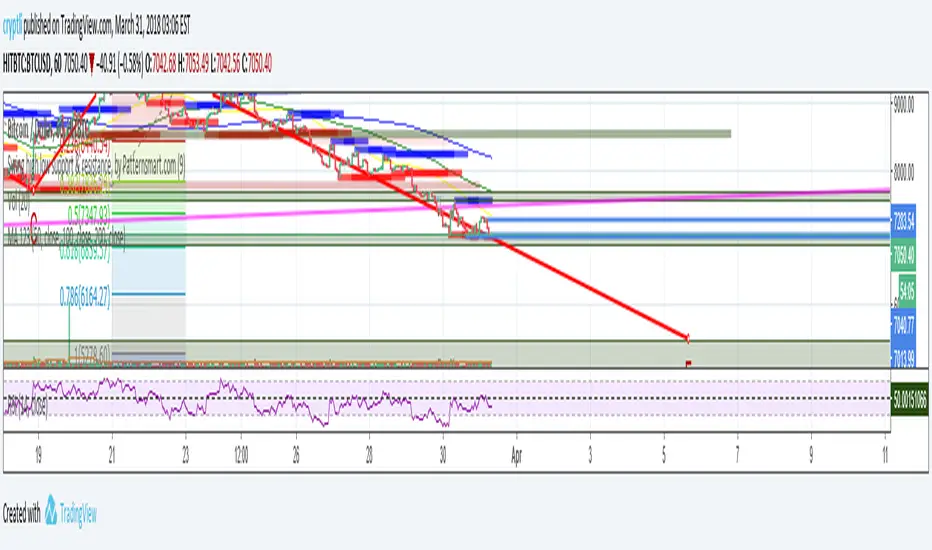
3 EMA (15-50-200) - 6 SMA (7-30-50-128-200-360)3 Moving Average Exponential - 6 Simple Moving Average . Crypto EMA - MA . 7 is a fast support or resistance, 15 confirmation support or resistance. 30 Important support and resistance . 50 institutional support or resistance. 200 institutional general trend, support and resistance , 360 general trend, support and resistance . The use of EMA or MA is according to your liking/trading plan
Cari dalam skrip untuk "情绪指数板块+约200只股票+选股规则"
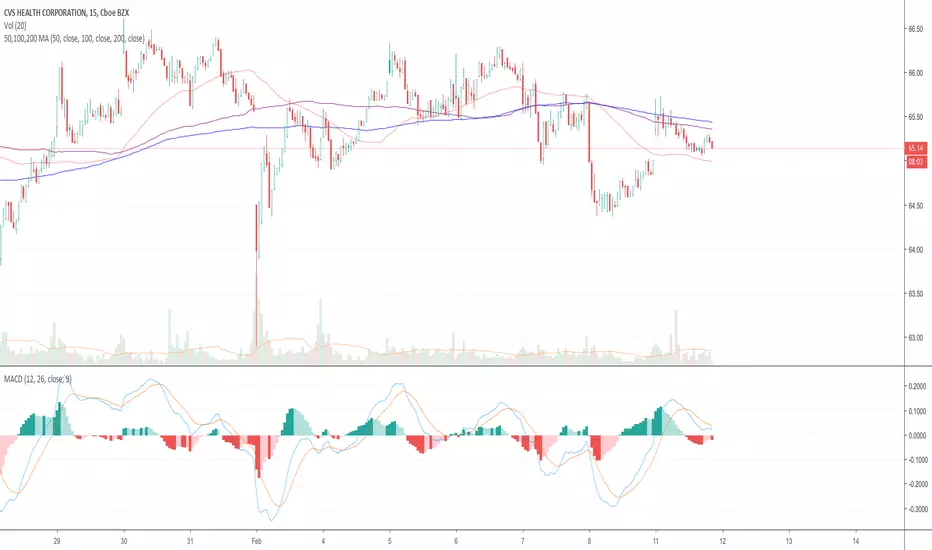
50,100,200 MA50, 100, and 200 simple moving averages in a single indicator. Fixed versions published by other members where 100 and 200 were plotted incorrectly and overlaying each other. Also removed close plot.
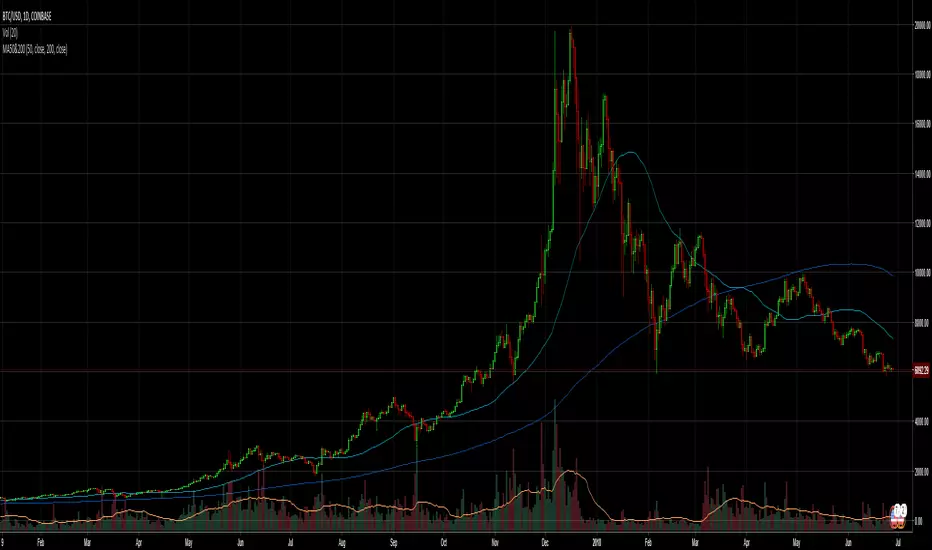
Moving Averages 50 & 200Moving Average Indicator for trading 50MA and 200MA crossovers (golden cross and death cross).
A golden cross is considered a bullish sign; it occurs when the 50-day moving average rises above 200-day moving average. A death cross is considered a bearish sign; it occurs when the 50-day moving average drops below 200-day moving average.
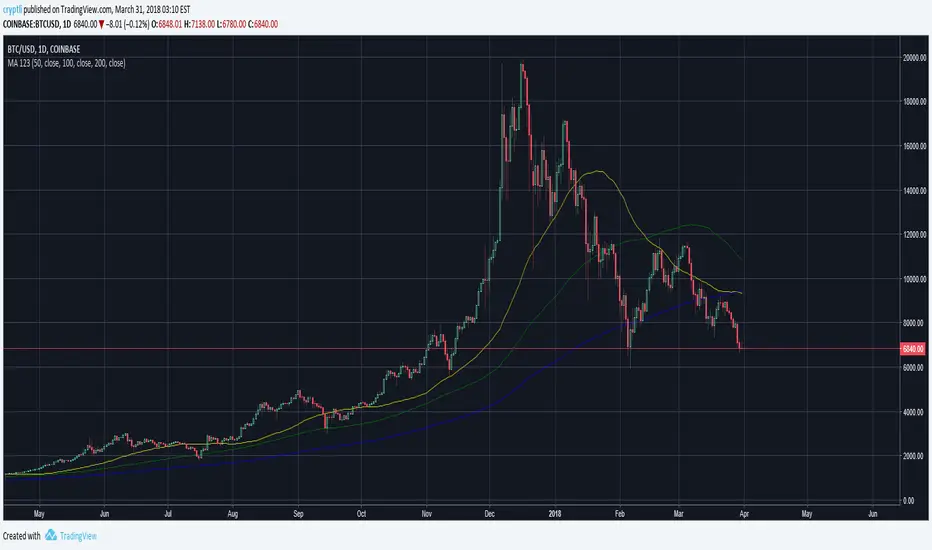
Moving Averages MA 50,100 and 200Just a simple collection of 3 most used Moving Averages 50,100 and 200
50=Yellow
100=Green
200=Blue
Moving Average 50,100 and 200Just a simple collection of 3 most used Moving Averages 50,100 and 200
50=Yellow
100=Green
200=Blue
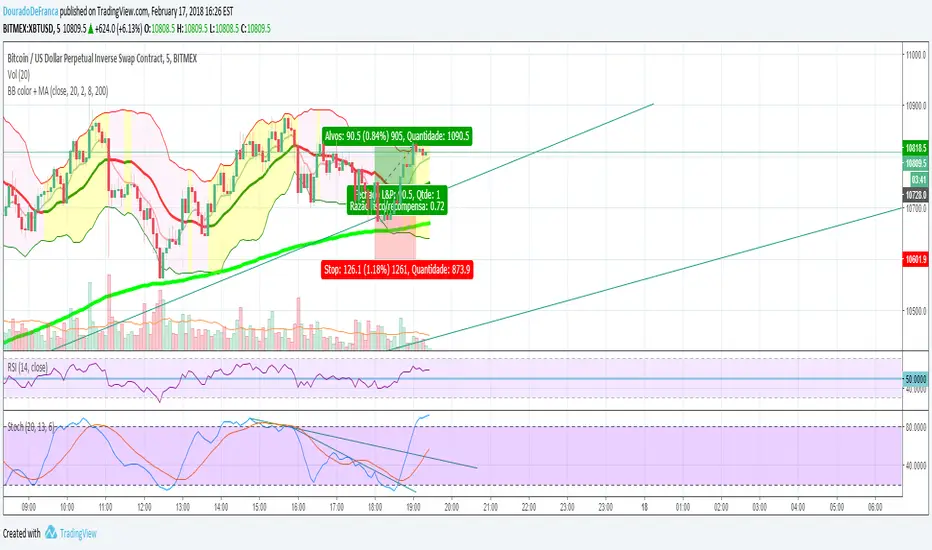
BB color 20+ EMA 8 and 200Bollinger e Emas.
Enquanto acima da EMA 200 apenas longs
Abaixo apenas shorts
O cruzamento da EMA 8 com grande volume indica reversão de tendencia
Posições abertas com as bandas de bollinger junto a EMA 200
Alerta de toque de la 200-Week SMACuando el precio toca la MMS de 200 semanas es una posible compra.

EMA (20, 50, 100, 200) incl. TIMEFRAME!Multi-Timeframe EMA Indicator
Indicator designed for TradingView that plots up to four distinct Exponential Moving Average (EMA) lines on your chart. The script is highly flexible, allowing you to configure each EMA's length and color individually. Additionally, it features a crucial timeframe parameter, which enables you to apply the EMAs from a different, higher timeframe directly to your current chart.
Key Features:
Four Independent EMAs : The indicator calculates and displays four separate EMA lines simultaneously. The default lengths are set to the popular values of 20, 50, 100, and 200, which are commonly used for short-term, medium-term, and long-term trend analysis.
Customizable Length and Color: You have full control over each EMA. In the indicator's settings, you can easily change the length of each moving average to suit your trading strategy. You can also customize the color of each line, making it easy to distinguish them on the chart.
Multi-Timeframe Analysis (MTF) : The most powerful feature is the timeframe parameter. By entering a different timeframe (e.g., "D" for daily, "W" for weekly, or "60" for hourly), the indicator will calculate the EMAs based on that specific timeframe's data, regardless of your chart's current resolution. This is invaluable for traders who want to see long-term trends on a short-term chart without having to switch timeframes.
50-100-200 MA Crosses with Priority (Open Source)Shows MA-EMA-WMA crosses with priority. Also has 2 additional customizable options you can add for scalping and such. It's an open source code so you can change 50-100-200 moving averages to your personal use by just changing the code.
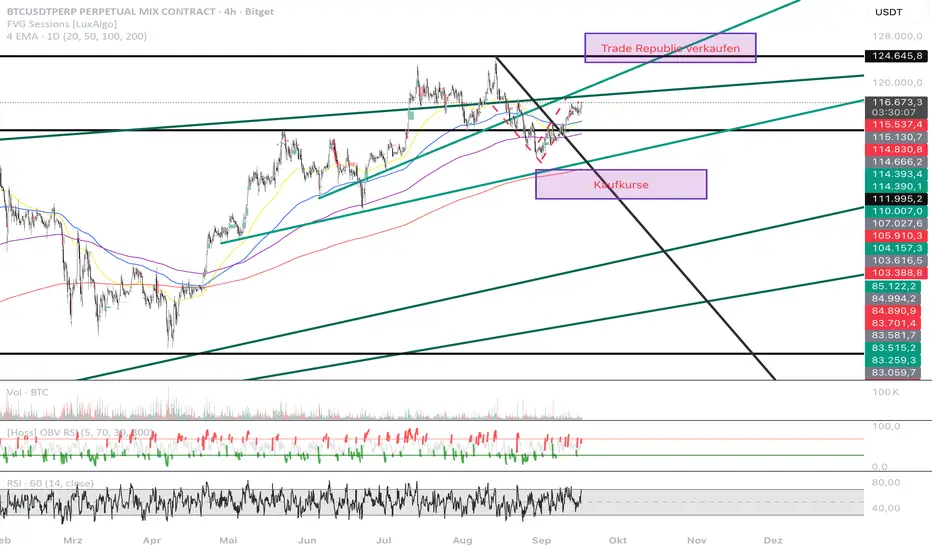
DH EMA 21/55/200 Ribbon (Scaled HTF)ema 21 / 55 /200 cập nhật thêm multiTF, chỉnh sửa màu sắc dải mây


EMA 200 HIGH LOWS - BIRMANO - A Pine Script v6 indicator plotting a smoothed cloud between EMA 200 of high and close prices, with dynamic colors (green/soft red) based on price position. Includes RSI (14) in a subpanel for confluence, with an ATR filter to hide the cloud during high volatility.

Moving Averages 7 & 15 & 50 & 100 & 200 & 400we can use 7 moving averages for one indicator.
base moving averages are 7, 15, 50, 100, 200 and 400.
it can be used for determining of trend
Higher High Close 3 Days & Price ±5% 200 EMAScript by Raj Natarajan V 1
This script identifies stocks that are within +/- 5% of the 200 day EMA and within that sub-set, it identifies stocks that have had three consecutive days of higher highs.

EMA band 12/60/150/200EMA band consisting of 12/60/150/200
Specifically for Indian stock market, can be used for other trading scripts after testing.
Best use case : on Daily TF.
Bull run entry criteria, Not bear market or Bottom catching.

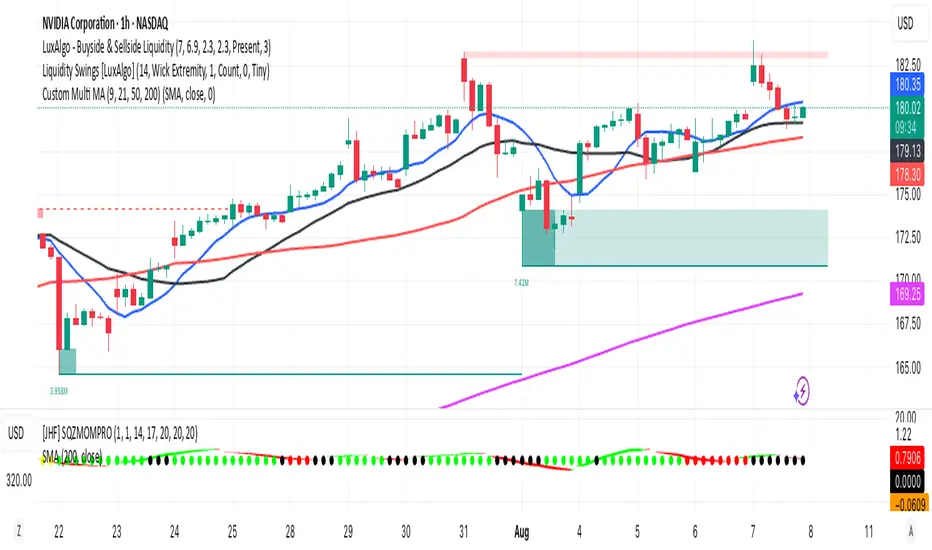
Multi MA (9, 21, 50, 200)This indicator plots four commonly used moving averages — 9, 21, 50, and 200 — with customizable smoothing methods and color-coded lines optimized for visibility on any chart background.
EMA 10/20/50/100/200plot 10, 20, 50,100,200 EMA on the chart. can be used to determine on any timeframe EMA
MTF 200MULTI TIME FRAME 200MA
TIMEFRAME
1m 5m 15m 30m 60m 240m 1D
200 SMA
Check the chart for 200ma you were looking at a candle at a certain time

TOMOs EMA (9, 20, 200) & VWAPThis indicator includes the 9, 20, 200 EMAs and VWAP all in one chart. best to be used on 1m, 5m, 1D timelines.

EMA 10,20 SMA 50, 200This indicator is very helpful for swing traders who plan their trades using EMAs and SMAs. It is used on the daily chart and displays the 10- and 20-EMA, as well as the 50- and 200-SMA.

EMA 20/50/200 - M3EDGE Clean Mode™The M3EDGE Clean Mode™ indicator is designed to spot the cleanest, most aligned market phases.
It filters out market noise and highlights only the high-probability trending zones where the odds are in your favor.
How it works:
• Tracks 3 key EMAs (20, 50, 200)
• Confirms directional alignment across short, medium, and long-term trends
• Colors optimal market phases to identify high-probability setups
• Optional display of the dynamic EMA50/EMA200 zone to visualize the trend’s core
Purpose:
🎯 Avoid choppy, sideways market conditions
🎯 Focus only on smooth, directional price moves
🎯 Reduce false signals and improve chart clarity
Best use cases:
• Ideal for scalping, day trading, and swing trading
• Works on all markets: indices, commodities, forex, crypto
• Perfect when combined with macro analysis and other M3EDGE™ setups
💡 Pro tip: The M3EDGE Clean Mode™ isn’t just another indicator — it’s a quality filter that keeps you out of messy conditions. When it lights up, you know the road ahead is clear.

Color Change EMA 200 (3 Min)- EMA 200 locked on 3 minute time frame
- Color changes red when bearish, and green when bullish.
