Cari dalam skrip untuk "情绪指数板块+约200只股票+选股规则"

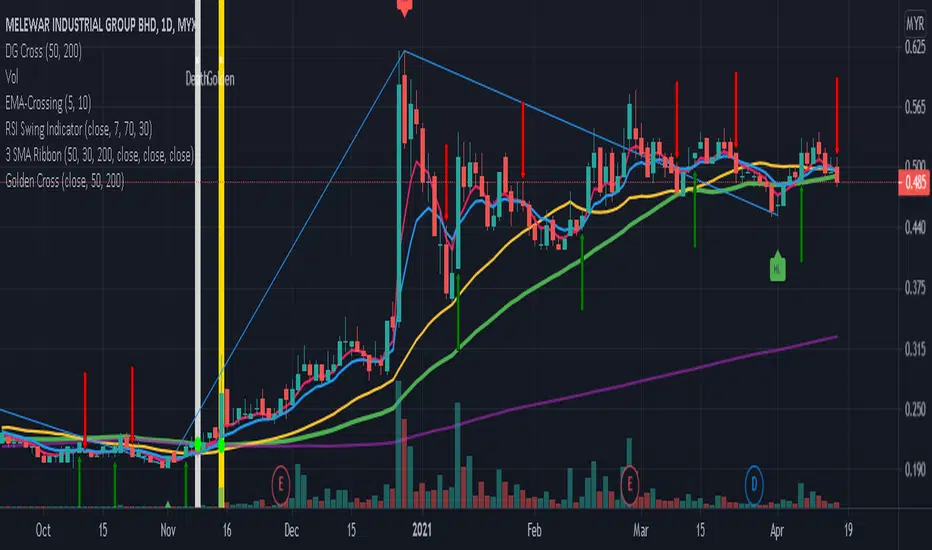
Golden & Death Cross SMA 50 Cross SMA 200 Alert by pakmanGolden & Death Cross SMA 50 Cross SMA 200 Alert by pakman
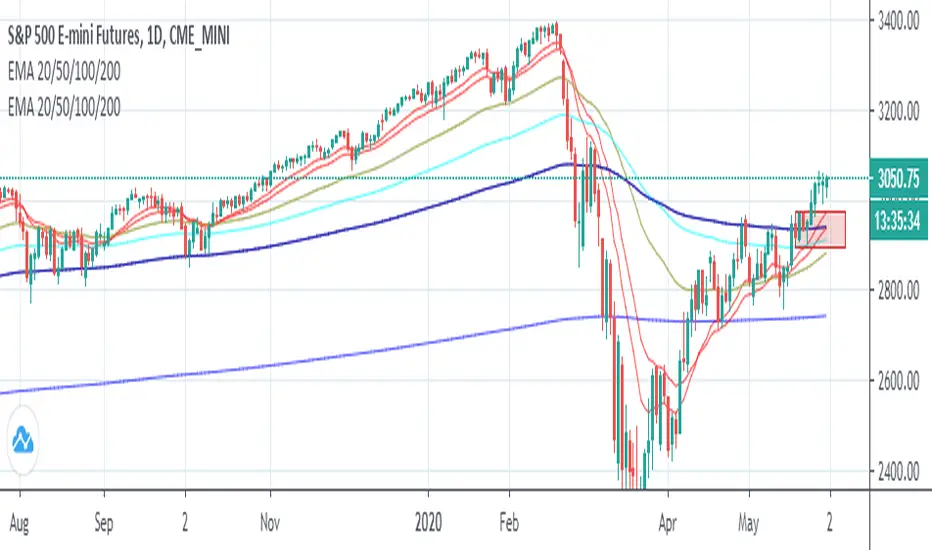
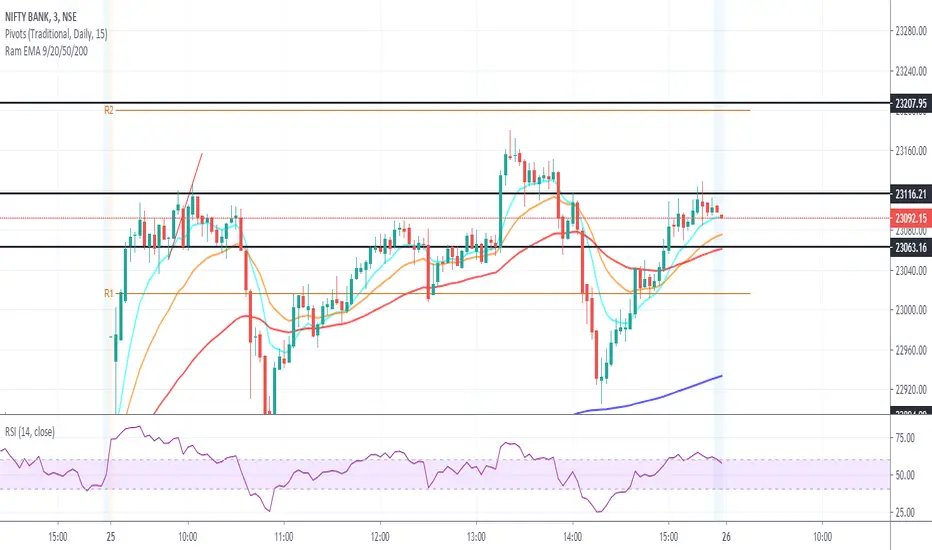
EMA 9/15/65/200exponential moving average (EMA) at 9, 15, 65 and 200 days
An exponential moving average (EMA) is a type of moving average (MA) that places a greater weight and significance on the most recent data points. The exponential moving average is also referred to as the exponentially weighted moving average. An exponentially weighted moving average reacts more significantly to recent price changes than a simple moving average (SMA), which applies an equal weight to all observations in the period.

CCI 20-200CCI // Period 20. Overbought oversold level 200,-200. Visual confirmation of the intersection of overbought and oversold levels.

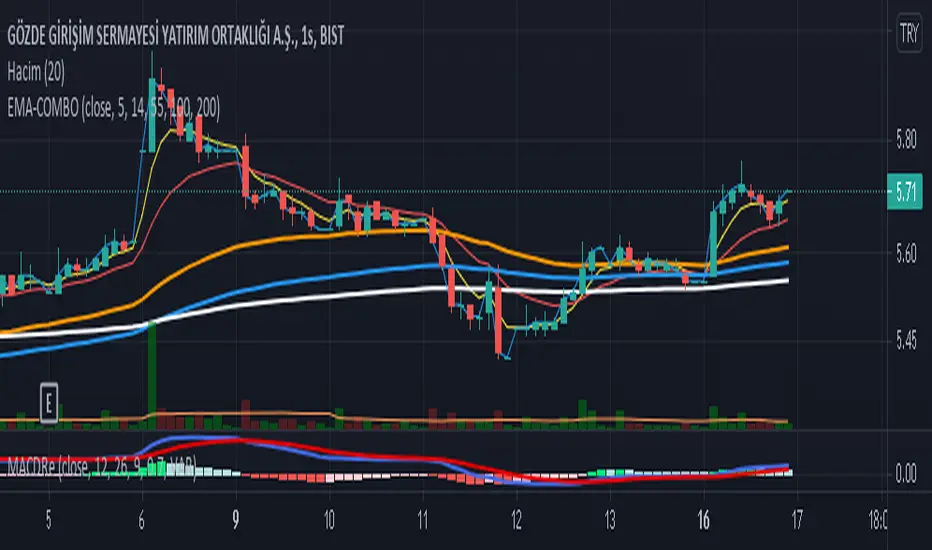
EMA Cross 9,21,50,80,200 + Inside barEste script faz o seguinte:
1. Plota 5 EMAs (9,21,50,80,200)
2. Faz crossover da 9x21 e 21x50
3. Colore inside bar em amarelo (é possível ainda colorir diferentemente bullish e bearish inside bar)

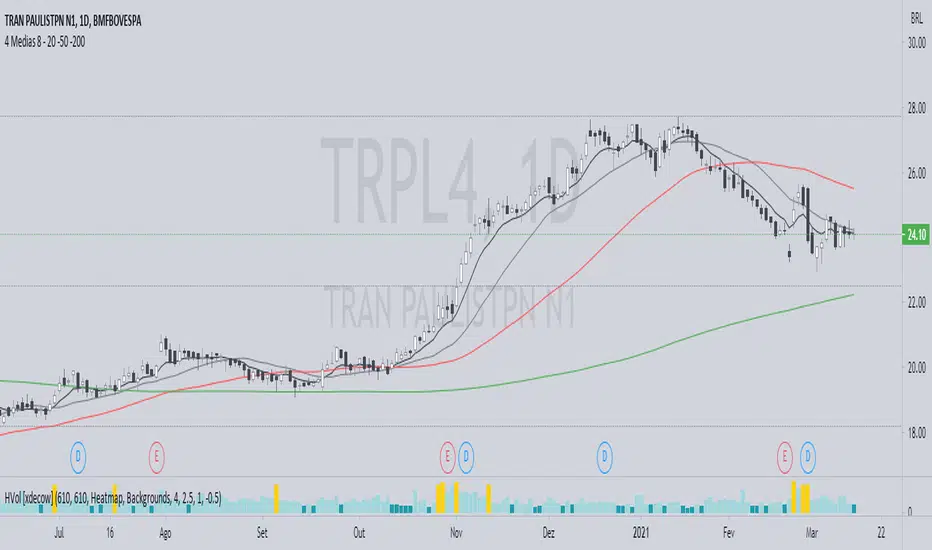
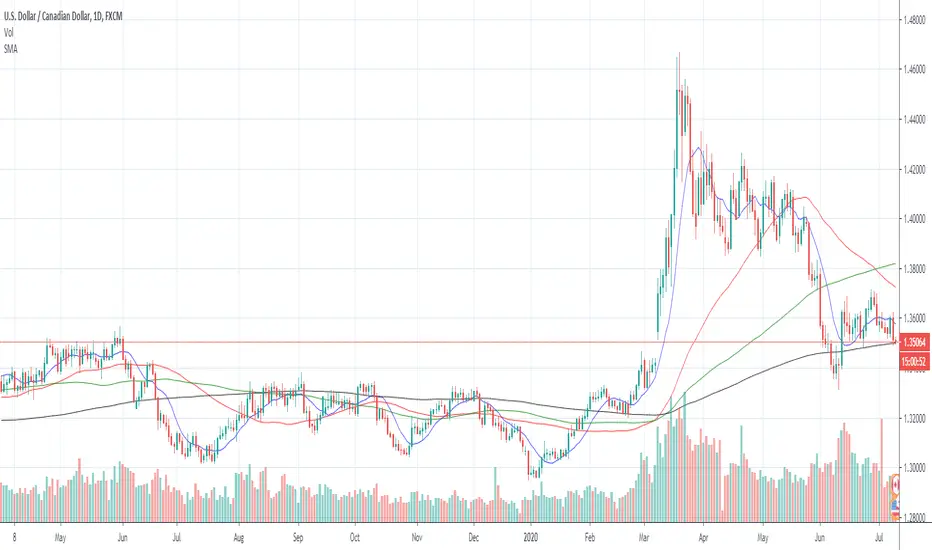
Simple Moving Average (5,10,20,30,50,100,150,200,250)Simple Moving Average (5, 10, 20, 30, 50, 100, 150, 200, 250)
For those who want a combo of simple moving average
You can edit the color of each line when in use
Fibonacci Trendlines 20, 50, 100, 200 (SMA)Dört tane simple moving average bir arada. 20, 50, 100, 200 (SMA) hareketli ortalamaları içerir

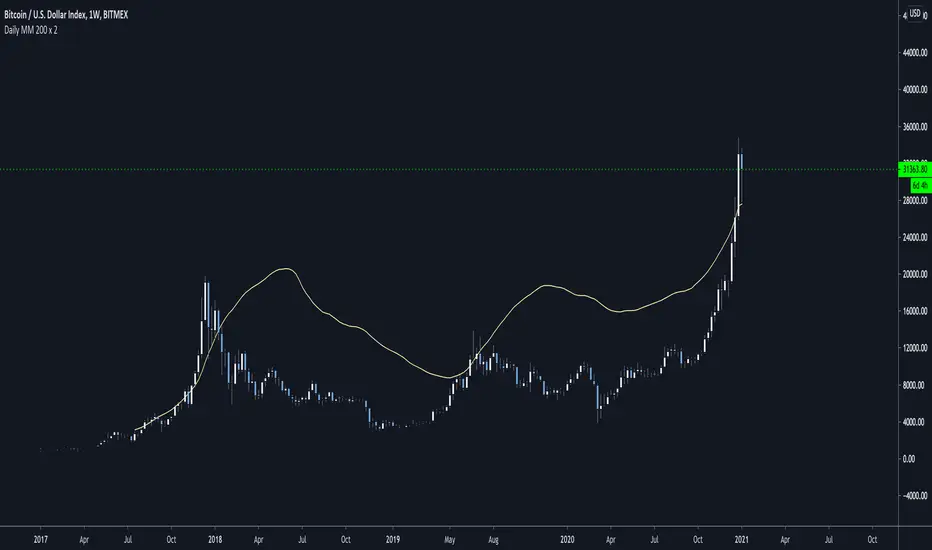
Daily MM 200 x 2This is the Daily Moving Average 200 multiplied by 2.
It will remain fixed across timeframes and its used to evaluate the asset fair price when its overbought and going parabolic
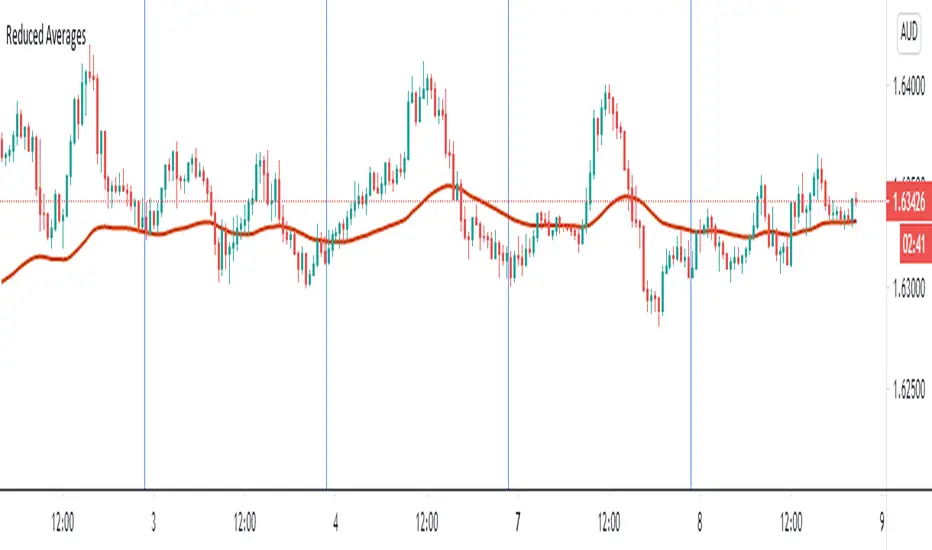
Reduced Averages (20,50,100,200)This script simply takes average value of exponential averages with a goal of reducing the noise on your chart. Many traders use a bunch of averages to identify a trend as they perfectly line up. Reduced Averages does just that. When price is close to a central line, you can comfortbly switch to another chart. When you see it deviating further away, you can enable 20 EMA, 50 EMA, 100 EMA and 200 EMA with a single click.
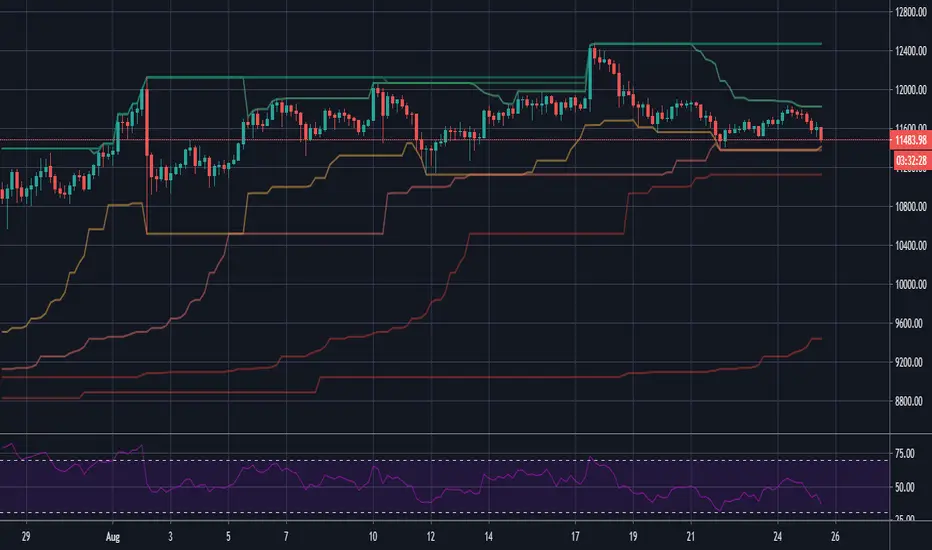
MinMax(20,50,100, 200)Draws minimum and maximum prices as a line chart for four different time frames.
1) The last 21 bars (close price)
2) The last 50 bars (close price)
3) The last 100 bars (close price)
4) The last 200 bars (close price)
Min/ Max values usually provide important resistance/ support levels.
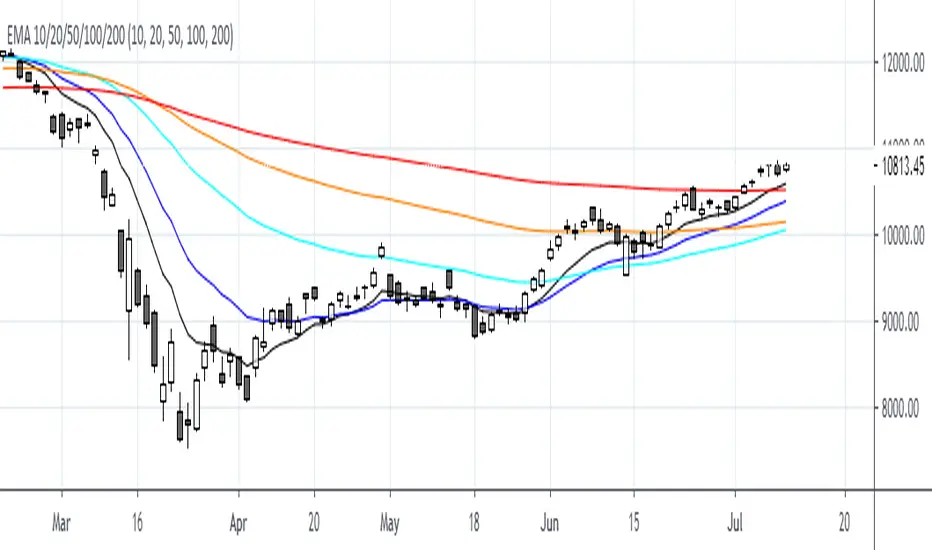
EMA 10/20/50/100/200First Thank you very much "TradingView" for providing such a Wonderful plateform.
Also very thankful to all TradingView's known & unknown authors who provides superb learnings.
EMA 10/20/50/100/200
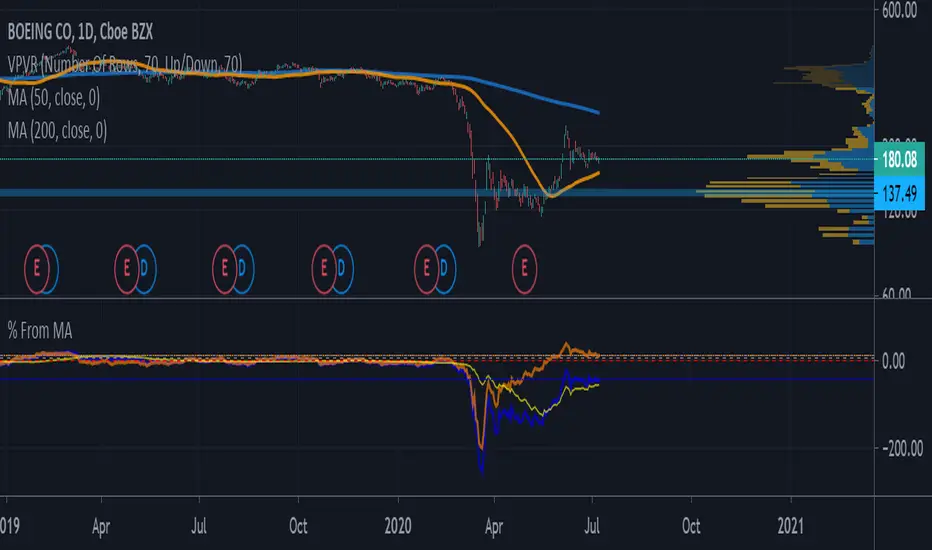
Percent difference from 50 & 200 day MAsTo chart price relative to 50 and 200 day SMAs and to use the difference between those metrics as an indicator of bull or bear market and potential turnarounds.
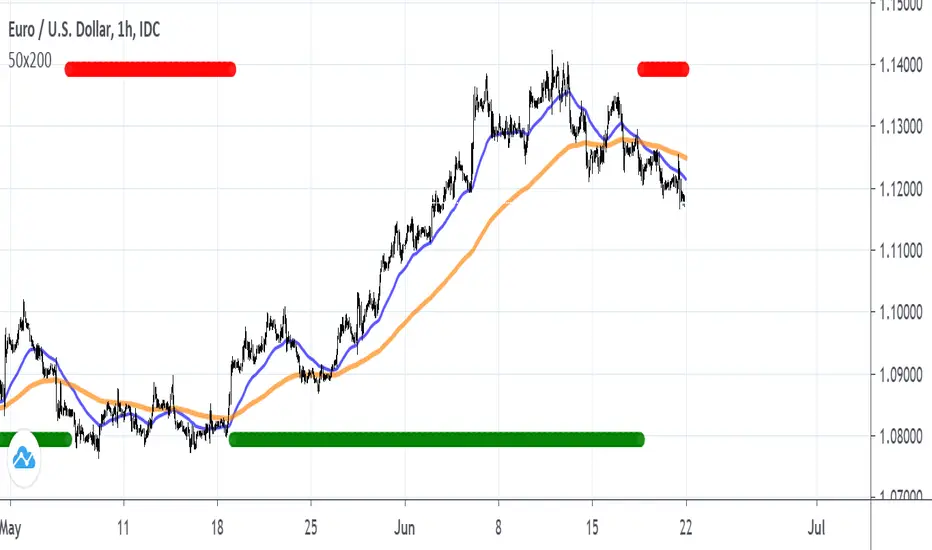
EMA 50 cross 200 with Strong TrendEMA 50 cross 200 with Strong Trend
Just Buy when Green apears and close it when disapear.
and
Just Sell when Red apears and close it when disapear.
if you combine with upper Time Frame , it will be supper decision
Good Luck

EMA 13/50/200/800Candle close below the 13 ema or above is entry singal for sell and buy respectively.
After a bounce off the 50,200 and 800 then a confirmation with the 13 ema