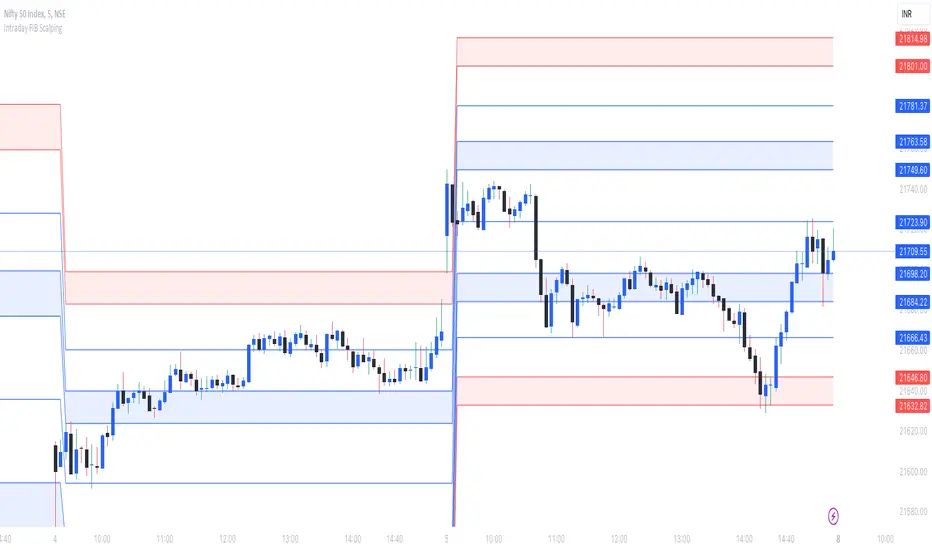
Intraday FIB ScalpingThe Intraday Fibonacci Levels Indicator is a powerful tool designed to enhance trading decisions in intraday markets. Leveraging the dynamic nature of Fibonacci retracement levels, this indicator utilizes the high and low prices observed within the first 15 minutes of the trading session to plot key levels and establish potential entry and exit zones.
Key Features:
Automatic Calculation: The indicator swiftly calculates Fibonacci retracement levels based on the highest high and lowest low recorded during the initial 15 minutes of the trading day. This ensures a quick and accurate representation of potential support and resistance levels.
Zone Marking for Precision: The indicator marks specific zones on the chart, providing traders with clear visual cues for potential entry and exit points. These zones are strategically aligned with Fibonacci levels, offering a systematic approach to decision-making.
User-Friendly Interface: With a user-friendly interface, the Intraday Fibonacci Levels Indicator is suitable for both novice and experienced traders. The intuitive design allows for easy interpretation of signals and levels.
By harnessing the power of Fibonacci retracement levels and incorporating them into an intraday context, this indicator empowers traders with a systematic and data-driven approach to decision-making. Whether identifying entry points, setting stop losses, or planning exit strategies, the Intraday Fibonacci Levels Indicator serves as a valuable ally in navigating the complexities of intraday trading.
How to Trade using these Levels?
With this indicator, you can see all the levels between whole number and its corresponding 0.272 were highlighted. That is where we need to look for intraday trade entry. If any of the level broken on either side and the bar closes below ore above the highlighted area, we should enter the trade in that direction with immediate next FIB level as TP1 and subsequent level as TP2. And, an opposite directional close above or below the highlighted level will be considered as stop loss exit.
We prefer to trade in 3 minutes or 5 minutes timeframe for intraday trading.
How we plot the levels?
We are incorporating ORB into Fibonacci to plot intraday trading levels. We use high and low of first 15 minutes candle of each new trading session to arrive the levels for that session.
When market is trading above or below initially plotted levels, user can extend the levels by enabling extentions provided in user settings
Cari dalam skrip untuk "机械革命无界15+时不时闪屏"
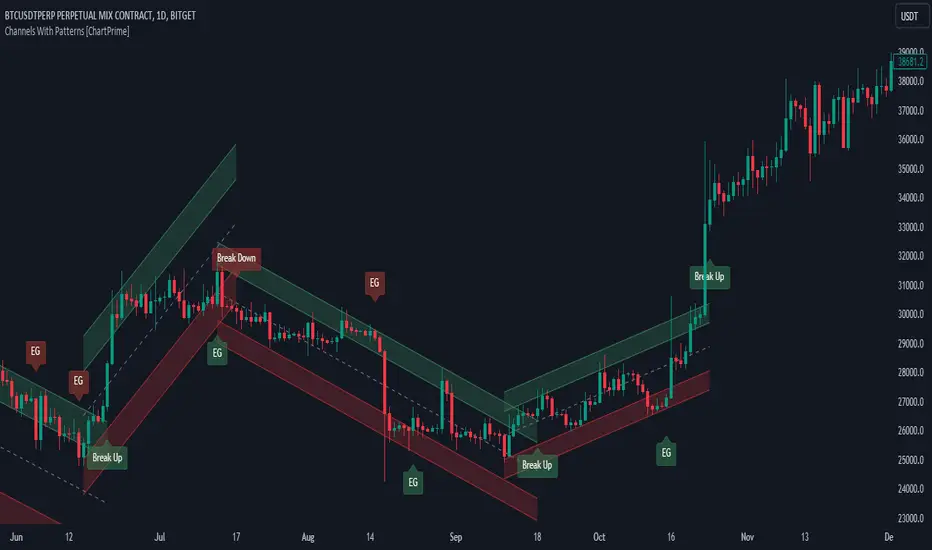
Channels With Patterns [ChartPrime]The Channels With Patterns indicator is an attempt at minimizing the delay in forming a trend channel. This indicator uses a single pivot in conjunction with a smooth version of the price to estimate the direction of an emerging trend. Using ATR, this indicator estimates the volatility of the new trend by adjusting the channel size by a multiple of the current ATR.
One of the biggest complains for any trend indicator is that it takes too long to create a channel or trend line. This indicator estimates the trend channel by checking if the price is moving in the correct direction and then it projects the channel from a single pivot. To allow for some margin of error, this script uses an offset to help center the channel.
This offset is generated from the ATR at the time of formation. In conjunction with forming estimated trend channels, this indicator features select candle stick patterns. These candle stick patterns are filtered by location in the formed trend channel. If the price is within an extremity of the trend channel it will appear. Filtering classical vanilla candle stick patterns using this methodology can result in some interesting results and possible confluence points for traders. For example; a bearish hammer appearing when filtered in an upper zone might add an extra level of realtime unique confluence traders.
Traders can use this script as a general trend line indicator that is a bit more forward looking than others, or it can be used it as its full blown trend channel estimator. Due to the fact that this is an estimate using the minimum possible information to make the channel, its accuracy will not always be perfect and can suffer compared to alternative methods.
When configuring the indicator it is important to understand the role of each input. Here is a description of all of the settings provided:
Presets (`preset`): This input allows users to quickly configure the indicator based on the market they are trading in. Selecting "Stocks," "Forex," or "Crypto" automatically adjusts various parameters to settings deemed optimal for these markets. The "User" option lets traders manually configure settings for a more personalized approach.
Style (`style`): This setting determines how pivot points are calculated. "Wick" uses the high and low of candlesticks (including wicks), which can be more sensitive to market extremes. "Body" uses only the open and close prices (the body of the candlesticks), potentially offering a more stable pivot point calculation.
Break Style (`break_style`): This option defines what price is used to determine if a channel has been broken. "Close" uses the closing price of a candlestick, while "High/Low" uses the highest and lowest prices. This affects how channel breaks are identified and can influence trading signals.
Instant Mode (`instant`): When enabled, this feature allows the indicator to form channels more quickly by initiating them as soon as potential formations are detected. This can provide earlier signals but may increase the risk of false positives.
ATR Length (`atr_length`): This input sets the period for the Average True Range (ATR), a common volatility indicator. A longer ATR period may smooth out the channel but could delay responsiveness to market changes. A shorter period might make the channel more responsive but potentially more erratic.
Offset Center (`offset`): Adjusts the vertical positioning of the channel. This can help in aligning the channel more accurately with the price action, depending on market conditions and personal trading strategies.
Size (`atr_multiplier`): Alters the channel's size relative to the ATR. A higher multiplier makes a wider channel, which might be useful in more volatile markets. A lower multiplier tightens the channel, which could be better for less volatile conditions.
Padding % (`padding`): This setting adjusts the padding within the top and bottom quarters of the channel. It essentially fine-tunes the channel's sensitivity to price movements near its boundaries.
Pivot Length (`pivot_length`): Determines the number of bars used to calculate pivot points. A longer length may provide more significant pivot points but can reduce the number of channels formed.
Pivot Look Forward (`look_forward`): Sets the number of bars to look forward in the pivot calculation, affecting how quickly the channel adapts to new pivots.
Average H/L Length (`avg_length`): Controls the smoothing of the high and low prices used in the channel calculation. A longer average length can lead to smoother, more gradual channel slopes.
Enable Hammer (`enable_hammer`): When enabled, the indicator will highlight Hammer candlestick patterns, which are often considered bullish reversal indicators.
Enable Inverted Hammer (`enable_ihammer`): This toggles the display of Inverted Hammer patterns, typically viewed as potential bullish reversal signals.
Enable Bullish Engulfing (`enable_bullish_engulfing`): Enables the identification of Bullish Engulfing patterns, another type of bullish reversal indicator.
Enable Bearish Engulfing (`enable_bearish_engulfing`): When activated, this highlights Bearish Engulfing patterns, which are often interpreted as bearish reversal signals.
Extend Channel (`extend`): This option, when enabled, extends the drawn channels forward until they are either broken or a new channel is formed.
Show Break Label (`show_break_label`): Toggles the display of labels indicating where the channel has been broken, providing visual cues for potential trade entries or exits.
Channel History Length (`history_length`): Determines how many historical channels are displayed on the chart. This can be useful for analyzing past performance and patterns.
Channel Colors (`top_color`, `bottom_color`, `center_color`): These settings allow customization of the channel's appearance by setting the colors of the top, bottom, and center lines.
Line Transparency (`line_trans`): Adjusts the transparency of the channel lines, helping to balance visibility with chart readability.
Center Line Transparency (`center_trans`): Specifically sets the transparency level of the center line of the channel.
Channel Fill Transparency (`fill_trans`): Modifies the transparency of the filled areas between the channel lines, which can enhance chart clarity and focus on the price action.
Break Colors (`break_up_color`, `break_down_color`): Sets the colors for labels that appear when the channel is broken, either upwards or downwards.
Break Label Text Color (`text_color`): Determines the color of the text in the break labels, enhancing readability based on the chart's background and color scheme.
Candle Pattern Colors (`h_color`, `ih_color`, `bullish_engulfing_color`, `bearish_engulfing_color`): These inputs allow for the customization of the colors used to highlight various candle patterns on the chart.
Candle Pattern Text Color (`candle_text_color`): Sets the color of the text for labels associated with candle pattern indicators.
Alerts (`new_channel_alert`, `break_alert`, `hammer_alert`, `ihammer_alert`, `bullish_engulfing_alert`, `bearish_engulfing_alert`): These toggles enable or disable alerts for different events, such as the formation of new channels, channel breaks, or the appearance of specific candle patterns. This feature is crucial for traders who rely on timely notifications for potential trading opportunities.
We have provided a few presets to allow you to get a feeling for how the indicator works with different settings easily. Here is a description of the settings used in each preset:
Stocks Preset:
Style: "Wick"
Break Style: False (High/Low)
Instant Mode: True
ATR Length: 10
Size (ATR Multiplier): 4
Pivot Length: 10
Pivot Look Forward: 15
Average H/L Length: 18
Forex Preset:
Style: "Wick"
Break Style: False (High/Low)
Instant Mode: True
ATR Length: 100
Size (ATR Multiplier): 5
Pivot Length: 10
Pivot Look Forward: 15
Average H/L Length: 18
Crypto Preset:
Style: "Wick"
Break Style: False (High/Low)
Instant Mode: True
ATR Length: 10
Size (ATR Multiplier): 4
Pivot Length: 10
Pivot Look Forward: 15
Average H/L Length: 18
This script first starts by defining and collecting the relevant data for the main body of the code with data(). This generates the pivot data, the levels, the ranges, the averages, the deltas, and finally the candle sticks. Once there is a higher low, or lower high detected via the pivots and the current price it triggers the formation of the new channel. It takes the delta between the last pivot and the current average price and projects the trend channel using this delta. If the price exceeds the extremities of the channel it will classify this as a break from the estimated structure and begin looking for a new channel. The idea is that when trending, the price will oscillate between extremities as defined by a range and direction. If the price is inside of one of these extremities the script will look for candle stick patterns. This is how the script operates.
On a more technical level, this script is meant to showcase Pine Script's custom types and methods. We have made use of a properties pattern allows functions to use a minimal number of arguments. This allows you to add new inputs without modifying a string of functions. The use of methods and data structures allows the main body of the code to be easy to understand and for the script as a whole to be easily modified. We have made sure that the script is modular so that users can incorporate this into their own custom scripts. It should be easy to expand on this script as the main logic is fairly compact and open for easy modification. All features are packed into their own function for easy use elsewhere. This is particularly evident in the candle stick section. I have simplified the process of creating candle stick patterns by creating a type. All users have to do is make methods for this type.
candle()=>
polarity = open < close
body_top = math.max(open, close)
body_bottom = math.min(open, close)
body_range = body_top - body_bottom
top_wick = high - body_top
bottom_wick = body_bottom - low
average_body = ta.ema(body_range, 14)
average_top_wick = ta.ema(top_wick, 14)
average_bottom_wick = ta.ema(bottom_wick, 14)
has_body = body_range != 0
has_top_wick = top_wick != 0
has_bottom_wick = bottom_wick != 0
above_average_body = body_range > average_body
above_average_top_wick = top_wick > average_top_wick
above_average_bottom_wick = bottom_wick > average_bottom_wick
candle_data.new(
polarity
, body_top
, body_bottom
, body_range
, top_wick
, bottom_wick
, average_body
, average_top_wick
, average_bottom_wick
, has_body
, has_top_wick
, has_bottom_wick
, above_average_body
, above_average_top_wick
, above_average_bottom_wick
)
In conclusion, this script offers a blend of rapid trend channel formation and candlestick pattern recognition, making it a unique tool for traders looking for a more proactive approach to trend analysis.
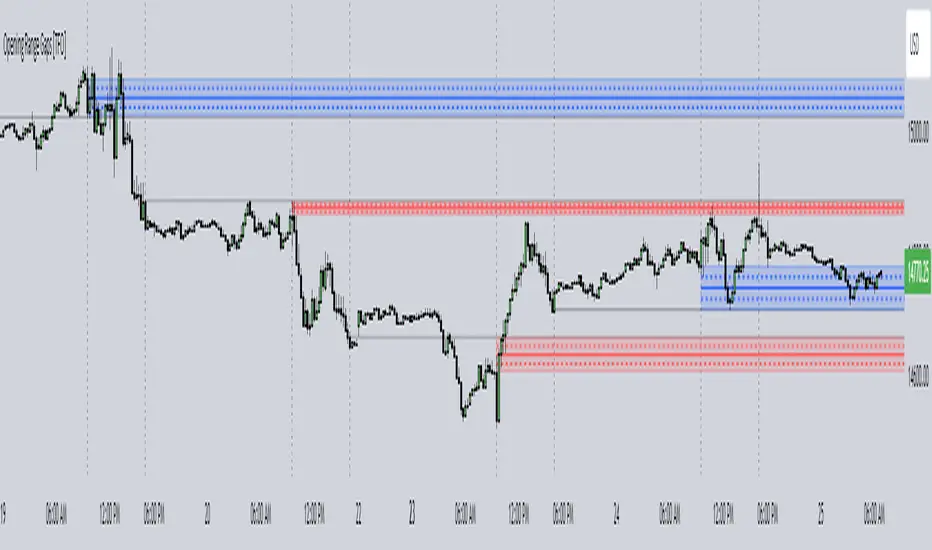
Opening Range Gaps [TFO]This indicator displays Opening Range Gaps with an adjustable time window. Its intention is to capture the discrepancy between the close price of previous and new Real Trading Hours (RTH) sessions, i.e. yesterday's close compared to today's open. A gap will be drawn from this area with a solid line denoting its midpoint, and dashed lines denoting the upper and lower quartiles of its range. Its color is determined by whether the new session open price is above or below the previous session close.
The Gap Session parameter allows users to define the specific time window for which to capture the "gap" in price. Using U.S. index futures as an example, we can use 16:00 - 09:30 (EST) to capture the discrepancy between the previous day's close price and the current day's open price. However, this parameter is left as adjustable for users that may want to observe different markets or simply experiment with different time windows.
Show Session Delineations will draw vertical timestamps denoting the start and end times of the provided Gap Session. Track Start Price serves as a visual aid to track the initial price of the Gap Session until its end price is validated, for easy visual verification of a gap's upper and lower bounds. With both options turned off, the indicator will only display the gap boxes and lines, as shown here:
Extend Boxes will draw all gaps with an indefinite extension to the right. This can get messy with a large number of boxes, which is why we have a Keep Last parameter to limit how many sessions' drawings should be stored. Any drawings that were made beyond this number of sessions in the past will automatically be deleted.
The Timeframe Limit will dictate that the indicator as a whole will only draw objects on timeframes less than or equal to this timeframe, determined by the user. In some cases this may help users avoid resolution errors which may arise from using timeframes that are too large for a given session. For example, if a user wanted to track a Gap Session of 16:15-09:30, the Timeframe Limit should be set to 15 minutes because the close price at 16:15 cannot be observed on a 30 minute chart (or greater).
Strong Pullback Indicator [Rami_LB]Strong Pullback Indicator
Description:
The Strong Pullback Indicator is designed to identify potential pullbacks or even trend reversals by utilizing a specific candlestick pattern in conjunction with the Relative Strength Index (RSI). It is advised to employ this indicator in chart intervals of 15 minutes or higher, as intervals below 15 minutes may generate excessive false signals.
Working Mechanism:
Upon detecting the designated candlestick pattern, the indicator examines whether any of the last five candles exhibit RSI values below 30 or above 70 across at least four distinct time intervals, depending on whether the pattern is bullish or bearish. The RSI calculations incorporate eight different intervals: 1 minute (1m), 5 minutes (5m), 15 minutes (15m), 30 minutes (30m), 1 hour (1h), 2 hours (2h), 4 hours (4h), and 1 day (1d). An arrow is rendered above or below the current candle only when these conditions are met.
Users have the option to adjust the number of overbought or oversold intervals, as well as the general settings for the RSI.
SL/TP Lines:
The indicator can also serve as a trade signal to initiate trades in the opposite direction. To evaluate the potential success of a trade in a backtesting scenario, SL (Stop Loss) and TP (Take Profit) lines can be displayed on the chart. The SL is calculated by taking the distance from the close of the current candle to the high/low of the previous candle and multiplying it by 2.
In the settings, you can alter the Risk Reward Ratio (RRR) of the trade. Given the pullback nature of this indicator, a RRR of 1:1 is deemed logical, thus set as the default value.
Bullish vs. Bearish Candle Counter:
An additional feature of this indicator is its ability to analyze the last 100 candles to ascertain the ratio of bullish to bearish candles. When a 60% threshold is reached, the chart background color alters accordingly. This feature was conceived after a thorough analysis of over 50,000 candles of a currency pair revealed nearly identical counts of bullish and bearish candles, suggesting a market tendency to maintain this balance.
Within the settings, you have the flexibility to modify the number of candles to be analyzed and the percentage threshold for each candle type.
Should you have any ideas on how to enhance the accuracy of this indicator, or suggestions for other indicators that could improve the signals, feel free to leave a comment.

RSI + Fibonacci HH LL Support Resistance I have integrated my past scripts and brushed them up further.
This tool allows for support/resistance, stop loss, take profit, and trend analysis using RSI and Fibonacci ratios.
For example, the Fibonacci ratio is used as follows
l1 = m - dist * 0.618
l2 = m - dist * 1.618
l3 = m - dist * 2.618
l4 = m - dist * 4.235
l5 = m - dist * 6.857
l6 = m - dist * 11.089
When the Fibonacci ratio reaches 2.618 or higher and the RSI smoothed by the 5-day EMA is oversold/overbought, the bar color is changed by a gradation.
We have tried to make the design as beautiful and good-looking as possible. You can also hide the lines to suit your own preference.
Example usages are here:
BTCUSDT 1Hour Chart
Using Fibonacci numbers
BTCUSDT 15min Chart, for Scalping
Here, to set the highest and lowest prices one hour ago, "4" is substituted as the calculation: 15 minutes x 4 = 60
BTCUSDT 15min Chart, for Scalping
To set the highest and lowest prices 4 hours ago , "4" is substituted as the calculation: 15 minutes x 16 = 240
BTCUSDT 15min Chart, for Scalping
To draw yesterday's high and low as support/resistance lines, I substituted the number "96" as 1440/15=96.
BTCUSDT 1min Chart, for Scalping
Substituted "60" to trail the highest and lowest prices over a 60-minute period on a 1-minute chart, and removed lines to beautify
BTCUSDT 1day Chart, for Long-Term Investers
This is an example of using "90" because it is a 1-day chart and assumes that 3 months = 90 days in order to trail the highest and lowest prices over a 3-month period and no lines.
My past scripts are here:
RSI + FIB HH LL StopLoss Finder/Contrarian Trades
Fibonacci HH LL TRAMA Band

Incomplete Session Candle - Incomplete Timeframe Candle Marker The "Incomplete Session Candle - Incomplete Timeframe Candle Marker" is an advanced tool tailored for technical analysts who understand the importance of accurate timeframes in their charting. While the indicator is not limited to the Indian market, its genesis is rooted in the nuances of trading sessions like those in India, which span 375 minutes from 9:15 AM to 3:30 PM.
Key Features:
Detects if the current timeframe is intraday (minutes or hours).
Calculates the expected duration of the candle for the chosen timeframe.
Highlights candles that don't achieve their expected session duration by placing a cross shape above the bar.
Compatible across various intraday timeframes, aiding traders in spotting discrepancies promptly.
Why We Made This: Not Just for India:
While we looked at the Indian market, this indicator works everywhere. Regular timeframes like 30 minutes, 1 hour, and 2 hours often end with incomplete candles, especially at the end of the trading day. For example:
A 30-minute timeframe makes 13 candles, but the last one is only 15 minutes long.
A 1-hour timeframe shows 7 candles, but the last one is just the last 15 minutes.
By switching to different timeframes like 25 minutes, 75 minutes, and 125 minutes, you get more complete information for better trading decisions. Learn more about this in our article: "Power of 25, 75, and 125-Minute Timeframes in the Indian Market", recognized by Trading View's Editors' Pick.
Benefits:
The indicator extends its benefits even to users without access to certain timeframes. It accommodates traders using a 1-hour timeframe (pertaining to Indian traders). By employing this indicator, traders consistently remain mindful of incomplete candles within their chosen timeframe
For those who utilize concepts like RBR, RBD, DBR, and DBD, this indicator is paramount. An incomplete candle can skew analysis, leading to potential misinterpretations of base or leg candles.
Final thoughts:
In markets like the Indian stock market, adopting such a tool is not just beneficial, but necessary. Whether you have access to unconventional timeframes or are using traditional ones, recognizing and accounting for the limitations of incomplete candles is critical & it's important to know if your candles fit the timeframe properly. This indicator gives you a better view of the market, which helps you make smarter trades.
Lastly, Thank you for your support! Your likes & comments. If you want to give any feedback then you can give in comment section.
Let's conquer the markets together!

ICT Silver Bullet [LuxAlgo]The ICT Silver Bullet indicator is inspired from the lectures of "The Inner Circle Trader" (ICT) and highlights the Silver Bullet (SB) window which is a specific 1-hour interval where a Fair Value Gap (FVG) pattern can be formed.
When a FVG is formed during the Silver Bullet window, Support & Resistance lines will be drawn at the end of the SB session.
There are 3 different Silver Bullet windows (New York local time):
The London Open Silver Bullet (3 AM — 4 AM ~ 03:00 — 04:00)
The AM Session Silver Bullet (10 AM — 11 AM ~ 10:00 — 11:00)
The PM Session Silver Bullet (2 PM — 3 PM ~ 14:00 — 15:00)
🔶 USAGE
The ICT Silver Bullet indicator aims to provide users a comprehensive display as similar as possible to how anyone would manually draw the concept on their charts.
It's important to use anything below the 15-minute timeframe to ensure proper setups can display. In this section, we are purely using the 3-minute timeframe.
In the image below, we can see a bullish setup whereas a FVG was successfully retested during the Silver Bullet session. This was then followed by a move upwards to liquidity as our target.
Alternatively, you can also see below a bearish setup utilizing the ICT Silver Bullet indicator outlined.
At this moment, the indicator has removed all other FVGs within the Silver Bullet session & has confirmed this FVG as the retested one.
There is also a support level marked below to be used as a liquidity target as per the ICT Silver Bullet concept suggests.
In the below chart we can see 4 separate consecutive examples of bullish & bearish setups on the 3-minute chart.
🔶 CONCEPTS
This technique can visualize potential support/resistance lines, which can be used as targets.
The script contains 2 main components:
• forming of a Fair Value Gap (FVG)
• drawing support/resistance (S/R) lines
🔹 Forming of FVG
1 basic principle: when a FVG at the end of the SB session is not retraced, it will be made invisible.
Dependable on the settings, different FVG's will be shown.
• 'All FVG': all FVG's are shown, regardless the trend
• 'Only FVG's in the same direction of trend': Only FVG's are shown that are similar to the trend at that moment (trend can be visualized by enabling ' Show ' -> ' Trend ')
-> only bearish FVG when the trend is bearish vs. bullish FVG when trend is bullish
• 'strict': Besides being similar to the trend, only FVG's are shown when the closing price at the end of the SB session is:
– below the top of the FVG box (bearish FVG)
– above bottom of the FVG box (bullish FVG)
• 'super-strict': Besides being similar to the trend, only FVG's are shown when the FVG box is NOT broken
in the opposite direction AND the closing price at the end of the SB session is:
– below bottom of the FVG box (bearish FVG)
– above the top of the FVG box (bullish FVG)
' Super-Strict ' mode resembles ICT lectures the most.
🔹 Drawing support/resistance lines
When the SB session has ended, the script draws potential support/resistance lines, again, dependable on the settings.
• Previous session (any): S/R lines are fetched between current and previous session.
For example, when current session is ' AM SB Session (10 AM — 11 AM) ', then previous session is
' London Open SB (3 AM — 4 AM) ', S/R lines between these 2 sessions alone will be included.
• Previous session (similar): S/R lines are fetched between current and previous - similar - session.
For example, when current session is ' London Open SB (3 AM — 4 AM)' , only S/R lines between
current session and previous ' London Open SB (3 AM — 4 AM) ' session are included.
When a new session starts, S/R lines will be removed, except when enabling ' Keep lines (only in strict mode) '
This is not possible in ' All FVG ' or ' Only FVG's in the same direction of trend ' mode, since the chart would be cluttered.
Note that in ' All FVG ' or ' Only FVG's in the same direction of trend ' mode, both, Support/Resistance lines will be shown,
while in Strict/Super-Strict mode:
• only Support lines will be shown if a bearish FVG appears
• only Resistance lines if a bullish FVG is shown
The lines will still be drawn the the end of the SB session, when a valid FVG appears,
but the S/R lines will remain visible and keep being updated until price reaches that line.
This publication contains a "Minimum Trade Framework (mTFW)", which represents the best-case expected price delivery, this is not your actual trade entry - exit range.
• 40 ticks for index futures or indices
• 15 pips for Forex pairs.
When on ' Strict/Super-Strict ' mode, only S/R lines will be shown which are:
• higher than the lowest FVG bottom + mTFW, in a bullish scenario
• lower than the highest FVG bottom - mTFW, in a bearish scenario
When on ' All FVG/Only FVG's in the same direction of trend ' mode, or on non-Forex/Futures/Indices symbols, S/R needs to be higher/lower than SB session high/low.
🔶 SETTINGS
(Check CONCEPTS for deeper insights and explanation)
🔹 Swing settings (left): Sets the length, which will set the lookback period/sensitivity of the Zigzag patterns (which directs the trend)
🔹 Silver Bullet Session; Show SB session: show lines and labels of SB session
Labels can be disabled separately in the ' Style ' section, color is set at the ' Inputs ' section.
🔹 FVG
– Mode
• All FVG
• Only FVG's in the same direction of trend
• Strict
• Super-Strict
– Colors
– Extend: extend till last bar of SB session
🔹 Targets – support/resistance lines
– Previous session (any): S/R lines fetched between current and previous SB session
– Previous session (similar): S/R lines fetched between current and previous similar SB session
– Colors
– Keep lines (only in strict mode)
🔹 Show
– MSS ~ Session: Show Market Structure Shift , only when this happens during a SB session
– Trend: Show trend (Zigzag, colored ~ trend)

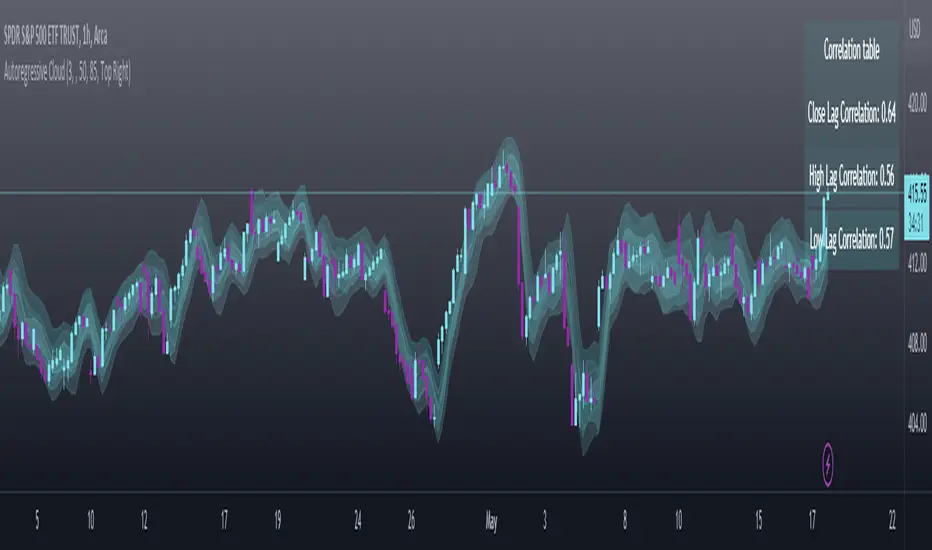
Autoregressive CloudHello,
I am releasing this indicator called the Autoregressive Cloud Indicator.
What it does:
The indicator performs an autoregression analysis on 3 price variables of a ticker, those being the High, the Low and the Close. It uses a 1-lag system and looks back at the previous close, high and low’s effect on the proceeding high, low and close. It then plots out the anticipated range for the ticker based on the autoregression analysis, as well as displays the lag-correlation (autocorrelation) in a table.
What is Autoregression analysis?
Autoregression is a modelling technique used to describe a time series based on its own past values. It assumes that the current value of a variable is a linear combination of its previous values and a random error term.
And what is autocorrelation?
Autocorrelation measures the correlation between a time series and its lagged values. It quantifies the degree to which the current value of a series is related to its past values at different lags, indicating any patterns or dependencies in the data over time. Autoregression and autocorrelation are closely related concepts used to analyze and model time series data.
So how does it work?
The indicator calculates autoregressive values for the close, high, and low prices of a security based on the specified lookback length (which is defaulted to 50). It then plots three sets of clouds representing the smoothed autoregressive values for each price component (done using the SMA function). The transparency of the clouds can be adjusted using the "Transparency" input. Additionally, the code includes a correlation table that displays the correlation coefficients between the lagged values of the close, high, and low prices. The table's position can be customized using the "Position" input.
The indicator defaults to the chart timeframe; however, you can manually adjust the indicator to display the range for whatever timeframe you would like. You can view the 30 minute, 15 or even hourly range on the 1 minute or 5 minute chart if you want.
The indicator will show the anticipated “true trading range” of the stock based on the autoregression and autocorrelation of all 3 variables:
Above is SPY on the 5 minute timeframe with 15 minute levels overlayed. Here, you can see the anticipated trading range for that 15 minute time period.
Using the Correlation Table:
The correlation table displays the Pearson Coefficient for all 3 autoregressions.
A positive correlation: A positive autocorrelation indicates a positive relationship between past and current values of a time series variable. It suggests that when the variable has a high value at a certain time, it is more likely to have a high value in the future, and when it has a low value, it is more likely to have a low value in the future. This positive autocorrelation can imply persistence or trend in the data, indicating that past values can provide useful information for predicting future values. The rule of thumb is anything over 0.5 is considered significant.
A positive correlation among all 3 variables also indicates an uptrend. If you see a strong positive (i.e. the values are all greater than 0.8), it indicates an incredibly decisive and strong uptrend.
A negative correlation: A negative autocorrelation indicates an inverse relationship between past and current values of a time series variable. It suggests that when the variable has a high value at a certain time, it is more likely to have a low value in the future, and vice versa. This negative autocorrelation can imply mean reversion or oscillatory behavior in the data, where extreme values tend to be followed by values closer to the average. It indicates that past values can provide useful information for predicting future values by anticipating a reversal in the direction of the variable. The rule of thumb is anything below or equal to -0.5 is considered significant.
A negative correlation among all 3 variables also indicates a downtrend. If you see a strong negative (i.e. the values are all less than or equal to -0.8), it indicates an incredibly decisive and strong downtrend.
Uses of the Indicator:
The indicator can be used for the following functions:
1. Day trading and scalping within an expected range;
2. Determining the strength or weakness of an uptrend or downtrend on various timeframes;
3. Determining the relationship between previous values and past performance and its effect on future performance;
4. Can alert to changes in trend direction in advance (you may see high, low or close turn negative before others, signifying that weakness is beginning to materialize in an uptrend, or inverse in a downtrend (value changes positive)).
Customizability:
SMA: The autoregression data is smoothed by a 3 period lookback. You can change this if you want, but in order for the indicator to present the true trading range, it is recommended to leave it at <= 3.
Lookback Length: This is the length of the lookback period for the autoregression and autocorrelation functions.
Transparency settings: You can adjust the transparency of the clouds manually.
Timeframe: You can adjust the timeframe, as explained above, to display the timeframe of interest. When you adjust the timeframe, the data will all reflect that timeframe and not necessarily the current TF you have open (i.e. you select 30 minutes while viewing it on the 5 minute, it will show the data for the 30 minute TF period).
Video Tutorial:
I have prepared a video outlining the indicator and also explaining the theory of autoregression/correlation. You can find it below:
Let me know any comments, questions or suggestions below.
Thank you for taking the time to read/watch and check out this indicator.
Safe trades everyone!
ICT Macros [LuxAlgo]The ICT Macros indicator aims to highlight & classify ICT Macros, which are time intervals where algorithmic trading takes place to interact with existing liquidity or to create new liquidity.
🔶 SETTINGS
🔹 Macros
Macro Time options (such as '09:50 AM 10:10'): Enable specific macro display.
Top Line , Mid Line , Bottom Line and Extending Lines options: Controls the lines for the specific macro.
🔹 Macro Classification
Length : A length to detect Market Structure Brakes and classify macro type based on detection.
Swing Area : Swing or Liquidity Area selection, highest/lowest of the wick or the candle bodies.
Accumulation , Manipulation and Expansion color options for the classified macros.
🔹 Others
Macro Texts : Controls both the size and the visibility of the macro text.
Alert Macro Times in Advance (Minutes) : This option will plot a vertical line presenting the start of the next macro time. The line will not appear all the time, but it will be there based on remaining minutes specified in the option.
Daylight Saving Time (DST) : Adjust time appropriate to Daylight Saving Time of the specific region.
🔶 USAGE
A macro is a way to automate a task or procedure which you perform on a regular basis.
In the context of ICT's teachings, a macro is a small program or set of instructions that unfolds within an algorithm, which influences price movements in the market. These macros operate at specific times and can be related to price runs from one level to another or certain market behaviors during specific time intervals. They help traders anticipate market movements and potential setups during specific time intervals.
To trade these effectively, it is important to understand the time of day when certain macros come into play, and it is strongly advised to introduce the concept of liquidity in your analysis.
Macros can be classified into three categories where the Macro classification is calculated based on the Market Structure prior to macro and the Market Structure during the macro duration:
Manipulation Macro
Manipulation macros are characterized by liquidity being swept both on the buyside and sellside.
Expansion Macro
Expansion macros are characterized by liquidity being swept only on the buyside or sellside. Prices within these macros are highly correlated with the overall trend.
Accumulation Macro
Accumulation macros are characterized by an accumulation of liquidity. Prices within these macros tend to range.
The script returns the maximum/minimum price values reached during the macro interval alongside the average between the maximum/minimum and extends them until a new macro starts. These levels can act as supports and resistances.
🔶 DETAILS
All required data for the macro detection and classification is retrieved using 1 minute data sets, this includes candles as well as pivot/swing highs and lows. This approach guarantees the visually presented objects are same (same highs/lows) on higher timeframes as well as the macro classification remain same as it is in 1 min charts.
8 Macros can be displayed by the script (4 are enabled by default):
02:33 AM 03:00 London Macro
04:03 AM 04:30 London Macro
08:50 AM 09:10 New York Macro
09:50 AM 10:10 New York Macro
10:50 AM 11:10 New York Macro
11:50 AM 12:10 New York Launch Macro
13:10 PM 13:40 New York Macro
15:15 PM 15:45 New York Macro
🔶 ALERTS
When an alert is configured, the user will have the ability to be notified in advance of the next Macro time, where the value specified in 'Alert Macro Times in Advance (Minutes)' option indicates how early to be notified.
🔶 LIMITATIONS
The script is supported on 1 min, 3 mins and 5 mins charts.
🔶 RELATED SCRIPTS

ICT Algorithmic Macro Tracker° (Open-Source) by toodegreesDescription:
The ICT Algorithmic Macro Tracker° Indicator is a powerful tool designed to enhance your trading experience by clearly and efficiently plotting the known ICT Macro Times on your chart.
Based on the teachings of the Inner Circle Trader , these Time windows correspond to periods when the Interbank Price Delivery Algorithm undergoes a series of checks ( Macros ) and is probable to move towards Liquidity.
The indicator allows traders to visualize and analyze these crucial moments in NY Time:
- 2:33-3:00
- 4:03-4:30
- 8:50-9:10
- 9:50-10:10
- 10:50-11:10
- 11:50-12:10
- 13:10-13:50
- 15:15-15:45
By providing a clean and clutter-free representation of ICT Macros, this indicator empowers traders to make more informed decisions, optimize and build their strategies based on Time.
Massive shoutout to @reastruth for his ICT Macros Indicator , and for allowing to create one of my own, go check him out!
Indicator Features:
– Track ongoing ICT Macros to aid your Live analysis.
- Gain valuable insights by hovering over the plotted ICT Macros to reveal tooltips with interval information.
– Plot the ICT Macros in one of two ways:
"On Chart": visualize ICT Macro timeframes directly on your chart, with automatic adjustments as Price moves.
Pro Tip: toggle Projections to see exactly where Macros begin and end without difficulty.
"New Pane": move the indicator two a New Pane to see both Live and Upcoming Macro events with ease in a dedicated section
Pro Tip: this section can be collapsed by double-clicking on the main chart, allowing for seamless trading preparation.
This indicator is available only on the TradingView platform.
⚠️ Open Source ⚠️
Coders and TV users are authorized to copy this code base, but a paid distribution is prohibited. A mention to the original author is expected, and appreciated.
⚠️ Terms and Conditions ⚠️
This financial tool is for educational purposes only and not financial advice. Users assume responsibility for decisions made based on the tool's information. Past performance doesn't guarantee future results. By using this tool, users agree to these terms.

ICT Macros by CryptoforICT Macros by Cryptofor
Time periods in which the price is most volatile. At this time, the algorithm is programmed to attack liquidity or fill a significant FVG from which the OF can continue.
Plots of macros:
1. London Macros:
02:33 - 03:00
04:03 - 04:30
2. New York AM Macros:
08:50 - 09:10
09:50 - 10:10
10:50 - 11:10
3. New York Lunch + PM Macros:
11:50 - 12:10
13:10 - 13:40
15:15 - 15:45
Features:
Flexible line settings
Flexible text settings
Display data for all time or for the last 24 hours
Switch for each type of macro
Macro background color settings

BankNifty 5min Supertrend Based StrategyBankNifty 5min Supertrend Based Strategy, Intraday.
Work Best at 5mint chart on BankNifty.
The strategy is designed to trade using the Supertrend indicator with session-based rules, and risk management. It allows for customization through input variables and aims to provide a clear visual representation of the Supertrend by changing the color .
The script also includes input variables for the trading session and date range, which allows the trader to specify the time period in which they want the strategy to run. The session variable specifies the start and end times of the trading session, which in this case is set to the Indian trading session from 9:15 am to 3:10 pm.
The strategy starts by defining input variables such as the session time, start and end date for the backtesting, the length of the ATR, and the Supertrend factor. It also includes options for delay at session start and stop loss points and trail percentage .
The code then checks if the current time is within the specified session and date range . If it is, the Supertrend and its direction are calculated using the defined input variables. The strategy then waits for N numbers of candles (defined by the User) to form at the start of every session i.e. 09:15 AM before entering a trade.
The entry and exit conditions for long and short trades are defined based on the change in the Supertrend direction and the number of candles formed at the session start i.e. 09:15 AM . After that, it takes entry and exit for long and short trades on the change in the Supertrend direction . Stop-loss and trailing stop-loss are also defined based on the input variables.
Stop-loss (Defined by the user) is fixed points either below or above the Entry Price for Long and Short entries.
The Supertrend plot is displayed with changing colors depending on the direction. Finally, the strategy closes all trades at the end of the session if there are any open trades.
Overall, this strategy aims to trade with the Supertrend indicator using session-based rules and risk management.
However, as with any trading strategy, it is important to thoroughly test it before using it in live trading .

GRIDBOT Scalper by nnamWhat is this Indicator used for?
Made specifically for GRID Bots
note: before continuing... this indicator works on any timeframe, but it WORKS BEST ON THE 15 MINUTE TIMEFRAME
Straters and Forex Master Pattern Value Line Traders use this to help determine when the price could reverse.
This indicator is a scalping indicator that produces signals when a "potential" reversal in price is indicated. When the price moves UP and a Potential Bearish Reversal Signal occurs, traders can use this signal as a potential SHORT entry signal for their Short Grid Bot. The process is the same in reverse. After a sustained move down, a Potential Bullish Signal can be used by the trader as a potential LONG entry signal for their GridBot.
As shown in the screenshot below, lines develop on the chart (either RED or GREEN) indicating that a sustained move in one direction is currently occurring; however, there is no potential reversal signal plotted (this means that price action is currently moving in one direction only).
As shown in the screenshot below, lines can be used as a stop-loss after entering the GRIDbot. (usually, by this time, the Grid Bot is in Profit as it usually moves in the opposite direction first)
What this Indicator Does
The GRIDBOT Scalper provides information regarding potential reversals in the market after a sustained movement in one direction (either Bullish or Bearish).
The indicator is based on PRICE-ACTION ONLY and does not take into account the current state of the market (Bullish or Bearish).
Once the price moves in a particular direction for at least 14 bars , a line appears as shown in a previous screenshot. Once the price stops moving in that direction and begins moving in the opposite direction - and after a sustained run - a "signal" appears alerting the trader that a "potential" reversal could be on the horizon soon.
If price moves in one direction and plots both a line and a signal and then begins moving back in the other direction in a sustained manner, the original signal will remain even when a NEW line begins forming (the original line will disappear). (see below) This line will continue to move as the price continues to move. Not until a signal plots on the chart is the potential reversal forming. THE LINE DOES NOT SIGNAL A REVERSAL . Some traders, however, use this information to "ride the wave UP or DOWN" and exit their positions once the signal prints.
As shown below, optional input settings allow the trader to set the line at CLOSE or HIGH/LOW of the candle preceding the potential reversal.
It is suggested to use Close instead of High or Low but the setting allows one to use either.
As shown in the screenshot below, it is typical on LOWER TIME FRAMES to see the price pass the signal line. The Indicator works best on the 15 minute timeframe, as it gives the trader time to make the decisions required as the volatility is less on the 15 minute chart vs the 1 minute or 5 minute charts.
If you have any questions or suggestions for this indicator, please join our Discord. We offer free training on this Indicator on our Discord Server.

Nick_OS RangesUNDERSTANDING THE SCRIPT:
TIMEFRAME RESOLUTION:
* You have the option to choose Daily , Weekly , or Monthly
LOOKBACK WINDOW:
* This number represents how far back you want the data to pull from
- Example: "250" would represent the past 250 Days, Weeks, or Months depending on what is selected in the Timeframe Resolution
RANGE 1 nth (Gray lines):
* This number represents the range of the nth biggest day, week, or month in the Lookback Window
- Example: "30" would represent the range of the 30th biggest day in the past 250 days. (If the Lookback Window is "250")
RANGE 2 nth (Blue lines):
* This number represents the range of the nth biggest day, week, or month in the Lookback Window
- Example: "10" would represent the range of the 10th biggest day in the past 250 days. (If the Lookback Window is "250")
RANGE 3 nth (Pink lines):
* This number represents the range of the nth biggest day, week, or month in the Lookback Window
- Example: "3" would represent the range of the 3rd biggest day in the past 250 days. (If the Lookback Window is "250")
YELLOW LINES:
* The yellow lines are the average percentage move of the inputted number in the Lookback Window
SUGGESTED INPUTS:
FOR DAILY:
Lookback Window: 250
Range 1 nth: 30
Range 2 nth: 10
Range 3 nth: 3
FOR WEEKLY:
Lookback Window: 50
Range 1 nth: 10
Range 2 nth: 5
Range 3 nth: 2
FOR MONTHLY:
Lookback Window: 12
Range 1 nth: 3
Range 2 nth: 2
Range 3 nth: 1
TIMEFRAMES TO USE (If You Have TradingView Premium):
Daily: 5 minute timeframe and higher (15 minute timeframe and higher for Futures)
Weekly: 15 minute timeframe and higher
Monthly: Daily timeframe and higher (Monthly still has issues)
TIMEFRAMES TO USE (If You DO NOT Have TradingView Premium):
Daily: 15 minute timeframe and higher
Weekly: 30 minute timeframe and higher
Monthly: Daily timeframe and higher (Monthly still has issues)
IMPORTANT RELATED NOTE:
If you decide to use a higher Lookback Window, the ranges might be off and the timeframes listed above might not apply
ISSUES THAT MIGHT BE RESOLVED IN THE FUTURE
1. If it is a shortened week (No Monday or Friday), then the Weekly Ranges will show the same ranges as last week
2. Monthly ranges will change based on any timeframe used

[Sniper] SuperTrend + SSL Hybrid + QQE MODHi. I’m DuDu95.
**********************************************************************************
This is the script for the series called "Sniper".
*** What is "Sniper" Series? ***
"Sniper" series is the project that I’m going to start.
In "Sniper" Series, I’m going to "snipe and shoot" the youtuber’s strategy: to find out whether the youtuber’s video about strategy is "true or false".
Specifically, I’m going to do the things below.
1. Implement "Youtuber’s strategy" into pinescript code.
2. Then I will "backtest" and prove whether "the strategy really works" in the specific ticker (e.g. BTCUSDT) for the specific timeframe (e.g. 5m).
3. Based on the backtest result, I will rate and judge whether the youtube video is "true" or "false", and then rate the validity, reliability, robustness, of the strategy. (like a lie detector)
*** What is the purpose of this series? ***
1. To notify whether the strategy really works for the people who watched the youtube video.
2. To find and build my own scalping / day trading strategy that really works.
**********************************************************************************
*** Strategy Description ***
This strategy is from " QQE MOD + supertrend + ssl hybrid" by korean youtuber "코인투데이".
"코인투데이" claimed that this strategy will make you a lot of money in any crypto ticker in 15 minute timeframe.
### Entry Logic
1. Long Entry Logic
- Super Trend Short -> Long
- close > SSL Hybrid baseline upper k
- QQE MOD should be blue
2. Short Entry Logic
- Super Trend Long -> Short
- close < SSL Hybrid baseline lower k
- QQE MOD should be red
### Exit Logic
1. Long Exit Logic
- Super Trend Long -> Short
2. Short Entry Logic
- Super Trend Short -> Long
### StopLoss
1. Can Choose Stop Loss Type: Percent, ATR, Previous Low / High.
2. Can Chosse inputs of each Stop Loss Type.
### Take Profit
1. Can set Risk Reward Ratio for Take Profit.
- To simplify backtest, I erased all other options except RR Ratio.
- You can add Take Profit Logic by adding options in the code.
2. Can set Take Profit Quantity.
### Risk Manangement
1. Can choose whether to use Risk Manangement Logic.
- This controls the Quantity of the Entry.
- e.g. If you want to take 3% risk per trade and stop loss price is 6% below the long entry price,
then 50% of your equity will be used for trade.
2. Can choose How much risk you would take per trade.
### Plot
1. Added Labels to check the data of entry / exit positions.
2. Changed and Added color different from the original one. (green: #02732A, red: #D92332, yellow: #F2E313)
3. SuperTrend and SSL Hybrid Baseline is by default drawn on the chart.
4. If you check EMA filter, EMA would be drawn on the chart.
5. Should add QQE MOD indicator manually if you want to see QQE MOD.
**********************************************************************************
*** Rating: True or False?
### Rating:
→ 3.5 / 5 (0 = Trash, 1 = Bad, 2 = Not Good, 3 = Good, 4 = Great, 5 = Excellent)
### True or False?
→ True but not a 'perfect true'.
→ It did made a small profit on 15 minute timeframe. But it made a profit so it's true.
→ It worked well in longer timeframe. I think super trend works well so I will work on this further.
### Better Option?
→ Use this for Day trading or Swing Trading, not for Scalping. (Bigger Timeframe)
→ Although the result was not good at 15 minute timeframe, it was quite profitable in 1h, 2h, 4h, 8h, 1d timeframe.
→ Crypto like BTC, ETH was ok.
→ The result was better when I use EMA filter.
### Robust?
→ Yes. Although result was super bad in 5m timeframe, backtest result was "consistently" profitable on longer timeframe (when timeframe was bigger than 15m, it was profitable).
→ Also, MDD was good under risk management option on.
**********************************************************************************
*** Conclusion?
→ I recommend you not to use this on short timeframe as the youtuber first mentioned.
→ In my opinion, I can use on longer timeframe like 2h or bigger with EMA filter, stoploss and risk management.

GAJAN RATHOD INTRADAY ( updated )This is purely an Intraday strategy. 5 ema is used for scalping , while 20 ema is for short term trading, 50 ema is for mid term while 200 ema is used for long term trading. Also, 15 min high and low is market. If candle closes above 15 min high then BUY or candle closes below 15 min low then sell.
MTF Stoch RSI + Realtime DivergencesMulti-timeframe Stochastic RSI + Realtime Divergences + Alerts + Pivot lookback periods.
This version of the Stochastic RSI adds the following additional features to the stock UO by Tradingview:
- Optional 3 x Multiple-timeframe overbought and oversold signals, indicating where 3 selected timeframes are all overbought (>80) or all oversold (<20) at the same time, with alert option.
- Optional divergence lines drawn directly onto the oscillator in realtime, with alert options.
- Configurable lookback periods to fine tune the divergences drawn in order to suit different trading styles and timeframes, including the ability to enable automatic adjustment of pivot period per chart timeframe.
- Alternate timeframe feature allows you to configure the oscillator to use data from a different timeframe than the chart it is loaded on.
- Indications where the Stoch RSI is crossing down from above the overbought threshold (<80) and crossing above the oversold threshold (>20) levels on a given user selected timeframe, by printing gold dots on the indicator.
- Also includes standard configurable Stoch RSI options, including k length, d length, RSI length, Stochastic length, and source type (close, hl2, etc)
While this version of the Stochastic RSI has the ability to draw divergences in realtime along with related settings and alerts so you can be notified as divergences occur without spending all day watching the charts, the main purpose of this indicator was to provide the triple multiple-timeframe overbought and oversold confluence signals and alerts, in an attempt to add more confluence, weight and reliability to the single timeframe overbought and oversold states, commonly used for trade entry confluence. It's primary purpose is intended for scalping on lower timeframes, typically between 1-15 minutes. The triple timeframe overbought can often indicate near term reversals to the downside, with the triple timeframe oversold often indicating neartime reversals to the upside. The default timeframes for this confluence are set to check the 1 minute, 5 minute, and 15 minute timeframes, ideal for scalping the < 15 minute charts.
The Stochastic RSI
The popular oscillator has been described as follows:
“The Stochastic RSI is an indicator used in technical analysis that ranges between zero and one (or zero and 100 on some charting platforms) and is created by applying the Stochastic oscillator formula to a set of relative strength index (RSI) values rather than to standard price data. Using RSI values within the Stochastic formula gives traders an idea of whether the current RSI value is overbought or oversold. The Stochastic RSI oscillator was developed to take advantage of both momentum indicators in order to create a more sensitive indicator that is attuned to a specific security's historical performance rather than a generalized analysis of price change.”
How do traders use overbought and oversold levels in their trading?
The oversold level, that is when the Stochastic RSI is above the 80 level is typically interpreted as being 'overbought', and below the 20 level is typically considered 'oversold'. Traders will often use the Stochastic RSI at an overbought level as a confluence for entry into a short position, and the Stochastic RSI at an oversold level as a confluence for an entry into a long position. These levels do not mean that price will necessarily reverse at those levels in a reliable way, however. This is why this version of the Stoch RSI employs the triple timeframe overbought and oversold confluence, in an attempt to add a more confluence and reliability to this usage of the Stoch RSI.
What are divergences?
Divergence is when the price of an asset is moving in the opposite direction of a technical indicator, such as an oscillator, or is moving contrary to other data. Divergence warns that the current price trend may be weakening, and in some cases may lead to the price changing direction.
There are 4 main types of divergence, which are split into 2 categories;
regular divergences and hidden divergences. Regular divergences indicate possible trend reversals, and hidden divergences indicate possible trend continuation.
Regular bullish divergence: An indication of a potential trend reversal, from the current downtrend, to an uptrend.
Regular bearish divergence: An indication of a potential trend reversal, from the current uptrend, to a downtrend.
Hidden bullish divergence: An indication of a potential uptrend continuation.
Hidden bearish divergence: An indication of a potential downtrend continuation.
Setting alerts.
With this indicator you can set alerts to notify you when any/all of the above types of divergences occur, on any chart timeframe you choose, and also when the triple timeframe overbought and oversold confluences occur.
Configurable pivot lookback values.
You can adjust the default pivot lookback values to suit your prefered trading style and timeframe. If you like to trade a shorter time frame, lowering the default lookback values will make the divergences drawn more sensitive to short term price action. By default, this indicator has enabled the automatic adjustment of the pivot periods for 4 configurable timeframes, in a bid to optimise the divergences drawn when the indicator is loaded onto any of the 4 timeframes. These timeframes and the auto adjusted pivot periods on each of them can also be reconfigured within the settings menu.
How do traders use divergences in their trading?
A divergence is considered a leading indicator in technical analysis , meaning it has the ability to indicate a potential price move in the short term future.
Hidden bullish and hidden bearish divergences, which indicate a potential continuation of the current trend are sometimes considered a good place for traders to begin, since trend continuation occurs more frequently than reversals, or trend changes.
When trading regular bullish divergences and regular bearish divergences, which are indications of a trend reversal, the probability of it doing so may increase when these occur at a strong support or resistance level . A common mistake new traders make is to get into a regular divergence trade too early, assuming it will immediately reverse, but these can continue to form for some time before the trend eventually changes, by using forms of support or resistance as an added confluence, such as when price reaches a moving average, the success rate when trading these patterns may increase.
Typically, traders will manually draw lines across the swing highs and swing lows of both the price chart and the oscillator to see whether they appear to present a divergence, this indicator will draw them for you, quickly and clearly, and can notify you when they occur.
Disclaimer: This script includes code from the stock UO by Tradingview as well as the Divergence for Many Indicators v4 by LonesomeTheBlue.

Weighted percentile nearest rankYo, posting it for the whole internet, took the whole day to find / to design the actual working solution for weighted percentile 'nearest rank' algorithm, almost no reliable info online and a lot of library-style/textbook-style solutions that don't provide on real world production level.
The principle:
0) initial data
data = 22, 33, 11, 44, 55
weights = 5 , 3 , 2 , 1 , 4
array(s) size = 5
1) sort data array, apply the sorting pattern to the weights array, resulting:
data = 11, 22, 33, 44, 55
weights = 2 , 5 , 3 , 1 , 4
2) get weights cumsum and sum:
weights = 2, 5, 3 , 1 , 4
weights_cum = 2, 7, 10, 11, 15
weights_sum = 15
3) say we wanna find 50th percentile, get a threshold value:
n = 50
thres = weights_sum / 100 * n
7.5 = 15 / 100 * 50
4) iterate through weights_cum until you find a value that >= the threshold:
for i = 0 to size - 1
2 >= 7.5 ? nah
7 >= 7.5 ? nah
10 >= 7.5 ? aye
5) take the iteration index that resulted "aye", and find the data value with the same index, that's gonna be the resulting percentile.
i = 2
data = 33
This one is not an approximation, not an estimator, it's the actual weighted percentile nearest rank as it is.
I tested the thing extensively and it works perfectly.
For the skeptics, check lines 40, 41, 69 in the code, you can comment/uncomment dem to switch for unit (1) weights, resulting in the usual non-weighted percentile nearest rank that ideally matches the TV's built-in function.
Shoutout for @wallneradam for the sorting function mane
...
Live Long and Prosper

Inside Bar SetupScript Details
- This script plots Inside Bar for given day in selected time-frame (applicable only for Timeframes < Day)
- Basis plotted inside bar, relevant targets are marked on the chart
- Targets can be customised from script settings. Example, if range of mother candle is 10 points, then T1 is 10 * x above/below mother candle and T2 is 10 * y above/below mother candle. This x & y are configured via script settings
How to use this script ?
- This script works well on 10-15 mins timeframe for stocks, 15/30 mins timeframe for nifty index and 30/60 mins time frame for bank nifty index
- If mother candle high is broken, take long trade with SL of mother candle low and if low is broken, take short trade with SL of mother candle high
Remember:
1. Above logic is to be combined with support/resistances i.e. price action. This script is an add-on to price action analysis giving you more conviction.
2. If range of mother candle is very high, it is recommended to avoid the trade.
3. Basis inside bar formed on higher time frame, take trade on basis of lower time frame i.e if inside bar is formed on 60 mins, take trade on the basis of 10-15 mins time frame
Example:
1. As seen in the chart, Nifty is near it's resistance and we are seeing Inside Bar being formed, In such scenario, even if High of Mother Candle is broken, we should be more interested to short as we are near resistance and probability of getting our targets in long side is less.
2. So, if I see breakdown of mother candle i.e. price going below low of mother candle, we will short with SL of high of mother candle.
3. As seen in the chart, both the targets are achieved.
Additional Info:
1. Targets on Long/Short Side can be configured via settings. For indices 1 times/1.5 times the range works well.
2. This script plots targets basis the first inside bar formed in the day for selected time frame.
3. Inside bars formed through out the day are coloured separately but lines are plotted only on the basis of 1st formed inside bar as this strategy works well for the first formed inside bar)
4. Don't forget to check volume in case of breakout/breakdown.
Note:
1. Mother Candle - First Candle of Inside Bar
2. Child Candle - Candle formed inside Mother Candle (Second Candle of Inside Bar)
Happy Trading :)

Trade HourThis script is just finds the best hour to buy and sell hour in a day by checking chart movements in past
For example if the red line is on the 0.63 on BTC/USDT chart it mean the start of 12AM hour on a day is the best hour to buy (all based on
It's just for 1 hour time-frame but you can test it on other charts.
IMPORTANT: You can change time Zone in strategy settings.to get the real hours as your location timezone
IMPORTANT: Its for now just for BTC/USDT but you can optimize and test for other charts...
IMPORTANT: A green and red background color calculated for show the user the best places of buy and sell (green : positive signal, red: negative signals)
settings :
timezone : We choice a time frame for our indicator as our geo location
source : A source to calculate rate of change for it
Time Period : Time period of ROC indicator
About Calculations:
1- We first get a plot that just showing the present hour as a zigzag plot
2- So we use an indicator ( Rate of change ) to calculate chart movements as positive and negative numbers. I tested ROC is the best indicator but you can test close-open or real indicator or etc as indicator.
3 - for observe effects of all previous data we should indicator_cum that just a full sum of indicator values.
4- now we need to split this effects to hours and find out which hour is the best place to buy and which is the best for sell. Ok we should just calculate multiple of hour*indicator and get complete sum of it so:
5- we will divide this number to indicator_cum : (indicator_mul_hour_cum) / indicator_cum
6- Now we have the best hour to buy! and for best sell we should just reverse the ROC indicator and recalculate the best hour for it!
7- A green and red background color calculated for show the user the best places of buy and sell that dynamically changing with observing green and red plots(green : positive signal, red: negative signals) when green plot on 15 so each day on hour 15 the background of strategy indicator will change to 15 and if its go upper after some days and reached to 16 the background green color will move to 16 dynamically.

RSI Trend Heatmap in Multi TimeframesRSI Trend Heatmap in Multi Timeframes
Description
Sometimes you want to look at the RSI Trend across multiple time frames.
You have to waste time browsing through them.
So we've put together every time frame you want to see in one indicator.
We have 10 layers of RSI Trend heatmap available for you.
You can set the timeframe as you want on the Settings page.
Description of Parameter RSI Setting ** You can change it by setting.
RSI Trend Length : (Default 50)
Source : (Default close)
RSI Sideways Length : (Default 2 = RSI between 48 .. 52)
Description of Parameter RSI Timeframe ** You can change it by setting.
""=None,
"M"=1Month, "2W"=2Weeks, "W"=1Week,
"3D"=3Days, "2D"=2Days, "D"=1Day,
"720"=12Hours, "480"=4Hours, "240"=4Hours, "180"=3Hours, "120"=2Hours,
"60"=60Minutes, "30"=30Minutes, "15"=15Minutes, "5"=5Minutes, "1"=1Minute
Default Configurate of RSI Timeframe (for a time frame of 1 hour to 1 day)
"W"= Timeframe 1 month shown in line 90-100 --> Represent Long Trend of RSI
---------------------------------------
"D2"= Timeframe 2 days shown in line 70-80 --> Represent Trend of RSI
"D"= Timeframe 1 day shown in line 60-70 --> Represent Trend of RSI
---------------------------------------
"240"= Timeframe 3 hours shown in line 40-50 --> Represent Signal Up/Signal Down/Divergence of RSI
"120"= Timeframe 2 hours shown in line 30-40 --> Represent Signal Up/Signal Down/Divergence of RSI
"60"= Timeframe 1 hour shown in line 20-30 --> Represent Signal Up/Signal Down/Divergence of RSI
"30"= Timeframe 30 minutes shown in line 10-20 --> Represent Signal Up/Signal Down/Divergence of RSI
"15"= Timeframe 15 minutes shown in line 00-10 --> Represent Signal Up/Signal Down/Divergence of RSI
Description of Colors
Dark Bule = Extreme Uptrend / Overbought / Bull Market (RSI > 67)
Light Bule = Uptrend (RSI between 50-52 .. 67)
Yellow = Sideways Trend / Trend Reversal (RSI between 48 .. 52) ** You can change it by setting.
Light Red = Downtrend (RSI between 33 .. 48-50)
Dark Red = Extreme Downtrend / Oversold / Bear Market (RSI < 33)
How to use
1. You must first know what the main trend of the RSI is (look at the 60-80 line). If it is red, it is a downtrend. and if it's blue shows that it is an uptrend
2. Throughout the period of the main trend There will always be a reversal of the sub-trend. (Can see from the 0-50 line), but eventually will return to follow the main trend.
3. Unless the sub trend persists for a long time until the main trend changes.

Bollinger CloudsThis indicator plots Bollinger Bands for your current timeframe (e.g 5 minutes) and also plots the Bollinger Bands for a higher timeframe (15 minutes for 5 minute timeframe). Then the gaps between the current and higher timeframe upper and lower bands is filled to create clouds which can be used as entry zones. Like Bollinger Bands, this indicator shouldn't be solely used for entries, use it in conjunction with other indicators.
Bollinger Band Timeframes
Current / Higher
1 minute / 5 minutes
3 minutes / 10 minutes
5 minutes / 15 minutes
10 minutes / 30 minutes
15 minutes / 1 hour
30 minutes / 2 hours
45 minutes / 1.5 hours
1 hour / 4 hours
2 hours / 8 hours
2.5 hours / 10 hours
4 hours / 1 Day
1 Day / 3 Days
3 Days / 9 Days
5 Days / 2 Weeks
1 Week / 1 Month

GANN Square Of 9 PivotsGANN Square Of 9 Pivots
How to use for Intraday ?
Method 01 (From 9:05 am to 9:15 am or pre-open market)
Take the Weighted Average Price or Volume Weighted Average Price (VWAP) or Time Weighted Average Price (TWAP) of any stock or index.
You can use TWAP for Index as volume is not available.
Method 02 (From 9:05 am to 9:15 am or pre-open market)
Take the Last Traded Price (LTP) of index or stock
Method 03 (After 9:30 am or after 1st 15 min)
Only take Last Traded Price (LTP) of stock or index
Ideal Time
15min to 1hr after market opens
Indicator Features
Lines
Gray Dashed Line: Calculation Price
Teal Solid Line: Long Above
Red Solid Line: Short Below
3 Teal Dotted Lines: Bullish Targets 1, 2 & 3
3 Red Dotted Lines: Bearish Targets 1, 2 & 3
Labels
1st Numbers: Price
2nd Numbers in (): % change from LTP to that Level
For Index
As VWAP is not available for Index, TWAP (Time Weighted Average Price) values can be used for Index.
Custom Price Inputs
Price of your choice can be given manually by selecting:
Source > Custom
Enter Price > (type the price)
Timeframe
Higher timeframes like Weekly, Monthly can be changed using Timeframe Option
For More Reading
Reading: traderji.com/community/threads/intraday-trading-using-gann-calculator.39185/#post-419677
Calculator: stockmaniacs.net/freebies/free-tools/gann-square-of-9-calculator/
