EMA Regime (9/20/50/100/200) — Stacked with 200 FilterEMA Regime (9/20/50/100/200) — Stacked Long/Short Box
Plots the 9, 20, 50, 100, and 200 EMAs on the chart.
Checks if price is above or below each EMA and whether the EMAs are stacked in order.
LONG signal: price above all selected EMAs and EMAs stacked 9 > 20 > 50 > 100 >(> 200 if strict mode on).
SHORT signal: price below all selected EMAs and EMAs stacked 9 < 20 < 50 < 100 (< 200 if strict mode on).
Shows a two-row table (LONGS / SHORTS) so you can quickly see which EMAs are aligned.
Optionally colors candles green/red when a full long/short regime is active.
Can show labels when a new LONG or SHORT condition appears.
Has alerts you can use for automated notifications when the regime flips.
“Use 200 EMA in the stack” lets you choose ultra-strict mode (9>20>50>100>200) or lighter mode (9>20>50>100 but price & 9 above 200).
Cari dalam skrip untuk "纳斯达克指数期货cfd"

EMA Separation (LFZ Scalps) v6 — Early TriggerPlots the percentage distance between a fast and a slow EMA (default 9 & 21) to gauge trend strength and filter out choppy London Flow Zone breakouts.
• Gray – EMAs nearly flat (low momentum, avoid trades)
• Orange – early trend building
• Green/Red – strong directional momentum
Useful for day-traders: wait for the gap to widen beyond your chosen threshold (e.g., 0.25 %) before entering a breakout. Adjustable EMA lengths and alert when the separation exceeds your “strong trend” level.

ORB 15m + MAs (v4.1)Session ORB Live Pro — Pre-Market Boxes & MA Suite (v4.1)
What it is
A precision Opening Range Breakout (ORB) tool that anchors every session to one specific 15-minute candle—then projects that same high/low onto lower timeframes so your 1m/5m levels always match the source 15m bar. Perfect for scalpers who want session structure without drift.
What it draws
Asia, Pre-London, London, Pre-New York, New York session boxes.
On 15m: only the high/low of the first 15-minute bar of each window (optionally persists for extra bars).
On 5m: mirrors the same 15m range, visible up to 10 bars.
On 1m: mirrors the same 15m range, visible up to 15 bars.
Levels update live while the 15m candle is forming, then lock.
Fully editable windows (easy UX)
Change session times with TradingView’s native input.session fields using the familiar format HHMM-HHMM:1234567. You can tweak each window independently:
Asia
Pre-London
London
Pre-New York
New York
Multi-TF logic (no guesswork)
Designed to show only on 1m, 5m, 15m (by default).
15m = ground truth. Lower timeframes never “recalculate a different range”—they mirror the 15m bar for that session, exactly.
Alerts
Optional breakout alerts when price closes above/below the session range.
Clean visuals
Per-session color controls (box + lines). Boxes extend only for the configured number of bars per timeframe, keeping charts uncluttered.
Built-in MA suite
SMA 50 and RMA 200.
Three extra MAs (SMA/EMA/RMA/WMA/HMA) with selectable color, width, and style (line, stepline, circles).
Why traders like it
Consistency: Lower-TF ranges always match the 15m source bar.
Speed: You see structure immediately—no waiting for N bars.
Control: Edit session times directly; tune how long boxes stay on chart per TF.
Clarity: Minimal, purposeful plotting with alerts when it matters.
Quick start
Set your session times via the five input.session fields.
Choose how long boxes persist on 1m/5m/15m.
Enable alerts if you want instant breakout notifications.
(Optional) Configure the MA suite for trend/bias context.
Best for
Intraday traders and scalpers who rely on repeatable session behavior and demand exact cross-TF alignment of ORB levels.

Gemini RSI Divergence SignalsLolLol
Lol
Lol
Lol
Lol
Lol
Lol
Lol
Lol
Lol
Lol
Lol
Lol
Lol
Lol
Lol
Lol
Lol
Lol
Lol
Lol
Lol
Lol
MACD (The Moving Average Convergence Divergence)The Moving Average Convergence Divergence (MACD) is a momentum indicator used in technical analysis to identify trends, measure their strength, and signal potential reversals. It is calculated by subtracting the 26-period Exponential Moving Average (EMA) from the 12-period EMA, creating the MACD line. A 9-period EMA of the MACD line, known as the signal line, is then plotted to generate buy or sell signals. Positive MACD values suggest upward momentum, while negative values indicate downward momentum. Traders often watch for crossovers, divergences, and movements relative to the zero line to make informed decisions.

Ch Enhanced Buy Sell Volume// ========================================
// 📊 HOW TO READ THIS INDICATOR 📊
// ========================================
//
// 🟢 GREEN BARS (Above Zero) = BUY VOLUME
// 🔴 RED BARS (Below Zero) = SELL VOLUME
//
// 💡 BAR COLORS MEANING:
// • DARK GREEN = Strong buyer dominance (high conviction buying)
// • LIGHT GREEN = Weak buyer dominance (low conviction)
// • DARK RED = Strong seller dominance (high conviction selling)
// • LIGHT RED = Weak seller dominance (low conviction)
//
// 🎯 TRADING SIGNALS:
// • Tall dark green bars = Strong bullish momentum
// • Tall dark red bars = Strong bearish momentum
// • Light colored bars = Weak conviction, potential reversal
// • Green bars > Red bars = Buyers winning
// • Red bars > Green bars = Sellers winning
//
// 📈 BULLISH SIGNALS:
// • Buy% > 70% = Strong buying interest
// • Dark green bars with high delta = Professional buying
// • Buy volume above yellow MA line = Above average buying
//
// 📉 BEARISH SIGNALS:
// • Sell% > 70% = Strong selling pressure
// • Dark red bars with high delta = Professional selling
// • Sell volume below yellow MA line = Above average selling
//
// ⚠️ WARNING SIGNALS:
// • Price up + Red dominance = Bearish divergence
// • Price down + Green dominance = Bullish divergence
// • Low delta (<10%) = Market indecision
//
// 📊 INFO TABLE (Top-Right):
// • Buy%: Percentage of volume that was buying
// • Sell%: Percentage of volume that was selling
// • Delta%: Strength of dominance (difference between buy/sell)
// • Dom: Which side is currently dominant (BUYERS/SELLERS)
//
// 🟡 YELLOW LINES = Volume Moving Average
// • Upper line: Reference for buy volume (green bars)
// • Lower line: Reference for sell volume (red bars)
// • Above yellow = Higher than average volume
// • Below yellow = Lower than average volume

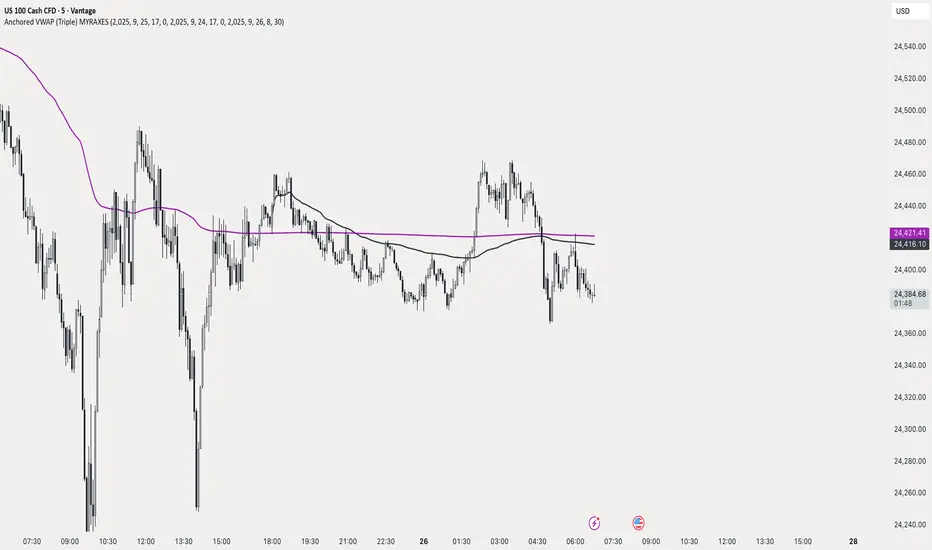
Anchored VWAP (Triple) MYRAXESAnchored VWAP Triple Indicator
The Anchored VWAP Triple indicator is a powerful tool for technical analysis, allowing traders to plot three customizable anchored Volume Weighted Average Price (VWAP) lines on a chart. Unlike traditional VWAP, which resets daily, this indicator lets you anchor each VWAP to a specific date and time, providing a unique perspective on price action relative to key market events.
Features
Three Independent VWAPs: Plot up to three VWAP lines, each anchored to a user-defined date and time.
Customizable Inputs: Set the year, month, day, hour, and minute for each VWAP anchor point. Choose distinct colors for easy identification.
Pure Anchored Design: VWAP lines start only from the anchor point, with no pre-anchor extensions, ensuring a clean and focused analysis.
Debug Mode: Optional display of hour and minute for troubleshooting or educational purposes.
Default Settings: Pre-configured with practical defaults (e.g., September 2025 dates) for immediate use.
How to Use
Add the indicator to your TradingView chart.
Adjust the anchor dates and times for each VWAP (VWAP 1, VWAP 2, VWAP 3) via the input settings.
Select custom colors for each VWAP line to differentiate them on the chart.
Enable Debug Mode if needed to verify time alignment.
Analyze price movements relative to the anchored VWAPs to identify support, resistance, or trend shifts.
Benefits
Ideal for swing traders and long-term analysts who need to anchor VWAP to significant price levels or events.
Enhances decision-making by comparing multiple VWAPs from different anchor points.
Fully compatible with TradingView’s Pine Script v6 for smooth performance.
This indicator is perfect for traders looking to deepen their market analysis with a flexible, multi-VWAP approach. Share your feedback or custom setups in the comments!
VIX BanditThis is a momentum indicator that identifies potential VIX bottoms by using seven configurable Williams %R oscillators simultaneously.
Green dots🟢appear below the bar when all %R series agree the VIX is extremely oversold.
Fuchsia dots🟣appear above the bar when VIX reverts to its long-term average (an EMA).
I hope this helps you spot moments of maximum optimism and trade the subsequent panic, somehow.

Liquidity+FVG+OB Strategy (v6)How the strategy works (summary)
Entry Long when a Bullish FVG is detected (optionally requires a recent Bullish OB).
Entry Short when a Bearish FVG is detected (optionally requires a recent Bearish OB).
Stop Loss and Take Profit are placed using ATR multiples (configurable).
Position sizing is fixed contract/lot size (configurable).
You can require OB confirmation (within ob_confirm_window bars).
Alerts still exist and visuals are preserved.

Liquidity + FVG + OB Markings (Fixed v6)This indicator is built for price-action traders.
It automatically finds and plots three key structures on your chart:
Liquidity Levels – swing highs & lows that often get targeted by price.
Fair-Value Gaps (FVG) – inefficient price gaps between candles.
Order-Blocks (OB) – zones created by strong, high-volume impulsive candles.
It also provides alerts and a small information table so you can quickly gauge the current market context.

Trader Marks Trailing SL + TP (BE @ 60%)This script provides a unique stop-loss and take-profit management tool designed for swing traders.
It introduces a two-stage stop-loss logic that is not available in standard TradingView tools:
Break-Even Protection: Once a defined profit threshold (e.g. 66%) is reached, the stop-loss automatically moves to break-even.
ATR-Based Trailing Stop: After a chosen delay (e.g. 12 hours), the script activates a dynamic trailing stop that follows market volatility using the ATR.
Flexible Ratchet Mechanism: The stop-loss can be locked at new profit levels and will never move backwards.
This combination allows traders to secure profits while still giving the trade room to develop. The indicator is especially useful for swing trading on 4H and daily timeframes but can be applied to other styles as well.
How to use:
Enter your entry price, stop-loss, and take-profit levels.
Choose your trailing mode: Exact S/L+ (simple) or Advanced (Delay + BE + Ratchet).
Adjust parameters such as ATR length or activation delay to match your strategy.
The script helps you balance risk and reward by ensuring that once the trade moves in your favor, you cannot lose the initial risk, while still benefiting from extended market moves.

AI Trading Alerts v6 — SL/TP + Confidence + Panel (Fixed)Overview
This Pine Script is designed to identify high-probability trading opportunities in Forex, commodities, and crypto markets. It combines EMA trend filters, RSI, and Stochastic RSI, with automatic stop-loss (SL) & take-profit (TP) suggestions, and provides a confidence panel to quickly assess the trade setup strength.
It also includes TradingView alert conditions so you can set up notifications for Long/Short setups and EMA crosses.
⚙️ Features
EMA Trend Filter
Uses EMA 50, 100, 200 for trend confirmation.
Bull trend = EMA50 > EMA100 > EMA200
Bear trend = EMA50 < EMA100 < EMA200
RSI Filter
Bullish trades require RSI > 50
Bearish trades require RSI < 50
Stochastic RSI Filter
Prevents entries during overbought/oversold extremes.
Bullish entry only if %K and %D < 80
Bearish entry only if %K and %D > 20
EMA Proximity Check
Price must be near EMA50 (within ATR × adjustable multiplier).
Signals
Continuation Signals:
Long if all bullish conditions align.
Short if all bearish conditions align.
Cross Events:
Long Cross when price crosses above EMA50 in bull trend.
Short Cross when price crosses below EMA50 in bear trend.
Automatic SL/TP Suggestions
SL size adjusts depending on asset:
Gold/Silver (XAU/XAG): 5 pts
Bitcoin/Ethereum: 100 pts
FX pairs (default): 20 pts
TP = SL × Risk:Reward ratio (default 1:2).
Confidence Score (0–4)
Based on conditions met (trend, RSI, Stoch, EMA proximity).
Labels:
Strongest (4/4)
Strong (3/4)
Medium (2/4)
Low (1/4)
Visual Panel on Chart
Shows ✅/❌ for each condition (trend, RSI, Stoch, EMA proximity, signal now).
Confidence row with color-coded strength.
Alerts
Long Setup
Short Setup
Long Cross
Short Cross
🖥️ How to Use
1. Add the Script
Open TradingView → Pine Editor.
Paste the full script.
Click Add to chart.
Save as "AI Trading Alerts v6 — SL/TP + Confidence + Panel".
2. Configure Inputs
EMA Lengths: Default 50/100/200 (works well for swing trading).
RSI Length: 14 (standard).
Stochastic Length/K/D: Default 14/3/3.
Risk:Reward Ratio: Default 2.0 (can change to 1.5, 3.0, etc.).
EMA Proximity Threshold: Default 0.20 × ATR (adjust to be stricter/looser).
3. Read the Panel
Top-right of chart, you’ll see ✅ or ❌ for:
Trend → Are EMAs aligned?
RSI → Above 50 (bull) or below 50 (bear)?
Stoch OK → Not extreme?
Near EMA50 → Close enough to EMA50?
Above/Below OK → Price position vs. EMA50 matches trend?
Signal Now → Entry triggered?
Confidence row:
🟢 Green = Strongest
🟩 Light green = Strong
🟧 Orange = Medium
🟨 Yellow = Low
⬜ Gray = None
4. Alerts Setup
Go to TradingView Alerts (⏰ icon).
Choose the script under “Condition”.
Select alert type:
Long Setup
Short Setup
Long Cross
Short Cross
Set notification method (popup, sound, email, mobile).
Click Create.
Now TradingView will notify you automatically when signals appear.
5. Example Workflow
Wait for Confidence = Strong/Strongest.
Check if market session supports volatility (e.g., XAU in London/NY).
Review SL/TP suggestions:
Long → Entry: current price, SL: close - risk_pts, TP: close + risk_pts × RR.
Short → Entry: current price, SL: close + risk_pts, TP: close - risk_pts × RR.
Adjust based on your own price action analysis.
📊 Best Practices
Use on H1 + D1 combo → align higher timeframe bias with intraday entries.
Risk only 1–2% of account per trade (position sizing required).
Filter with market sessions (Asia, Europe, US).
Strongest signals work best with trending pairs (e.g., XAUUSD, USDJPY, BTCUSD).

LibbyThis script is a refined chopzone index script with additional functionalities.
it produce buy and sell signals as directed by chopzone
How to use:
BUY: Look for buy signal on the chart and proceed to place buy or long orders
SELL: Look for sell on the chart and proceed to place sell or short orders.
NOTE: i recommend you set alerts and make it activate on bar close to avoid fadeouts and sideways.
expect sideways market and multiple opposite signals within a short time during news or when economic data are released.
as always, no indicator is failproof, it is recommended to always pair more than 1 indicator for more clarity and practice safe trading.

OR Box + Full Key Levels (Cash Hours • Strict v5)This is the final working script, just choose from the drop down to adjkust for Europeon / US markets

Advanced MA Slope Tool(by ExpertCBCD)New version of MA Slope, originally made by ExpertCBCD.Now you can choose many indicators then compare and confirm their slope. Thanks for ExpertCBCD, hope you can use it like the bow of Robinhood to defeat big banks and take money in the market.

MACD Josh MACD Study — Visual Crossover Tags
Overview:
This script displays MACD signals in a clear, visual way by showing:
Histogram = EMA(Fast) − EMA(Slow)
Signal = EMA(Histogram, Signal Length)
It adds labels and arrows to help you see crossover events between the Histogram and the Signal line more easily.
⚠️ Disclaimer: This tool is for educational and research purposes only. It is not financial advice or an investment recommendation. Past performance does not guarantee future results. Users should make their own decisions and manage risk responsibly.
Features
Central Zero Line with Signal and Histogram plots
Optional labels/arrows to highlight Histogram–Signal crossovers
Alerts for crossover and crossunder events, integrated with TradingView’s alert system
Standard adjustable inputs: Fast EMA, Slow EMA, Signal EMA
How to Interpret (for study only)
When the Histogram crosses above the Signal, a visual label/arrow marks a positive MACD event
When the Histogram crosses below the Signal, a visual label/arrow marks a negative MACD event
The “BUY/SELL” labels are visual study tags only — they do not represent trade instructions or recommendations
Responsible Usage Tips
Test across multiple timeframes and different assets
Combine with higher-timeframe trend, support/resistance, or volume for confirmation
Use alerts with caution, and always test in a demo environment first
Technical Notes
The script does not use future data and does not repaint signals once bars are closed
Results depend on market conditions and may vary across assets and timeframes
License & Credits
Written in Pine Script® v5 for TradingView
The indicator name shown on chart is for labeling purposes only and carries no implication of advice or solicitation

Initial Balance SMC-V3
Initial Balance SMC-V3 – An Advanced Mean Reversion Indicator for Index Markets
The Initial Balance SMC-V3 indicator is the result of continuous refinement in mean reversion trading, with a specific focus on index markets (such as DAX, NASDAQ, S&P 500, etc.). Designed for high-liquidity environments with controlled volatility, it excels at precisely identifying value zones and statistical reversal points within market structure.
🔁 Mean Reversion at Its Core
At the heart of this indicator lies a robust mean reversion logic: rather than chasing extreme breakouts, it seeks returns toward equilibrium levels after impulsive moves. This makes it especially effective in ranging markets or corrective phases within broader trends—situations where many traders get caught in false breakouts.
🎯 Signals Require Breakout + Confirmation
Signals are never generated impulsively. Instead, they require a clear sequence of confirmations:
Break of a key level (e.g., Initial Balance high/low or an SMC zone);
Price re-entry into the range accompanied by a crossover of customizable moving averages (SMA, EMA, HULL, TEMA, etc.);
RSI filter to avoid entries in overbought/oversold extremes;
Volatility filter (ATR) to skip low-volatility, choppy conditions.
This multi-layered approach drastically reduces false signals and significantly improves trade quality.
📊 Built-in Multi-Timeframe Analysis
The indicator features native multi-timeframe logic:
H1 / 15-minute charts: for structural analysis and identification of Supply & Demand zones (SMC);
M1 / M5 charts: for precise trade execution, with targeted entries and dynamic risk management.
SMC zones are calculated on higher timeframes (e.g., 4H) to ensure structural reliability, while actual trade signals trigger on lower timeframes for maximum precision.
⚙️ Advanced Customization
Full choice of moving average type (SMA, EMA, WMA, RMA, VWMA, HULL, TEMA, ZLEMA, etc.);
Revenge Trading logic: after a stop loss is hit without reaching the 1:1 breakeven level, the indicator automatically prepares for a counter-trade;
Dynamic ATR-based stop loss with customizable multiplier;
Session filters to trade only during optimal liquidity windows (e.g., European session).
🧠 Who Is It For?
This indicator is ideal for traders who:
Primarily trade indices;
Prefer mean reversion strategies over pure trend-following;
Seek a disciplined, rule-based system with multiple confluence filters;
Use a multi-timeframe approach to separate analysis from execution.
In short: Initial Balance SMC-V3 is more than just an indicator—it’s a complete trading framework for mean reversion on index markets, where every signal emerges from a confluence of statistical, structural, and temporal factors.
Happy trading! 📈

Hosoda’s CloudsMany investors aim to develop trading systems with a high win rate, mistakenly associating it with substantial profits. In reality, high returns are typically achieved through greater exposure to market trends, which inevitably lowers the win rate due to increased risk and more volatile conditions.
The system I present, called “Hosoda’s Clouds” in honor of Goichi Hosoda , the creator of the Ichimoku Kinko Hyo indicator, is likely one of the first profitable systems many traders will encounter. Designed to capture trends, it performs best in markets with clear directional movements and is less suitable for range-bound markets like Forex, which often exhibit lateral price action.
This system is not recommended for low timeframes, such as minute charts, due to the random and emotionally driven nature of price movements in those periods. For a deeper exploration of this topic, I recommend reading my article “Timeframe is Everything”, which discusses the critical importance of selecting the appropriate timeframe.
I suggest testing and applying the “Hosoda’s Clouds” strategy on assets with a strong trending nature and a proven track record of performance. Ideal markets include Tesla (1-hour, 4-hour, and daily), BTC/USDT (daily), SPY (daily), and XAU/USD (daily), as these have consistently shown clear directional trends over time.
Commissions and Configuration
Commissions can be adjusted in the system’s settings to suit individual needs. For evaluating the effectiveness of “Hosoda’s Clouds,” I’ve used a standard commission of $1 per order as a baseline, though this can be modified in the code to accommodate different brokers or preferences.
The margin per trade is set to $1,000 by default, but users are encouraged to experiment with different margin settings in the configuration to match their trading style.
Rules of the “Hosoda’s Clouds” System (Bullish Strategy)
This strategy is designed to capture trending movements in bullish markets using the Ichimoku Kinko Hyo indicator. The rules are as follows:
Long Entry: A long position is triggered when the Tenkan-sen crosses above the Kijun-sen below the Ichimoku cloud, identifying potential reversals or bounces in a bearish context.
Stop Loss (SL): Placed at the low of the candle 12 bars prior to the entry candle. This setting has proven optimal in my tests, but it can be adjusted in the code based on risk tolerance.
Take Profit (TP): The position is closed when the Tenkan-sen crosses below the bottom of the Ichimoku cloud (the minimum of Senkou Span A and Senkou Span B).
Notes on the Code
margin_long=0: Ideal for strategies requiring a fixed position size, particularly useful for manual entries or testing with a constant capital allocation.
margin_long=100: Recommended for high-frequency systems where positions are closed quickly, simulating gradual growth based on realized profits and reflecting real-world broker constraints.
System Performance
The following performance metrics account for $1 per order commissions and were tested on the specified assets and timeframes:
Tesla (H1)
Trades: 148
Win Rate: 29.05%
Period: Jan 2, 2014 – Jan 6, 2020 (+172%)
Simple Annual Growth Rate: +34.3%
Trades: 130
Win Rate: 30.77%
Period: Jan 2, 2020 – Sep 24, 2025 (+858.90%)
Simple Annual Growth Rate: +150.7%
Tesla (H4)
Trades: 102
Win Rate: 32.35%
Period: Jun 29, 2010 – Sep 24, 2025 (+11,356.36%)
Simple Annual Growth Rate: +758.5%
Tesla (Daily)
Trades: 56
Win Rate: 35.71%
Period: Jun 29, 2010 – Sep 24, 2025 (+3,166.64%)
Simple Annual Growth Rate: +211.5%
BTC/USDT (Daily)
Trades: 44
Win Rate: 31.82%
Period: Sep 30, 2017 – Sep 24, 2025 (+2,592.23%)
Simple Annual Growth Rate: +324.8%
SPY (Daily)
Trades: 81
Win Rate: 37.04%
Period: Jan 23, 1993 – Sep 24, 2025 (+476.90%)
Simple Annual Growth Rate: +14.3%
XAU/USD (Daily)
Trades: 216
Win Rate: 32.87%
Period: Jan 6, 1833 – Sep 24, 2025 (+5,241.73%)
Simple Annual Growth Rate: +27.1%
SPX (Daily)
Trades: 217
Win Rate: 38.25%
Period: Feb 1, 1871 – Sep 24, 2025 (+16,791.02%)
Simple Annual Growth Rate: +108.1%
Conclusion
With the “ Hosoda’s Clouds ” strategy, I aim to showcase the potential of technical analysis to generate consistent profits in trending markets, challenging recent doubts about its effectiveness. My goal is for this system to serve as both a practical tool for traders and a source of inspiration for the trading community I deeply respect. I hope it encourages the creation of new strategies, fosters creativity in technical analysis, and empowers traders to approach the markets with confidence and discipline.

MC WITH ALERTS DINESH SETHIYAManipulation Candle (MC): A candlestick that initially suggests price movement in one direction but then reverses, manipulating liquidity and closing in the opposite direction.
Types of MCs:
Bullish MC: Takes out the previous candle's low, reverses, takes out the previous candle's high, and closes above it.
Bearish MC: Takes out the previous candle's high, reverses, takes out the previous candle's low, and closes below it.
Ideal MC Characteristic: The rejection wick (bottom wick for bullish MC, top wick for bearish MC) should be larger than the directional wick.

Stochastic 6TF by jjuiiStochastic 6TF by J is a Multi-Timeframe (MTF) Stochastic indicator
that displays %K values from up to 6 different timeframes
in a single window. This helps traders analyze momentum
across short, medium, and long-term perspectives simultaneously.
Features:
- Supports 6 customizable timeframes (e.g., 5m, 15m, 1h, 4h, 1D, 1W)
- Option to show/hide each timeframe line
- Standard reference levels (20 / 50 / 80) with background shading
- Smoothed %K for clearer visualization
Best for:
- Cross-timeframe momentum analysis
- Spotting aligned Overbought / Oversold signals
- Confirming market trends and timing entries/exits
-------------------------------------------------------------
Stochastic 6TF by J คืออินดิเคเตอร์ Stochastic Multi Timeframe (MTF)
ที่สามารถแสดงค่า %K จากหลายกรอบเวลา (สูงสุด 6 TF)
ไว้ในหน้าต่างเดียว ช่วยให้นักเทรดมองเห็นโมเมนตัมของราคา
ทั้งระยะสั้น กลาง และยาว พร้อมกัน
คุณสมบัติ:
- เลือกกรอบเวลาได้ 6 ชุด (เช่น 5m, 15m, 1h, 4h, 1D, 1W)
- สามารถเปิด/ปิดการแสดงผลแต่ละ TF ได้
- มีเส้นแนวรับ/แนวต้านมาตรฐาน (20 / 50 / 80)
- ใช้เส้น %K ที่ถูกปรับค่าเฉลี่ยให้เรียบขึ้นเพื่ออ่านง่าย
เหมาะสำหรับ:
- การดูโมเมนตัมข้ามกรอบเวลา
- หาจังหวะ Overbought / Oversold ที่สอดคล้องกันหลาย TF
- ใช้ยืนยันแนวโน้มและหาจังหวะเข้า-ออกอย่างแม่นยำมากขึ้น
Key Levels: Open & Midday🔹 Opening Candle (9:30 AM New York Time)
Plots the high and low of the first 5-minute candle after the market opens.
🔹 12:30 PM Candle (3 hours after open)
Plots the high and low of the candle formed exactly 3 hours after the market opens.
These levels are useful for:
Identifying support/resistance zones.
Creating breakout or reversal strategies.
Tracking intraday momentum shifts.
📌 Important Notes:
Designed for 5-minute charts.
Make sure your chart is set to New York time (exchange time) for accurate levels.
Happy Trading!
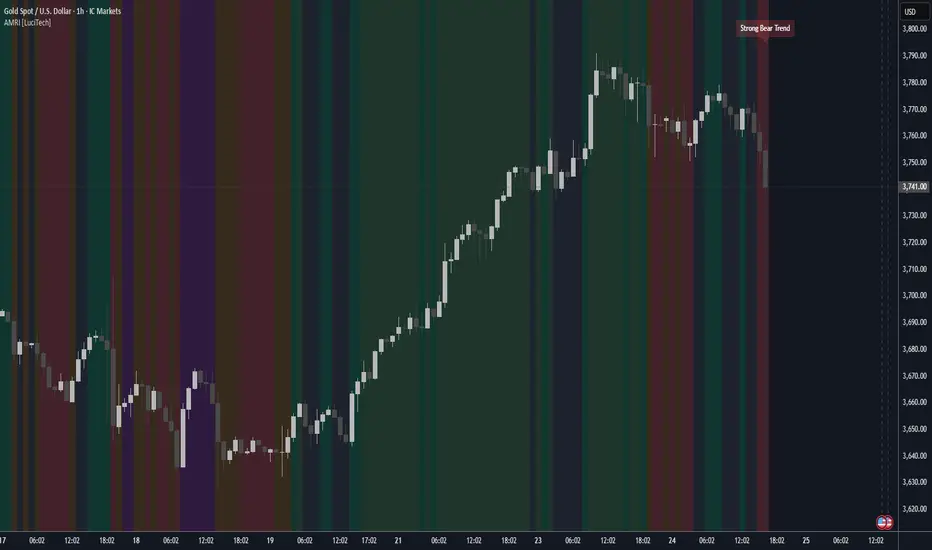
Adaptive Market Regime Identifier [LuciTech]What it Does:
AMRI visually identifies and categorizes the market into six primary regimes directly on your chart using a color-coded background. These regimes are:
-Strong Bull Trend: Characterized by robust upward momentum and low volatility.
-Weak Bull Trend: Indicates upward momentum with less conviction or higher volatility.
-Strong Bear Trend: Defined by powerful downward momentum and low volatility.
-Weak Bear Trend: Suggests downward momentum with less force or increased volatility.
-Consolidation: Periods of low volatility and sideways price action.
-Volatile Chop: High volatility without clear directional bias, often seen during transitions or indecision.
By clearly delineating these states, AMRI helps traders quickly grasp the overarching market context, enabling them to apply strategies best suited for the current conditions (e.g., trend-following in strong trends, range-bound strategies in consolidation, or caution in volatile chop).
How it Works (The Adaptive Edge)
AMRI achieves its adaptive classification by continuously analyzing three core market dimensions, with each component dynamically adjusting to current market conditions:
1.Adaptive Moving Average (KAMA): The indicator utilizes the Kaufman Adaptive Moving Average (KAMA) to gauge trend direction and strength. KAMA is unique because it adjusts its smoothing period based on market efficiency (noise vs. direction). In trending markets, it becomes more responsive, while in choppy markets, it smooths out noise, providing a more reliable trend signal than static moving averages.
2.Adaptive Average True Range (ATR): Volatility is measured using an adaptive version of the Average True Range. Similar to KAMA, this ATR dynamically adjusts its sensitivity to reflect real-time changes in market volatility. This helps AMRI differentiate between calm, ranging markets and highly volatile, directional moves or chaotic periods.
3.Normalized Slope Analysis: The slope of the KAMA is normalized against the Adaptive ATR. This normalization provides a robust measure of trend strength that is relative to the current market volatility, making the thresholds for strong and weak trends more meaningful across different instruments and timeframes.
These adaptive components work in concert to provide a nuanced and responsive classification of the market regime, minimizing lag and reducing false signals often associated with fixed-parameter indicators.
Key Features & Originality:
-Dynamic Regime Classification: AMRI stands out by not just indicating trend or range, but by classifying the type of market regime, offering a higher-level analytical framework. This is a meta-indicator that provides context for all other trading tools.
-Adaptive Core Metrics: The use of KAMA and an Adaptive ATR ensures that the indicator remains relevant and responsive across diverse market conditions, automatically adjusting to changes in volatility and trend efficiency. This self-adjusting nature is a significant advantage over indicators with static lookback periods.
-Visual Clarity: The color-coded background provides an immediate, at-a-glance understanding of the current market regime, reducing cognitive load and allowing for quicker decision-making.
-Contextual Trading: By identifying the prevailing regime, AMRI empowers traders to select and apply strategies that are most effective for that specific environment, helping to avoid costly mistakes of using a trend-following strategy in a ranging market, or vice-versa.
-Originality: While components like KAMA and ATR are known, their adaptive integration into a comprehensive, multi-regime classification system, combined with normalized slope analysis for trend strength, offers a novel approach to market analysis not commonly found in publicly available indicators.
Multi-Symbol Volatility Tracker with Range DetectionMulti-Symbol Volatility Tracker with Range Detection
🎯 Main Purpose:
This indicator is specifically designed for scalpers to quickly identify symbols with high volatility that are currently in ranging conditions . It helps you spot the perfect opportunities for buying at lows and selling at highs repeatedly within the same trading session.
📊 Table Data Explanation:
The indicator displays a comprehensive table with 5 columns for 4 major symbols (GOLD, SILVER, NASDAQ, SP500):
SYMBOL: The trading instrument being analyzed
VOLATILITY: Color-coded volatility levels (NORMAL/HIGH/EXTREME) based on ATR values
Last Candle %: The percentage range of the most recent 5-minute candle
Last 5 Candle Avg %: Average percentage range over the last 5 candles
RANGE: Shows "YES" (blue) or "NO" (gray) indicating if the symbol is currently ranging
🔍 How to Identify Trading Opportunities:
Look for symbols that combine these characteristics:
RANGE column shows "YES" (highlighted in blue) - This means the symbol is moving sideways, perfect for range trading
VOLATILITY shows "HIGH" or "EXTREME" - Ensures there's enough movement for profitable scalping
Higher candlestick percentages - Indicates larger candle ranges, meaning more profit potential per trade
⚡ Optimal Usage:
Best Timeframe: Works optimally on 5-minute charts where the ranging patterns are most reliable for scalping
Trading Strategy: When you find a symbol with "YES" in the RANGE column, switch to that symbol and look for opportunities to buy near the lows and sell near the highs of the ranging pattern
Risk Management: Higher volatility symbols offer more profit potential but require tighter risk management
⚙️ Settings:
ATR Length: Adjusts the Average True Range calculation period (default: 14)
Range Sensitivity: Fine-tune range detection sensitivity (0.1-2.0, lower = more sensitive)
💡 Pro Tips:
The indicator updates in real-time, so monitor for symbols switching from "NO" to "YES" in the RANGE column
Combine HIGH/EXTREME volatility with RANGE: YES for the most profitable scalping setups
Use the candlestick percentages to gauge potential profit per trade - higher percentages mean more movement
The algorithm uses advanced statistical analysis including standard deviation, linear regression slopes, and range efficiency to accurately detect ranging conditions
Perfect for day traders and scalpers who want to quickly identify which symbols offer the best ranging opportunities for consistent buy-low, sell-high strategies.
