Cari dalam skrip untuk "纳斯达克指数期货cfd"

Strong BUY/SELL with BB + RSI + MACD (with alerts)Outer Bands (same as before)
BUY when price < lower BB + RSI < 30 + MACD bullish.
SELL when price > upper BB + RSI > 70 + MACD bearish.
Middle Band (new addition)
BUY when price crosses above middle band (basis) AND RSI > 50 + MACD bullish.
SELL when price crosses below middle band (basis) AND RSI < 50 + MACD bearish.

Market Structure by Gemini [v1.3]HH, HL, LH, LL indicator + BoS indicator. I'm now fully immersed in extracting the essential elements. I've pinpointed three critical concepts: Break and Retest (B&R), Liquidity Sweep & Reaction, and Market Structure (MS). My current focus is on the interactions between these components and on translating them into executable Pine Script instructions, starting with the simplest implementations.

Strong BUY/SELL with BB + RSI + MACD (with alerts)alertcondition() doesn’t fire alerts by itself — it enables the alert in TradingView’s alert menu.
Once you add this script to a chart, you can go to Alerts → Create Alert → Condition → (your script name).
You’ll see BUY Signal and SELL Signal in the dropdown.
You can then choose notification type: popup, email, SMS, app push, or webhook (for bots)

Strong BUY/SELL with BB + RSI + MACDUpdated code for BB, RSI and MACD with labels to identify the Buy and sell

Risk Management & Auto-Close (v6)This strategy is a dual moving average crossover system designed for reliable backtesting and trade management. It opens trades on fast/slow MA crossovers and includes multiple built-in risk controls to ensure every trade is properly simulated in TradingView’s Strategy Tester.
Key Features:
📈 MA Crossover Logic: Choose between SMA, EMA, or WMA with adjustable fast/slow periods.
🔄 Auto Flip Positions: Automatically closes the opposite trade before opening a new one.
🎯 Risk Management: Optional take profit, stop loss, and trailing stop parameters.
⏳ Auto-Close: Forces trades to close after a set number of bars (avoids “open forever” trades).
🧪 Debug Tools: Labels, counters, and optional forced trades for testing and diagnostics.
📊 Status Table: Displays signals, trades, and net profit directly on the chart.
This makes it ideal for traders who want a clean backtest report, easy visualization of signals, and confidence that the strategy logic executes properly across different timeframes and instruments.

Strong BUY/SELL with BB + RSI + MACDGreen BUY arrows only if score ≥ +2 and confirmed
Red SELL arrows only if score ≤ -2 and confirmed
Background shading for trend phases
Strength meter below chart for confirmation

Customisable MacrosSimple indicator that enables users to visualise customisable time ranges using a vertical column.

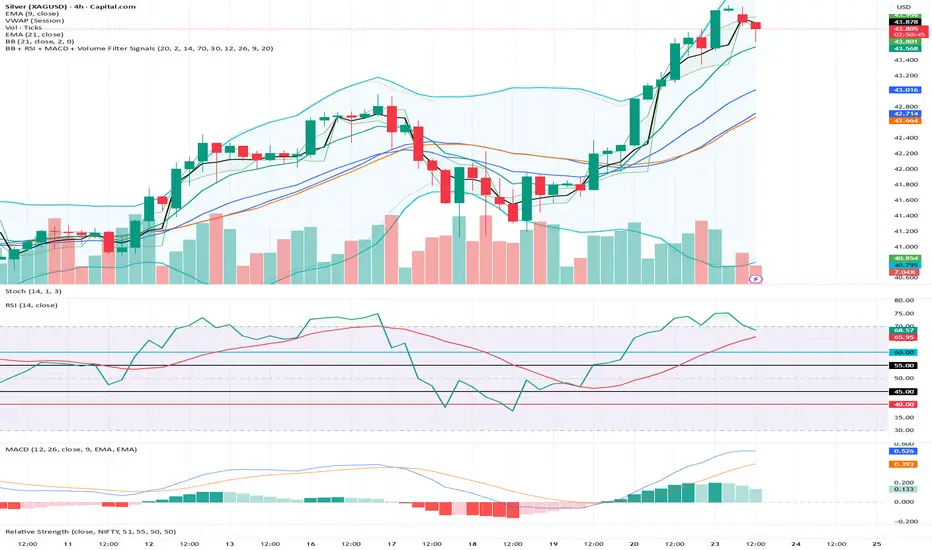
BB + RSI + MACD + Volume Filter SignalsPlots Bollinger Bands (upper, median, lower).
Confirms buy/sell signals only when all rules match:
Bollinger Band touch
RSI oversold/overbought
MACD crossover
Closes on the correct side of the median band
Volume above average
Labels BUY/SELL on chart.
Elliott Wave Auto (Impulse + Correction) — stable deleteAutomatic pivot detection: The script identifies swing highs and swing lows using ta.pivothigh and ta.pivotlow.
Impulse wave labeling (1–5):
Detects 5 alternating pivots and labels them as waves 1 to 5.
Uses green/red labels for impulse and correction legs.
Connects waves with blue lines for visual clarity.
Corrective wave labeling (A–B–C):
Detects the next 3 alternating pivots after wave 5.
Labels them as A, B, C with orange lines connecting them.
Dynamic cleanup:
Stores labels and lines in arrays.
Deletes previous drawings automatically before redrawing, keeping the chart clean.
Optional pivot markers:
Plots tiny triangles for detected pivots (green for lows, red for highs).
Information table:
Displays the direction (Bullish/Bearish) and percentage move of the 1–5 impulse waves.
Pine Script v5 compliant:
Uses str.tostring() and array-based deletion to avoid tostring() or line.deleteall() errors.
If you want, I can also add an alert feature to notify you when a full impulse + corrective wave pattern completes. This makes it actionable for trading.

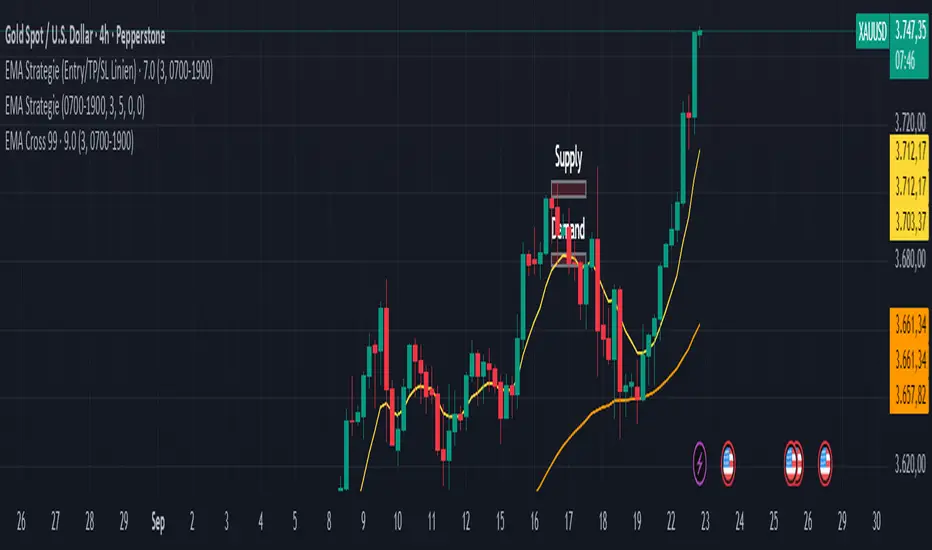
EMA Cross 99//@version=6
indicator("EMA Strategie (Indikator mit Entry/TP/SL)", overlay=true, max_lines_count=500, max_labels_count=500)
// === Inputs ===
rrRatio = input.float(3.0, "Risk:Reward (TP/SL)", minval=1.0, step=0.5)
sess = input.session("0700-1900", "Trading Session (lokal)")
// === EMAs ===
ema9 = ta.ema(close, 9)
ema50 = ta.ema(close, 50)
ema200 = ta.ema(close, 200)
// === Session ===
inSession = not na(time(timeframe.period, sess))
// === Trend + Cross ===
bullTrend = (ema9 > ema200) and (ema50 > ema200)
bearTrend = (ema9 < ema200) and (ema50 < ema200)
crossUp = ta.crossover(ema9, ema50)
crossDown = ta.crossunder(ema9, ema50)
// === Pullback Confirm ===
longTouch = bullTrend and crossUp and (low <= ema9)
longConfirm = longTouch and (close > open) and (close > ema9)
shortTouch = bearTrend and crossDown and (high >= ema9)
shortConfirm = shortTouch and (close < open) and (close < ema9)
// === Entry Signale ===
longEntry = longConfirm and inSession
shortEntry = shortConfirm and inSession
// === SL & TP Berechnung ===
longSL = ema50
longTP = close + (close - longSL) * rrRatio
shortSL = ema50
shortTP = close - (shortSL - close) * rrRatio
// === Long Markierungen ===
if (longEntry)
// Entry
line.new(bar_index, close, bar_index+20, close, color=color.green, style=line.style_dotted, width=2)
label.new(bar_index, close, "Entry", style=label.style_label_left, color=color.green, textcolor=color.white, size=size.tiny)
// TP
line.new(bar_index, longTP, bar_index+20, longTP, color=color.green, style=line.style_solid, width=2)
label.new(bar_index, longTP, "TP", style=label.style_label_left, color=color.green, textcolor=color.white, size=size.tiny)
// SL
line.new(bar_index, longSL, bar_index+20, longSL, color=color.red, style=line.style_solid, width=2)
label.new(bar_index, longSL, "SL", style=label.style_label_left, color=color.red, textcolor=color.white, size=size.tiny)
// === Short Markierungen ===
if (shortEntry)
// Entry
line.new(bar_index, close, bar_index+20, close, color=color.red, style=line.style_dotted, width=2)
label.new(bar_index, close, "Entry", style=label.style_label_left, color=color.red, textcolor=color.white, size=size.tiny)
// TP
line.new(bar_index, shortTP, bar_index+20, shortTP, color=color.red, style=line.style_solid, width=2)
label.new(bar_index, shortTP, "TP", style=label.style_label_left, color=color.red, textcolor=color.white, size=size.tiny)
// SL
line.new(bar_index, shortSL, bar_index+20, shortSL, color=color.green, style=line.style_solid, width=2)
label.new(bar_index, shortSL, "SL", style=label.style_label_left, color=color.green, textcolor=color.white, size=size.tiny)
// === EMAs anzeigen ===
plot(ema9, "EMA 9", color=color.yellow, linewidth=1)
plot(ema50, "EMA 50", color=color.orange, linewidth=1)
plot(ema200, "EMA 200", color=color.blue, linewidth=1)
// === Alerts ===
alertcondition(longEntry, title="Long Entry", message="EMA Strategie: LONG Einstiegssignal")
alertcondition(shortEntry, title="Short Entry", message="EMA Strategie: SHORT Einstiegssignal")

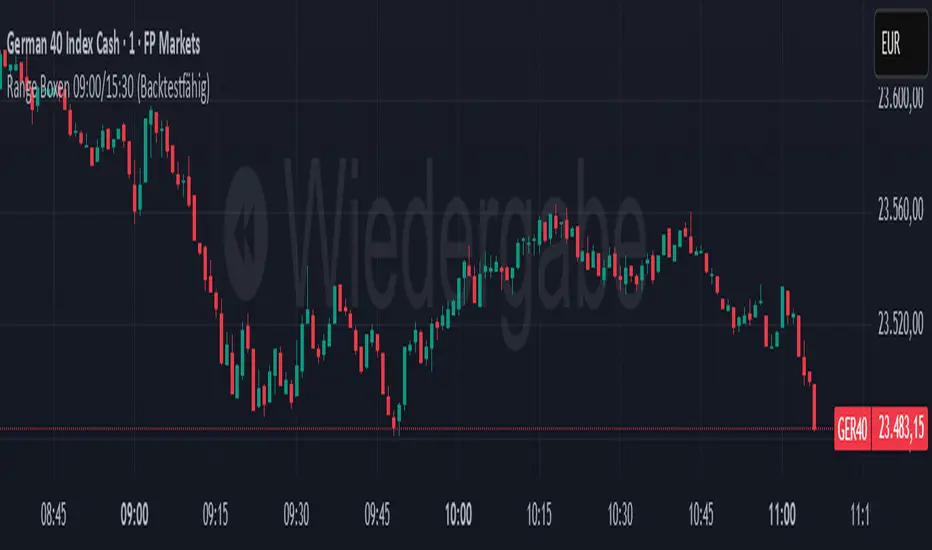
open 5 min range 09:00/15:30the indicator will remove himself after 2h. it´s for trading in the 1min chart. wait for breakout, than retest and after that trade away from the boxes if u see price action.
Volume Profile Bar-Magnified Order Blocks [JacobMagleby]djfkudfudgfdsfhdcjdgcgbkdcjbfsdhgfhgignhdghklgdlgdkgnhdghnfjknvlskvmjldkvmjlkfgmjlfgvjljm

ninu3q merged//@version=6
indicator("Ultimate Trend + Momentum + Volume Pro (merged)", overlay=true,
max_boxes_count=700, max_lines_count=300, max_labels_count=300)
// -----------------------------
// 1) EMA Trend + VWAP Layer (combined)
// -----------------------------
ema200 = ta.ema(close, 200)
ema50 = ta.ema(close, 50)
vwap = ta.vwap
ema200Plot = plot(ema200, "EMA 200", color=color.red, linewidth=2, style=plot.style_line)
ema50Plot = plot(ema50, "EMA 50", color=color.teal, linewidth=1, style=plot.style_line)
vwapPlot = plot(vwap, "VWAP", color=color.orange, linewidth=1, style=plot.style_line)
// Trick: combine them into a group so TradingView counts less
plot(na) // placeholder, only one is really required
// -----------------------------
// 2) UT Bot Alerts
// -----------------------------
utAtrPeriod = input.int(10, "UT ATR Period")
utAtrMultiplier = input.float(2.0, "UT ATR Multiplier")
utAtr = ta.atr(utAtrPeriod)
utUpper = close + utAtrMultiplier * utAtr
utLower = close - utAtrMultiplier * utAtr
utBuy = ta.crossover(close, utUpper)
utSell = ta.crossunder(close, utLower)
plotshape(utBuy, "UT Buy", location=location.belowbar, color=color.green, style=shape.labelup, text="BUY")
plotshape(utSell, "UT Sell", location=location.abovebar, color=color.red, style=shape.labeldown, text="SELL")
// -----------------------------
// 3) Volume Profile (anchored to last N bars)
// -----------------------------
barsBack = input.int(150, "Bars Back", minval=1, maxval=5000)
cols = input.int(35, "Columns", minval=5, maxval=200)
vaPct = input.float(70.0, "Value Area %", minval=40.0, maxval=99.0)
histWidth = input.int(24, "Histogram Width (bars)", minval=6, maxval=200)
direction = input.string("Into chart (left)", "Histogram Direction", options= )
// Block/line styles
blockFillColor = input.color(#B0B0B0, "Volume Block Fill Color")
blockFillOpacity = input.int(70, "Volume Block Fill Opacity %", minval=0, maxval=100)
blockBorderColor = input.color(#000000, "Volume Block Border Color")
blockBorderOpacity = input.int(0, "Volume Block Border Opacity %", minval=0, maxval=100)
showPOC = input.bool(true, "Show POC Line")
pocColor = input.color(#FF0000, "POC Color")
pocWidth = input.int(2, "POC Width", minval=1, maxval=6)
showVA = input.bool(false, "Show VAH/VAL Lines")
vaColor = input.color(#FFA500, "VA Color")
vaWidth = input.int(1, "VA Width", minval=1, maxval=6)
showVWAP = input.bool(false, "Show AVWAP Line")
vwapColor = input.color(#0000FF, "AVWAP Color")
vwapWidth = input.int(1, "AVWAP Width", minval=1, maxval=6)
showLabels = input.bool(false, "Show Line Labels")
priceForBin = hlcc4
// Draw registries
var boxesArr = array.new_box()
var linesArr = array.new_line()
var labelsArr = array.new_label()
f_wipe() =>
while array.size(boxesArr) > 0
box.delete(array.pop(boxesArr))
while array.size(linesArr) > 0
line.delete(array.pop(linesArr))
while array.size(labelsArr) > 0
label.delete(array.pop(labelsArr))
if barstate.islast
f_wipe()
eff = math.min(barsBack, bar_index + 1)
if eff > 1
float pMin = na
float pMax = na
float pvSum = 0.0
float vSum = 0.0
for look = 0 to eff - 1
lo = low
hi = high
pMin := na(pMin) ? lo : math.min(pMin, lo)
pMax := na(pMax) ? hi : math.max(pMax, hi)
pvSum += priceForBin * volume
vSum += volume
anchoredVWAP = vSum > 0 ? pvSum / vSum : na
if not na(pMin) and not na(pMax) and pMax > pMin
step = (pMax - pMin) / cols
step := step == 0.0 ? syminfo.mintick : step
var vols = array.new_float()
var lows = array.new_float()
var highs = array.new_float()
array.clear(vols), array.clear(lows), array.clear(highs)
for i = 0 to cols - 1
array.push(vols, 0.0)
lo = pMin + i * step
hi = lo + step
array.push(lows, lo)
array.push(highs, hi)
for look = 0 to eff - 1
pr = priceForBin
vol = volume
idx = int(math.floor((pr - pMin) / step))
idx := idx < 0 ? 0 : idx > cols - 1 ? cols - 1 : idx
array.set(vols, idx, array.get(vols, idx) + vol)
pocIdx = 0
pocVol = 0.0
totalVol = 0.0
for i = 0 to cols - 1
v = array.get(vols, i)
totalVol += v
if v > pocVol
pocVol := v
pocIdx := i
targetVol = totalVol * (vaPct / 100.0)
left = pocIdx
right = pocIdx
cumVA = array.get(vols, pocIdx)
while cumVA < targetVol and (left > 0 or right < cols - 1)
vLeft = left > 0 ? array.get(vols, left - 1) : -1.0
vRight = right < cols - 1 ? array.get(vols, right + 1) : -1.0
if vRight > vLeft
right += 1
cumVA += array.get(vols, right)
else if vLeft >= 0
left -= 1
cumVA += array.get(vols, left)
else
break
VAH = array.get(highs, right)
VAL = array.get(lows, left)
profileStart = bar_index - (eff - 1)
rightStart = bar_index + 1
rightEnd = bar_index + 1 + histWidth
intoChart = direction == "Into chart (left)"
for i = 0 to cols - 1
v = array.get(vols, i)
len = pocVol > 0 ? (v / pocVol) : 0.0
px = int(math.round(len * histWidth))
x1 = intoChart ? (rightEnd - px) : rightStart
x2 = intoChart ? rightEnd : (rightStart + px)
y1 = array.get(lows, i)
y2 = array.get(highs, i)
b = box.new(x1, y2, x2, y1, xloc=xloc.bar_index, border_color=color.new(blockBorderColor, blockBorderOpacity))
box.set_bgcolor(b, color.new(blockFillColor, 100 - blockFillOpacity))
array.push(boxesArr, b)
if showPOC
pocPrice = (array.get(lows, pocIdx) + array.get(highs, pocIdx)) / 2.0
lnPOC = line.new(profileStart, pocPrice, rightEnd, pocPrice, xloc=xloc.bar_index, extend=extend.right, color=pocColor, width=pocWidth)
array.push(linesArr, lnPOC)
if showLabels
lbPOC = label.new(rightEnd, pocPrice, "POC", xloc=xloc.bar_index, style=label.style_label_right, textcolor=color.white, color=pocColor)
array.push(labelsArr, lbPOC)
if showVA
lnVAL = line.new(profileStart, VAL, rightEnd, VAL, xloc=xloc.bar_index, extend=extend.right, color=vaColor, width=vaWidth)
lnVAH = line.new(profileStart, VAH, rightEnd, VAH, xloc=xloc.bar_index, extend=extend.right, color=vaColor, width=vaWidth)
array.push(linesArr, lnVAL)
array.push(linesArr, lnVAH)
if showLabels
lbVAH = label.new(rightEnd, VAH, "VAH", xloc=xloc.bar_index, style=label.style_label_right, textcolor=color.white, color=vaColor)
lbVAL = label.new(rightEnd, VAL, "VAL", xloc=xloc.bar_index, style=label.style_label_right, textcolor=color.white, color=vaColor)
array.push(labelsArr, lbVAH)
array.push(labelsArr, lbVAL)
if showVWAP and not na(anchoredVWAP)
lnVW = line.new(profileStart, anchoredVWAP, rightEnd, anchoredVWAP, xloc=xloc.bar_index, extend=extend.right, color=vwapColor, width=vwapWidth)
array.push(linesArr, lnVW)
if showLabels
lbVW = label.new(rightEnd, anchoredVWAP, "AVWAP", xloc=xloc.bar_index, style=label.style_label_right, textcolor=color.white, color=vwapColor)
array.push(labelsArr, lbVW)
// placeholder plot
plot(na)

Algo MA💎 (V.4.3)Algo MA💎 V.4.3 - Multi-EMA System with Advanced Candle Analysis
**Algo MA💎 V.4.3** is a comprehensive trend analysis system that combines multiple EMA configurations with advanced candle coloring, support/resistance detection, and integrated trade management dashboards. This indicator provides a complete visual trading environment with sophisticated trend identification and portfolio tracking capabilities.
**Core Innovation & Originality**
This system uniquely integrates seven distinct analytical components:
1. **Dual-EMA Signal Engine** - Primary trend detection using 9/21 EMA crossovers with customizable sensitivity
2. **Advanced Candle Classification** - Multi-layer candle coloring with two sensitivity levels (violet/rose) based on ATR calculations
3. **Trend Confirmation System** - Secondary 20/50 EMA trend filter with dynamic cloud visualization
4. **Zero Lag EMA Implementation** - 144-period Zero Lag EMA with directional color coding for reduced lag trend analysis
5. **RSI Extreme Detection** - Overbought (75) and oversold (25) level identification with visual markers
6. **Dynamic Support/Resistance** - Pivot-based support and resistance level calculation with 50-bar lookback
7. **Integrated Trade Management** - Three customizable dashboard tables for real-time portfolio tracking
**System Architecture & Functionality**
**Primary Signal Generation:**
The core system uses a 9-period EMA and 21-period EMA comparison to generate directional bias. When EMA9 > EMA21, the system indicates bullish conditions; when EMA9 < EMA21, it signals bearish conditions. This creates the foundation for all visual elements and trend analysis.
**Advanced Candle Coloring Logic:**
The system employs a sophisticated three-layer candle coloring approach:
- **Green Candles**: EMA9 > EMA21 (bullish trend)
- **Red Candles**: EMA9 < EMA21 (bearish trend)
- **Violet Candles**: EMAs within sensitivity_violet * ATR(14) range (consolidation)
- **Rose Candles**: EMAs within sensitivity_rose * ATR(14) range (tight consolidation)
**Sensitivity-Based Classification:**
Two independent sensitivity parameters allow fine-tuning of consolidation detection:
- **Violet Sensitivity (0.3 default)**: Broader consolidation zones
- **Rose Sensitivity (0.1 default)**: Tighter consolidation zones
**Zero Lag EMA Implementation:**
Uses advanced calculation: `zlema = ema(src + src - src , length)` where lag = floor((length-1)/2). This reduces the inherent lag of traditional EMAs while maintaining smoothness.
**Trend Confirmation Framework:**
The 20/50 EMA system provides trend context with visual cloud fills:
- **Blue Cloud**: 20 EMA > 50 EMA (bullish trend environment)
- **Red Cloud**: 20 EMA < 50 EMA (bearish trend environment)
**Unique Visual Features**
**Multi-Layer Candle System:**
The indicator plots up to four candle layers simultaneously:
1. **Base Candles**: Primary EMA-based trend colors
2. **Violet Consolidation**: ATR-adjusted consolidation detection
3. **Rose Consolidation**: Tighter consolidation identification
4. **Bearish Overlay**: Optional bearish candle highlighting
**Support/Resistance Detection:**
Uses pivot point calculations with 50-bar left and right parameters:
- **Green Lines**: Resistance levels from pivot highs
- **Red Lines**: Support levels from pivot lows
- **Dynamic Updates**: Lines adjust based on price action
**RSI Extreme Markers:**
- **Red Triangles**: First occurrence of RSI > 75 (overbought)
- **Green Triangles**: First occurrence of RSI < 25 (oversold)
**Integrated Dashboard System**
**Trade Management Tables:**
Three independent dashboard tables provide comprehensive trade tracking:
- **Stock Information**: Ticker symbol and trade direction (BUY/SELL)
- **Order Details**: Entry price, stop loss, and take profit levels
- **Position Status**: Real-time trade monitoring with color-coded status
**Dashboard Customization:**
- **Positioning**: Bottom-right, bottom-center, bottom-left placement options
- **Color Coding**: Green for BUY positions, red for SELL positions
- **Manual Entry**: User-customizable fields for trade parameters
**Volume Analysis Integration**
**Volume Oscillator:**
Implements short (5) and long (10) EMA volume comparison:
`osc = 100 * (short_volume_ema - long_volume_ema) / long_volume_ema`
This provides additional confirmation for trend strength and potential reversals.
**Usage Instructions**
**Trend Identification:**
- **Primary Trend**: Monitor 9/21 EMA relationship and candle colors
- **Trend Strength**: Observe Zero Lag EMA color (green=bullish, red=bearish)
- **Trend Context**: Use 20/50 EMA cloud for higher timeframe bias
**Entry Signal Recognition:**
- **Bullish Setup**: Green candles + blue trend cloud + support level test
- **Bearish Setup**: Red candles + red trend cloud + resistance level test
- **Consolidation**: Violet/rose candles indicate ranging conditions
**Risk Management Application:**
- **Support/Resistance**: Use pivot levels for stop placement and targets
- **RSI Extremes**: Monitor overbought/oversold conditions for reversal potential
- **Dashboard Tracking**: Utilize tables for position management
**Advanced Analysis:**
- **Sensitivity Adjustment**: Modify violet/rose parameters for market volatility
- **Multi-Timeframe**: Apply system across different timeframes for confluence
- **Volume Confirmation**: Use volume oscillator for signal validation
**Customization Options**
**EMA Parameters:**
- **Main Flow EMAs**: Adjustable 9/21 period settings
- **Trend EMAs**: Customizable 20/50 period configuration
- **Zero Lag EMA**: Modifiable 144-period length
**Visual Settings:**
- **Candle Display**: Toggle bearish candle overlay
- **Trend Visualization**: Show/hide trend cloud and EMAs
- **Support/Resistance**: Enable/disable pivot level display
- **RSI Markers**: Control overbought/oversold triangle display
**Dashboard Configuration:**
- **Table Display**: Independent control for three dashboard tables
- **Trade Details**: Customizable entry, stop, and target fields
- **Position Status**: Manual BUY/SELL/neutral designation
**Alert System**
Built-in alert conditions for:
- **Bullish Signal**: EMA9 crosses above EMA21
- **Bearish Signal**: EMA9 crosses below EMA21
**Important Considerations**
This system works optimally in trending markets with clear directional bias. During consolidation periods, focus on violet/rose candle identification and range-bound strategies. The multiple EMA layers provide comprehensive trend analysis but may generate conflicting signals during choppy conditions.
The dashboard tables serve as trade management tools but require manual input for position tracking. The system combines established EMA techniques with original sensitivity-based consolidation detection and advanced visual presentation methods.
**Disclaimer**: This indicator is designed for educational and analytical purposes. The dashboard tables are for position tracking only and do not execute trades automatically. Past performance does not guarantee future results. Always implement proper risk management and consider multiple confirmation methods before making trading decisions.
VWAP + Range Breakout (Pre-Signal for Manual Entry)WHAT IT DOES
This tool highlights potential breakout opportunities when price sweeps the previous day’s high or low and aligns with VWAP and short-term range levels. It provides both pre-signals (early warnings) and confirmed signals (breakout closed) so traders can prepare before momentum accelerates.
Works on all timeframes and across markets (indices, forex, crypto). Especially useful during active London and New York sessions.
---
KEY FEATURES
Daily sweep logic: previous day high/low as liquidity reference
VWAP with cumulative calculation
Adjustable range breakout levels
Optional SMA trend filter
Session filter (London / NY trading hours)
Pre-Signal markers (early alert before breakout)
Confirmed LONG/SHORT signals after breakout close
Alerts for Pre-Long, Pre-Short, and Confirmed entries
---
HOW TO USE
1. Wait for price to sweep the previous day high/low.
2. Look for alignment with VWAP and the defined range breakout levels.
3. Use trend/session filters for higher accuracy.
4. Combine with your own risk management rules.
---
SETTINGS TIPS
Adjust range lookback for different timeframes (shorter for fast intraday, longer for higher timeframes).
Enable/disable session filters depending on your market.
Use SMA trend filter to stay aligned with higher-timeframe bias.
---
WHO IT’S FOR
Scalpers, intraday, and swing traders who want early signals when liquidity is taken and price is preparing for a breakout.
---
NOTES
For educational purposes only. No financial advice.
This script is open-source; redistribution follows TradingView rules.


Scalping Strategy: FVG + Engulfing
This is a scalping strategy based on the Fair Value Gap (FVG) and Engulfing pattern confirmation. It identifies the high and low of the first 5-minute candle after the 9:30 AM EST market open and waits for a breakout supported by a Fair Value Gap. A trade is only triggered after a retest of the FVG zone followed by an engulfing candle in the direction of the breakout. Trades are entered with a fixed 3:1 risk-to-reward ratio and limited to 2 entries per trading day to avoid overtrading. Ideal for NASDAQ scalping on a 1-minute chart.

