VIX Stoch RSI Oscillator [HUD Box + Compression]vix stoch rsi Oscillator
watch volatility without switching charts,
gives signal based off fib levels 0-100 / volatility,
emoji box to show signal,
HUD Box: emoji-coded tactical feedback
bounce 100 "💥 Expansion" :
bounce 0.8 "🔴 Overbought" :
bounce 0.618 "📉 Distribution" :
bounce 0.5 "🧠 Midline" :
bounce 0.382 "📈 Accumulation" :
bounce 0.2 "🟢 Oversold" :
bounce0.0 "💣 Expansion" : "⚪ Neutral"
Tiger EMA/STOCH
This logic checks if the oscillator is trending above or below its 48-period EMA,
If above, it paints the line GREEN🟢 (bullish),
If below, it paints it RED🔴 (bearish),
If compression is active, it overrides both with purple🟣 to highlight tactical squeeze conditions,
⚠️WARNING⚠️
ALWAYS REMEMBER THIS CHART IS VIX/USD
IN MOST CASES SPY MOVES VICE VERSA
I AM NOT RESPOSIBLE FOR YOUR OWN ACTIONS/TRADE IDEAS
AMEX:USD
TVC:VIX
SP:SPX
Cari dalam skrip untuk "纳斯达克指数期货cfd"

Highlight 10-11 AM NY//@version=5
indicator("Highlight 10-11 AM NY", overlay=true)
// Inputs for flexibility
startHour = input.int(10, "Start Hour (NY time)")
endHour = input.int(11, "End Hour (NY time)")
// Check if the current bar is within the session (uses chart time zone)
inSession = (hour(time, syminfo.timezone) >= startHour) and (hour(time, syminfo.timezone) < endHour)
// Highlight background
bgcolor(inSession ? color.new(color.yellow, 85) : na)

ICT Silver Bullet Zones (All Sessions, Custom Labels)CT Silver Bullet Zones
This indicator is designed for traders who follow the ICT *Silver Bullet* concept.
It automatically marks the **Silver Bullet window** (10:00–11:00 by default) across the **London, New York AM, New York PM, and Asia sessions**, with customizable settings for each session.
### Features:
* Separate adjustable time windows for **London, NY AM, NY PM, and Asia Silver Bullet sessions**.
* Colored session boxes with individual **opacity controls**.
* **Session labels placed at the top** of each zone, with customizable text size, color, and background opacity.
* Works on all timeframes and highlights only the Silver Bullet trading windows.
This tool is meant to help traders quickly identify ICT Silver Bullet opportunities in all major sessions without manual plotting.

GBB_lib_fiboLibrary "GBB_lib_fibo"
draw_fibo(high_point, low_point)
draw_fibo
/ @description Draws Fibonacci retracement lines between a high point and a low point.
/ @param high_point (float) Highest point of the move.
/ @param low_point (float) Lowest point of the move.
/ @returns (void) Draws lines on the chart.
Parameters:
high_point (float)
low_point (float)
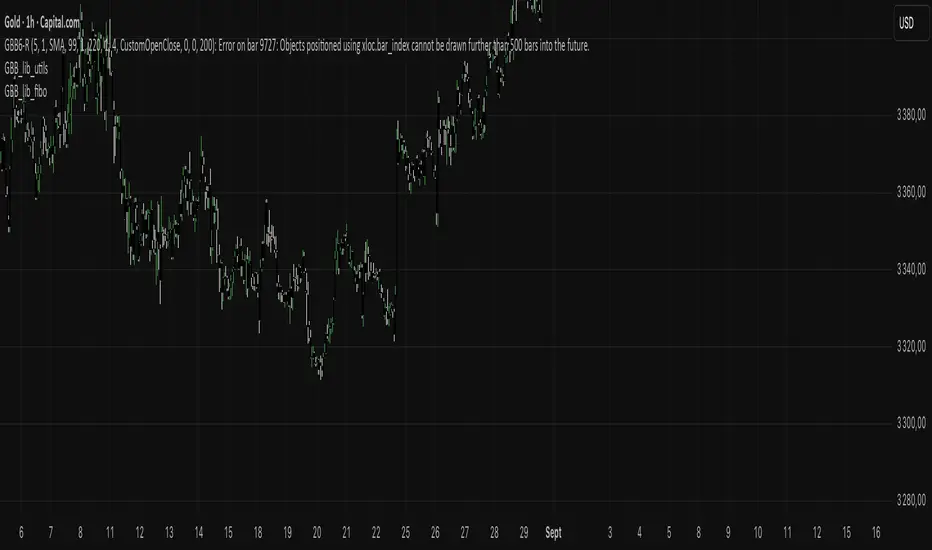
GBB_lib_utilsLibrary "GBB_lib_utils"
gbb_tf_to_display(tf_minutes, tf_string)
gbb_tf_to_display
/ @description Converts minutes and TF string into a short standard label.
/ @param tf_minutes (float)
/ @param tf_string (string)
/ @returns (string) Timeframe label (M1,H1,D1,...)
Parameters:
tf_minutes (float)
tf_string (string)
gbb_convert_bars(_bars)
gbb_convert_bars
/ @description Formats a number of bars into a duration (days, hours, minutes + bar count).
/ @param _bars (int)
/ @returns (string)
Parameters:
_bars (int)
gbb_goldorak_init(_tf5Levels_input)
gbb_goldorak_init
/ @description Builds a contextual message about the current timeframe and optional 5-level TF.
/ @param _tf5Levels_input (string) Alternative timeframe ("" = current timeframe).
/ @returns (string, string, float)
Parameters:
_tf5Levels_input (string)

Fractal FU//@version=5
indicator("Fractal FU", shorttitle="Fractal FU", overlay=true, max_labels_count=500)
// ===== Inputs
showBull = input.bool(true, "Show aligned bullish balls")
showBear = input.bool(true, "Show aligned bearish balls")
bullCol = input.color(color.blue, "Bull ball color")
bearCol = input.color(color.red, "Bear ball color")
ballSize = input.string("small", "Ball size", options= )
gateTo15 = input.bool(true, "Gate to 15m close (clean, fewer signals)")
showDebug = input.bool(false, "Show per-timeframe debug dots")
// ===== Helpers
// one-liner you asked for:
f_sig(res) => request.security(syminfo.tickerid, res, (high > high and low < low ) ? (close > open ? 1 : close < open ? -1 : 0) : 0, barmerge.gaps_off, barmerge.lookahead_off)
// Pull confirmed signals from each TF
sig1 = f_sig("1")
sig5 = f_sig("5")
sig10 = f_sig("10")
sig15 = f_sig("15")
// Alignment (all four agree)
bullAll = showBull and (sig1 == 1 and sig5 == 1 and sig10 == 1 and sig15 == 1)
bearAll = showBear and (sig1 == -1 and sig5 == -1 and sig10 == -1 and sig15 == -1)
// Emit control
emit15 = ta.change(time("15"))
emit = gateTo15 ? emit15 : barstate.isconfirmed // if not gated, show wherever alignment is true
// ===== Debug (tiny dots at bar to verify which TFs are firing)
plotshape(showDebug and sig1 == 1, title="1m bull", style=shape.circle, size=size.tiny, color=color.new(color.blue, 0), location=location.bottom)
plotshape(showDebug and sig5 == 1, title="5m bull", style=shape.circle, size=size.tiny, color=color.new(color.aqua, 0), location=location.bottom)
plotshape(showDebug and sig10 == 1, title="10m bull", style=shape.circle, size=size.tiny, color=color.new(color.teal, 0), location=location.bottom)
plotshape(showDebug and sig15 == 1, title="15m bull", style=shape.circle, size=size.tiny, color=color.new(color.navy, 0), location=location.bottom)
plotshape(showDebug and sig1 == -1, title="1m bear", style=shape.circle, size=size.tiny, color=color.new(color.red, 0), location=location.top)
plotshape(showDebug and sig5 == -1, title="5m bear", style=shape.circle, size=size.tiny, color=color.new(color.orange, 0), location=location.top)
plotshape(showDebug and sig10 == -1, title="10m bear", style=shape.circle, size=size.tiny, color=color.new(color.maroon, 0), location=location.top)
plotshape(showDebug and sig15 == -1, title="15m bear", style=shape.circle, size=size.tiny, color=color.new(color.purple, 0), location=location.top)
// ===== Markers (size must be const → gate each size)
off = gateTo15 ? -1 : 0 // when gated, place on the just-closed 15m bar
// ── Marker offset control stays the same ──
off2 = gateTo15 ? -1 : 0
// ── Bullish balls exactly at LOW ──
plot(bullAll and emit and ballSize == "tiny" ? low : na, title="Bullish tiny", style=plot.style_circles, color=bullCol, linewidth=1, offset=off2)
plot(bullAll and emit and ballSize == "small" ? low : na, title="Bullish small", style=plot.style_circles, color=bullCol, linewidth=2, offset=off2)
plot(bullAll and emit and ballSize == "normal" ? low : na, title="Bullish normal", style=plot.style_circles, color=bullCol, linewidth=3, offset=off2)
plot(bullAll and emit and ballSize == "large" ? low : na, title="Bullish large", style=plot.style_circles, color=bullCol, linewidth=4, offset=off2)
plot(bullAll and emit and ballSize == "huge" ? low : na, title="Bullish huge", style=plot.style_circles, color=bullCol, linewidth=5, offset=off2)
// ── Bearish balls exactly at HIGH ──
plot(bearAll and emit and ballSize == "tiny" ? high : na, title="Bearish tiny", style=plot.style_circles, color=bearCol, linewidth=1, offset=off2)
plot(bearAll and emit and ballSize == "small" ? high : na, title="Bearish small", style=plot.style_circles, color=bearCol, linewidth=2, offset=off2)
plot(bearAll and emit and ballSize == "normal" ? high : na, title="Bearish normal", style=plot.style_circles, color=bearCol, linewidth=3, offset=off2)
plot(bearAll and emit and ballSize == "large" ? high : na, title="Bearish large", style=plot.style_circles, color=bearCol, linewidth=4, offset=off2)
plot(bearAll and emit and ballSize == "huge" ? high : na, title="Bearish huge", style=plot.style_circles, color=bearCol, linewidth=5, offset=off2)
// Alerts
alertcondition(bullAll and emit, title="Aligned Bullish Outside (1/5/10/15)", message="Aligned bullish outside bar on 1/5/10/15m")
alertcondition(bearAll and emit, title="Aligned Bearish Outside (1/5/10/15)", message="Aligned bearish outside bar on 1/5/10/15m")
alertcondition((bullAll or bearAll) and emit, title="Aligned Any (1/5/10/15)", message="Aligned outside bar (bull or bear) on 1/5/10/15m")
GGB_lib_fiboLibrary "GGB_lib_fibo"
draw_fibo(high_point, low_point)
draw_fibo
/ @description Draws Fibonacci retracement lines between a high point and a low point.
/ @param high_point (float) Highest point of the move.
/ @param low_point (float) Lowest point of the move.
/ @returns (void) Draws lines on the chart.
Parameters:
high_point (float)
low_point (float)

ROAD200K Wickrange BarLaa umnuh laanii wick dotor haagdval
wick nii range ni uuruu sonirholiin bus bolj huvirdag

Gold ATR/VOLThis Strategy is not for you it shows Gold how the prices reacts to the ATR and RSI and EMI 20 / 50
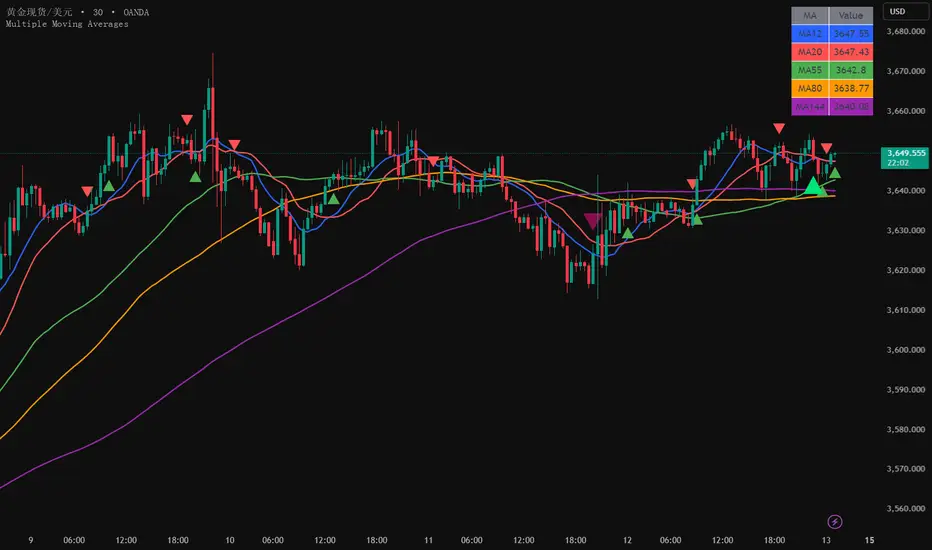
Multiple Moving Averages5 Simple Moving Averages: 12, 20, 55, 80, 144 periods
Different colors: Each moving average uses a different color for easy distinction
Crossover signals: Display crossover signals for MA12/MA20 and MA55/MA144
Value display: Show current specific values of each moving average in a table at the top right corner
Optional EMA: The commented section provides code for the EMA version, which can be uncommented if needed
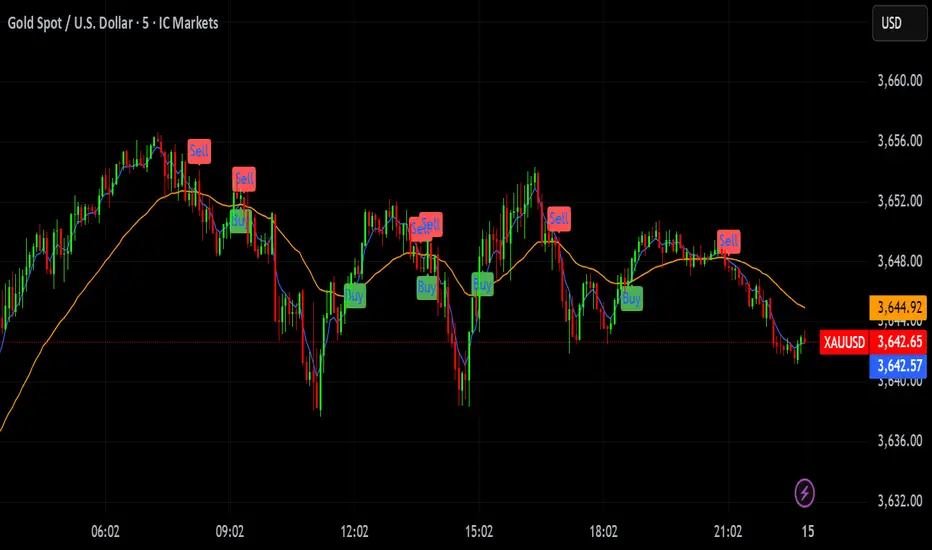
Trend-Strong Candle - 3 EMAs with Filters# Trend-Strong Candle - Professional Trading Indicator
## 📊 What It Does
Identifies high-probability entries by combining triple EMA trend analysis with strong candle detection. Only signals when all conditions align for maximum accuracy.
## 🎯 Core Features
- Triple EMA System: Fast (20) / Medium (50) / Slow (200) for trend confirmation
- Strong Candle Filter: ATR-based sizing ensures genuine momentum
- Advanced Filters: EMA close validation + trend stability checks
- Live Alerts: Instant notifications for real-time signals
- Session Filter: Trade only during active EU/US market hours
## ⚡ Quick Setup
Scalping (1-5min): Default settings + enable session filter
Day Trading (15-60min): Default settings work perfectly
Swing Trading (4H+): Increase ATR multiplier to 0.8-1.0
## 📈 Trading Rules
Long Signals: Green triangle below candle
- Strong bullish candle during confirmed uptrend
- All EMAs properly aligned (Fast > Medium > Slow)
Short Signals: Red triangle above candle
- Strong bearish candle during confirmed downtrend
- All EMAs properly aligned (Fast < Medium < Slow)
## ⚠️ Critical Success Factors
1. Always Verify the Trend Yourself
The indicator helps identify signals, but YOU must confirm the larger trend context. Check higher timeframes and overall market structure before entering.
2. Understand the "Big Players"
Strong candles in trend direction usually come from institutional money (banks, funds, algorithms). These create the momentum that retail traders can follow. The indicator catches these institutional moves.
3. Distance to Next Value Level
NEVER enter if price is too close to major resistance/support levels:
- Check distance to round numbers (1.1000, 1.1050, etc.)
- Ensure at least 20-30 pips room to next key level
- You need space for profit - tight levels = limited upside
4. Risk Management
- Stop Loss: 1-2 ATR from entry
- Take Profit: 2-3 ATR target (minimum 1:2 R/R)
- Position Size: Risk max 1-2% per trade
## 💡 Pro Tips
- Best Sessions: London open (8-12 UTC) and NY open (13-17 UTC)
- Avoid: Major news, low liquidity periods, choppy markets
- Multiple Timeframes: Confirm signals on higher timeframe
- Value Levels: Always check daily/weekly support/resistance before entering
## 🎯 Success Formula
Trend Confirmation + Strong Institutional Candle + Distance to Value Levels = High Probability Trade
*
Remember: The indicator finds the signals, but successful trading requires your analysis of trend context and value level positioning. Trade smart, not just frequent.

Kalman Adjusted Average True Range [BackQuant]Kalman Adjusted Average True Range
A volatility-aware trend baseline that fuses a Kalman price estimate with ATR “rails” to create a smooth, adaptive guide for entries, exits, and trailing risk.
Built on my original Kalman
This indicator is based on my original Kalman Price Filter:
That core smoother is used here to estimate the “true” price path, then blended with ATR to control step size and react proportionally to market noise.
What it plots
Kalman ATR Line the main baseline that turns up/down with the filtered trend.
Optional Moving Average of the Kalman ATR a secondary line for confluence (SMA/Hull/EMA/WMA/DEMA/RMA/LINREG/ALMA).
Candle Coloring (optional) paint bars by the baseline’s current direction.
Why combine Kalman + ATR?
Kalman reduces measurement noise and produces a stable path without the lag of heavy MAs.
ATR rails scale the baseline’s step to current volatility, so it’s calm in chop and more responsive in expansion.
The result is a single, intelligible line you can trade around: slope-up = constructive; slope-down = caution.
How it works (plain English)
Each bar, the Kalman filter updates an internal state (tunable via Process Noise , Measurement Noise , and Filter Order ) to estimate the underlying price.
An ATR band (Period × Factor) defines the allowed per-bar adjustment. The baseline cannot “jump” beyond those rails in one step.
A direction flip is detected when the baseline’s slope changes sign (upturn/downturn), and alerts are provided for both.
Typical uses
Trend confirmation Trade in the baseline’s direction; avoid fading a firmly rising/falling line.
Pullback timing Look for entries when price mean-reverts toward a rising baseline (or exits on tags of a falling one).
Trailing risk Use the baseline as a dynamic guide; many traders set stops a small buffer beyond it (e.g., a fraction of ATR).
Confluence Enable the MA overlay of the Kalman ATR; alignment (baseline above its MA and rising) supports continuation.
Inputs & what they do
Calculation
Kalman Price Source which price the filter tracks (Close by default).
Process Noise how quickly the filter can adapt. Higher = more responsive (but choppier).
Measurement Noise how much you distrust raw price. Higher = smoother (but slower to turn).
Filter Order (N) depth of the internal state array. Higher = slightly steadier behavior.
Kalman ATR
Period ATR lookback. Shorter = snappier; longer = steadier.
Factor scales the allowed step per bar. Larger factors permit faster drift; smaller factors clamp movement.
Confluence (optional)
MA Type & Period compute an MA on the Kalman ATR line , not on price.
Sigma (ALMA) if ALMA is selected, this input controls the curve’s shape. (Ignored for other MA types.)
Visuals
Plot Kalman ATR toggle the main line.
Paint Candles color bars by up/down slope.
Colors choose long/short hues.
Signals & alerts
Trend Up baseline turns upward (slope crosses above 0).
Alert: “Kalman ATR Trend Up”
Trend Down baseline turns downward (slope crosses below 0).
Alert: “Kalman ATR Trend Down”
These are state flips , not “price crossovers,” so you avoid many one-bar head-fakes.
How to start (fast presets)
Swing (daily/4H) ATR Period 7–14, Factor 0.5–0.8, Process Noise 0.02–0.05, Measurement Noise 2–4, N = 3–5.
Intraday (5–15m) ATR Period 5–7, Factor 0.6–1.0, Process Noise 0.05–0.10, Measurement Noise 2–3, N = 3–5.
Slow assets / FX raise Measurement Noise or ATR Period for calmer lines; drop Factor if the baseline feels too jumpy.
Reading the line
Rising & curving upward momentum building; consider long bias until a clear downturn.
Flat & choppy regime uncertainty; many traders stand aside or tighten risk.
Falling & accelerating distribution lower; short bias until a clean upturn.
Practical playbook
Continuation entries After a Trend Up alert, wait for a minor pullback toward the baseline; enter on evidence the line keeps rising.
Exit/reduce If long and the baseline flattens then turns down, trim or exit; reverse logic for shorts.
Filters Add a higher-timeframe check (e.g., only take longs when the daily Kalman ATR is rising).
Stops Place stops just beyond the baseline (e.g., baseline − x% ATR for longs) to avoid “tag & reverse” noise.
Notes
This is a guide to state and momentum, not a guarantee. Combine with your process (structure, volume, time-of-day) for decisions.
Settings are asset/timeframe dependent; start with the presets and nudge Process/Measurement Noise until the baseline “feels right” for your market.
Summary
Kalman ATR takes the noise-reduction of a Kalman price estimate and couples it with volatility-scaled movement to produce a clean, adaptive baseline. If you liked the original Kalman Price Filter (), this is its trend-trading cousin purpose-built for cleaner state flips, intuitive trailing, and confluence with your existing

Bias + VWAP Pullback — v4 (PA + BOS/CHOCH)Simple idea: I identify the trend (bias) from the larger timeframe, and only trade pullbacks to the VWAP/EMA during liquidity (London/New York). When the trend is clear, gold moves strongly, and its pullbacks to the balance lines provide clear opportunities.
Timeframe and Sessions (Cairo Time)
Analysis: H1 to determine the trend.
Implementation: 5m (or 1m if professional).
Trading window:
London Opening: 10:00–12:30
New York Opening: 16:30–19:00
(avoid the rest of the day unless there is exceptional traffic).
Direction determination (BIAS)
On H1:
If the price is above the 200 EMA and the daily VWAP is bullish and the price is above it → uptrend (long-only).
If the price is below the 200 EMA and the daily VWAP is bearish and the price is below it → bearish trend (short-only).
Determine your levels: yesterday's high/low (PDH/PDL) + approximate Asia range (03:00–09:30).
Entry Rules (Setup A: Trend Continuation)
Asia range breakout towards Bias during liquidity window.
Wait for a withdrawal to:
Daily VWAP, or
EMA50 on 5m frame (best if both cross).
Confirmation: Confirmation low/high on 5m (HL buy/LH sell) + clear impulse candle (Body is greater than average of last 10 candles).
Entry:
Buy: When the price returns above VWAP/EMA50 with a confirmation candle close.
Sell: The exact opposite.
Stop Loss (SL): Below/above the last confirmation low/high or ATR(14, 5m) x 1.5 (largest).
Objectives:
TP1 = 1R (Close 50% and move the rest Break-even).
TP2 = 2.5R to 3R or at an important HTF level (PDH/PDL/Bid/Demand Zone).
Entry Rules (Setup B: Reversion to VWAP – “Mean Reversion”)
Use with extreme caution, once daily maximum:
Price deviation from VWAP by more than ~1.5 x ATR(14, 5m) with rejection candles appearing near PDH/PDL.
Reverse entry towards the return of VWAP.
SL small behind rejection top/bottom.
Main target: VWAP. (Don't get greedy — this scenario is for extended periods only.)
News Filtering and Risk Management
Avoid trading 15–30 minutes before/after strong US news (CPI, NFP, FOMC).
Maximum daily loss: 1.5–2% of account balance.
Risk per trade: 0.25–0.5% (if you are learning) or 0.5–1% (if you are experienced).
Do not exceed two consecutive losing trades per day.
Don't chase the market after the opportunity has passed — wait for the next pullback.
Smart Deal Management
After TP1: Move stop to entry point + trail the rest with EMA20 on 5m or ATR Trailing = ATR(14)×1.0.
If the price touches a strong daily level (PDH/PDL) and fails to break, consider taking additional profit.
If VWAP starts to flatten and breaks against the trend on H1, stop trading for the day.
Quick Checklist (Before Entry)
H1 trend is clear and consistent with 200EMA + VWAP.
Penetrating the Asia range towards Bias.
Clean pull to VWAP/EMA50 on 5m.
Confirmation candle and real push.
SL is logical (behind swing/ATR×1.5) and R :R ≥ 1:2.
No red news coming soon.
Example of "ready-made" settings
EMA: 20, 50, 200 on 5m, 200 only on H1.
VWAP: Daily (reset daily).
ATR: 14 on 5m.
Levels: PDH/PDL + Asia Band (03:00–09:30 Cairo).
Gold Notes
Gold is fast and sharp at the open; don't get in early — wait for the draw.
Fakeouts are common before news: it is best to call with the trend after the price returns above/below VWAP.
Don't expect 80% consistent wins every day — the advantage comes from discipline, filtering out bad days, and only withdrawing when you're on the right track.
تعتبر شركة الماسة الألمانية أحد المؤسسات العاملة بالمملكة العربية السعودية ولها تاريخ طويل من الخدمات الكثيرة والمتنوعة التى مازالت تقدمها للكثير من العملاء داخل جميع مدن وأحياء المملكة حيث نقدم أفضل ما لدينا من خلال مجموعة الشركات التالية والتي من خلالها ستتلقي كل ما تحتاج إلية في كل المجال المختلفة فنحن نعمل منذ عام 2015 ولنا سابقات اعمال فى مختلف المجالات الحيوية التى نخدم من خلالها عملائنا ونوفر لهم أرخص الأسعار وبأعلى جودة من الممكن توفرها فى المجالات التالية :-
خدمات تنظيف المنازل والفلل والشقق
خدمات عزل الخزانات تنظيف غسيل صيانة اصلاح
خدمات جلي البلاط والرخام والسيراميك
خدمات نقل العفش عمالة فلبينية مدربة
خدمات مكافحة الحشرات بجدة
كل هذة الخدمات وأكثر نوفرها لكل المتعاقدين بأفضل الطرق مع توفير خطط وبرامج متنوعة لأتمام العمل المسنود إلينا بأفضل وأحدث الطرق الحديثة والعصرية سواء فى شركات النظافة بجدة ومكة المكرمة أو شركات نقل العفش بجدة عمالة فلبينية وباقى الخدمات مثل جلي وتلميع الرخام بمكة وجدة ولا ننسي شركة مكافحة حشرات بجدة التى ساعدت آلاف المواطنين على تنظيف منازلهم من الحشرات بأفضل مبيدات حشرية.

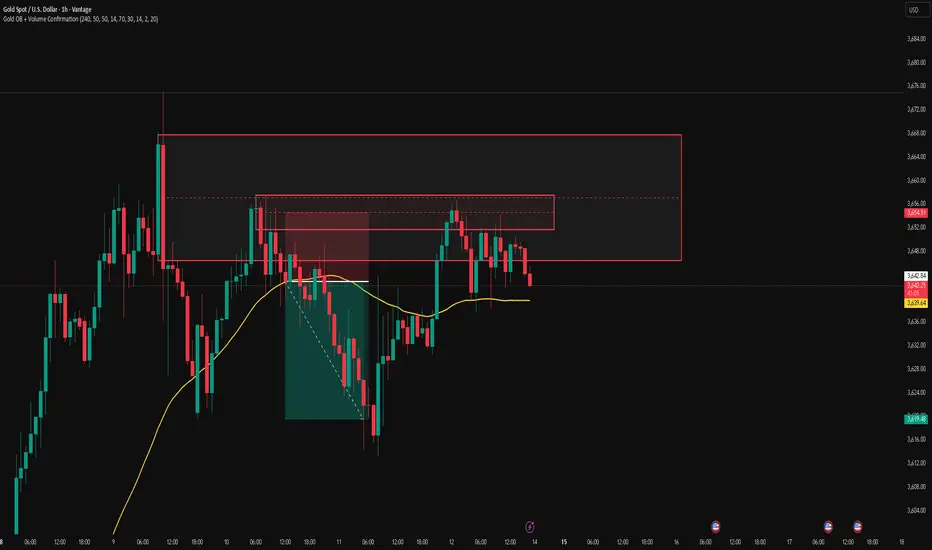
Ease of Movement 2.0Ease of movement EoM is how easy it is for the price to move and stay where it moved to.
This indicator is the square of the True Range (i.e. distance of price travelled between the current close and the close of the previous bar, squared) relative to the volume of the current bar. -2, -1, +1, and +2 standard deviations, and the average are all based on n=14.
E.g., if an EoM up occurs after failed attempts to mark prices down, it suggests continuation of prices to the upside.

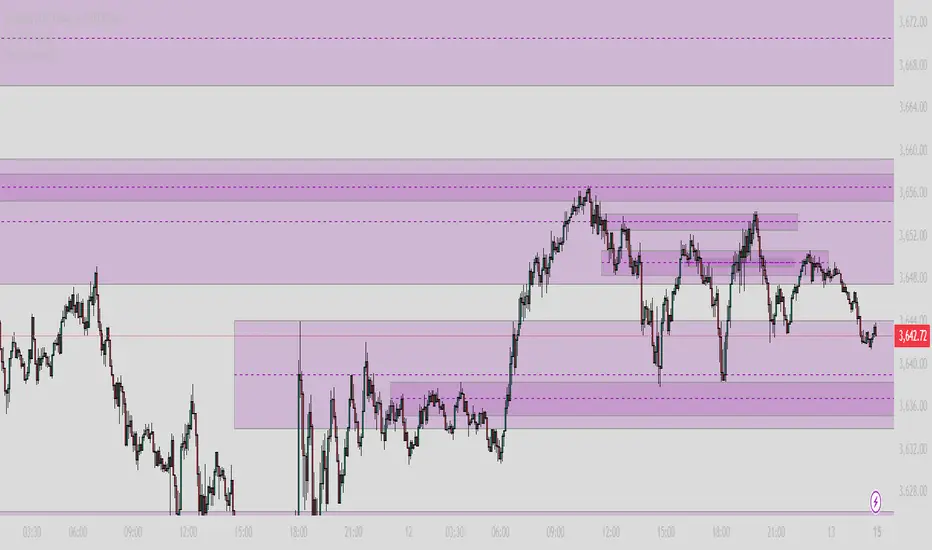
Liquidity Void Detector (Zeiierman)█ Overview
Liquidity Void Detector (Zeiierman) is an oscillator highlighting inefficient price displacements under low participation. It measures the most recent price move (standardized return) and amplifies it only when volume is below its own trend.
Positive readings ⇒ strong up-move on low volume → potential Buy-Side Imbalance (void below) that often refills.
Negative readings ⇒ strong down-move on low volume → potential Sell-Side Imbalance (void above) that often refills.
This tool provides a quantitative “void” proxy: when price travels far with unusually thin volume, the move is flagged as likely inefficient and prone to mean-reversion/mitigation.
█ How It Works
⚪ Volume Shock (Participation Filter)
Each bar, volume is compared to a rolling baseline. This is then z-scored.
// Volume Shock calculation
volTrend = ta.sma(volume, L)
vs = (volume > 0 and volTrend > 0) ? math.log(volume) - math.log(volTrend) : na
vsZ = zScore(vs, vzLen) // z-scored volume shock
lowVS = (vsZ <= vzThr) // low-volume condition
Bars with VolShock Z ≤ threshold are treated as low-volume (thin).
⚪ Prior Return Extremeness
The 1-bar log return is computed and z-scored.
// Prior return extremeness
r1 = math.log(close / close )
retZ = zScore(r1, rLen) // z-scored prior return
This shows whether the latest move is unusually large relative to recent history.
⚪ Void Oscillator
The oscillator is:
// Oscillator construction
weight = lowVS ? 1.0 : fadeNoLow
osc = retZ * weight
where Weight = 1 when volume is low, otherwise fades toward a user-set factor (0–1).
Osc > 0: up-move emphasized under low volume ⇒ Buy-Side Imbalance.
Osc < 0: down-move emphasized under low volume ⇒ Sell-Side Imbalance.
█ Why Use It
⚪ Targets Inefficient Moves
By filtering for low participation, the oscillator focuses on moves most likely driven by thin books/noise trading, which are statistically more likely to retrace.
⚪ Simple, Robust Logic
No need for tick data or order-book depth. It derives a practical void proxy from OHLCV, making it portable across assets and timeframes.
⚪ Complements Price-Action Tools
Use alongside FVG/imbalance zones, key levels, and volume profile to prioritize voids that carry the highest reversal probability.
█ How to Use
Sell-Side Imbalance = aggressive sell move (price goes down on low volume) → expect price to move up to fill it.
Buy-Side Imbalance = aggressive buy move (price goes up on low volume) → expect price to move down to fill it.
█ Settings
Volume Baseline Length — Bars for the volume trend used in VolShock. Larger = smoother baseline, fewer low-volume flags.
Vol Shock Z-Score Lookback — Bars to standardize VolShock; larger = smoother, fewer extremes.
Low-Volume Threshold (VolShock Z ≤) — Defines “thin participation.” Typical: −0.5 to −1.0.
Return Z-Score Lookback — Bars to standardize the 1-bar log return; larger = smoother “extremeness” measure.
Fade When Volume Not Low (0–1) — Weight applied when volume is not low. 0.00 = ignore non-low-volume bars entirely. 1.00 = treat volume condition as irrelevant (pure return extremeness).
Upper Threshold (Osc ≥) — Trigger for Sell-Side Imbalance (void below).
Lower Threshold (Osc ≤) — Trigger for Buy-Side Imbalance (void above).
-----------------
Disclaimer
The content provided in my scripts, indicators, ideas, algorithms, and systems is for educational and informational purposes only. It does not constitute financial advice, investment recommendations, or a solicitation to buy or sell any financial instruments. I will not accept liability for any loss or damage, including without limitation any loss of profit, which may arise directly or indirectly from the use of or reliance on such information.
All investments involve risk, and the past performance of a security, industry, sector, market, financial product, trading strategy, backtest, or individual's trading does not guarantee future results or returns. Investors are fully responsible for any investment decisions they make. Such decisions should be based solely on an evaluation of their financial circumstances, investment objectives, risk tolerance, and liquidity needs.

ICT Largest Midnight–00:30 FVG (NY, 1 per day) — FIXEDmarks out the first and largest fvg on the 1 min chart from midnight open until 12:30 am est

Risk controlRisk control.
The indicator displays lines at a distance of % from the current price specified in the parameters. This risk is taken as 100% of the volume. Additionally, the max/min of the visible part of the chart is determined. The distance from the current price to the min/max is calculated in % and the ratio of the risk specified in the parameters to the risk to the min/max is displayed in 10% increments. The indicator is calculated based on the visible part of the chart on the screen. The direction of visualization depends on the visible part of the chart: if the opening price of the first candle is > the current price, visualization is from the minimum, otherwise from the maximum.
Required parameters: risk in %.
Visualization: line offset to the left/right, line color and thickness. Additional: table of 3 cells (background, font size and color).

CVD ema filtered 3.0This indicator is based on CVD Cumulative Volume Delta.
In this version the lines stop after a certain number of touches.
You can also choose the color for the bullish and bearish lines.

CyberFX EMA21 Strategy (Pine v5)This is a simple indicator that can be used for a simple strategy. It follows the logic of the price always move back to the media, in that case an EMA(21). This give us an opportunity to achieve a better R/R. One important thing here is this indicator works better on trend markets. When the market is in consolidation mode it will show many signals so we need to pay attention and be patient. This indicator works better in 4H timeframes but it can used with other TFs.
The idea behind is:
for a bullish move when the price moves back to the EMA(21) we check the distance between the low value and the EMA(21) value. The best is when the price low crosses the EMA(21) from above. I am considering a 8 pips distance from the price low to the ema as a signal. Then I will wait for the new candle to move above the EMA(21) for a long entry. I also consider at least 50 pips for SL.
for a bearish move the idea is the same but we consider the price high crossing the EMA(21) and the new candle moving below the EMA.
I hope this can be useful and please leave your comment nad critics(but only the constructive one).
Have a safe trade

Thần Tiên / Hạ Phàm (MTF)🔔 Thần Tiên / Hạ Phàm (MTF) Indicator – modified & optimized for real trading practice.
✅ For educational and reference purposes only – not financial advice.
📩 To get the optimized settings & detailed trading strategy, contact me on Telegram: @NDucnhan79


CTS-StochasticThis Pine Script code defines a custom technical indicator for the TradingView platform called "CTS-Stochastic Complete". It calculates and displays a standard stochastic oscillator and generates trading signals based on unconventional crossover logic.
Here is a breakdown of its functionality:
Core Functionality
The script calculates the Stochastic Oscillator, a momentum indicator that compares a particular closing price of an asset to a range of its prices over a certain period of time. It consists of two lines:
%K Line: The main stochastic line, calculated and then smoothed.
%D Line: A moving average of the %K line, acting as a signal line.
These two lines oscillate between 0 and 100.
Key Sections of the Code:
Indicator Declaration:
indicator("CTS-Stochastic Complete", ... overlay=false): This line declares the script as an indicator that will be displayed in a separate panel below the main price chart.
User Inputs:
You can customize the indicator's parameters from the settings menu:
Stochastic Length: The lookback period for the stochastic calculation (default is 14).
%K Smoothing: The period for smoothing the raw stochastic to create the %K line (default is 3).
%D Smoothing: The period for the moving average of the %K line to create the %D line (default is 3).
Upper Band: The threshold for the overbought level (default is 65).
Lower Band: The threshold for the oversold level (default is 35).
Plotting:
It plots the %K line in blue and the %D line in orange.
It draws two horizontal lines: a red "Upper Band" for the overbought level and a green "Lower Band" for the oversold level.
Signal Logic and Visualization:
Buy Signal: A green triangle pointing up appears at the top of the indicator window when the blue %K line crosses above the red overBought line.
Sell Signal: A red triangle pointing down appears at the bottom of the indicator window when the blue %K line crosses below the green underSold line.
Note: The signal logic is unconventional. Typically, a buy signal is generated when the stochastic crosses up from the oversold area, and a sell signal occurs when it crosses down from the overbought area. This script's logic is reversed from the traditional interpretation.
Alerts:
The script includes alertcondition functions that allow you to create server-side alerts in TradingView. You can set up notifications for when a "Buy Signal" or "Sell Signal" occurs based on the logic described above.
