BB 100 with Barcolors6/19/15 I added confirmation highlight bars to the code. In other words, if a candle bounced off the lower Bollinger band, it needed one more close above the previous candle to confirm a higher probability that a change in investor sentiment has reversed. Same is true for upper Bollinger band bounces. I also added confirmation highlight bars to the 100 sma (the basis). The idea is that lower and upper bands are potential points of support and resistance. The same is true of the basis if a trend is to continue. 6/28/15 I added a plotshape to identify closes above/below TLine. One thing this system points out is it operates best in a trend reversal. Consolidations will whipsaw the indicator too much. I have found that when this happens, if using daily candles, switch to hourly, 30 min, etc., to catch a better signal. Nothing moves in a straight line. As with any indicator, it is a tool to be used in conjunction with the art AND science of trading. As always, try the indicator for a time so that you are comfortable enough to use real money. This is designed to be used with "BB 25 with Barcolors".
Cari dalam skrip untuk "美国要强买强卖,要求中国购买指定商品,四年还必须买够15万亿?"

BB 25 with Barcolors6/19/15 I added confirmation highlight bars to the code. In other words, if a candle bounced off the lower Bollinger band, it needed one more close above the previous candle to confirm a higher probability that a change in investor sentiment has reversed. Same is true for upper Bollinger band bounces. I also added confirmation highlight bars to the 100 sma (the basis). The idea is that lower and upper bands are potential points of support and resistance. The same is true of the basis if a trend is to continue. 6/28/15 I added a plotshape to identify closes above/below TLine. One thing this system points out is it operates best in a trend reversal. Consolidations will whipsaw the indicator too much. I have found that when this happens, if using daily candles, switch to hourly, 30 min, etc., to catch a better signal. Nothing moves in a straight line. As with any indicator, it is a tool to be used in conjunction with the art AND science of trading. As always, try the indicator for a time so that you are comfortable enough to use real money. This is designed to be used with "BB 100 with Barcolors".

KK_Intraday MAsHey guys,
today I was browsing through intraday Charts looking at some moving averages. Basically what I wanted to see was whether the currency pair was trading below or above the moving average of the day/week/month. For a better understanding: The daily MA on a 15 minute Forex Chart would be the 96 MA.
I encountered the problem that i always had to change the settings for my MAs when changing the Time Interval, so I coded this here up. It is pretty simple but maybe somebody else has the same problem and can put it to use.
The script has some settings as listed below:
Choice which MAs to plot, (Daily, Weekly, Monthly)
Choice which type of MA to use (Simple, Exponential, Weighted)
Neccesary Settings for the correct calculation (e.g. Number of trading hours per day). These settings depend on the instrument you are using and should always be checked before using this script.
There are a few things to Note when using this script:
This script works for intraday charts only.
The monthly MA doesn't work on any Time Interval smaller than 15 minutes. Can't do anything about it unfortunately.
This is my first published Script, use it with caution and let me know what you think about it!

Opening Range Breakout with 2 Profit Targets.Opening Range Breakout with 2 Profit Targets.
Updated Indicator now works on all Symbols with Many Different Session Options.
***Known PineScript Issue…While the Opening Range is being Formed the lines only adjust for that individual bar. Just reset Indicator after Opening Range Completes.
***All Times are Based on New York Time
Session Options Forex U.S. Banks Open (8:00), Gold U.S. Open (8:20), Oil U.S. Open (9:00), U.S. Cash Session - Stocks (9:30), NY Forex Open (17:00) , Europe Open (02:00), or if you choose Setting 0 the Session Runs from 00:00 to 00:00 (Midnight to Midnight).
***Ability to use 60 minute Opening Range, 30 minute, 15 minute, and many other options.
***However you can manually change the times in the Inputs Tab to adjust for any session you prefer. This is useful for Day Light Savings Adjustments. Also the default times work if your charts are set to EST Time. If you use A different time zone in your settings you need to Adjust the times in the inputs tab.
Initially Opening Range High and Low plot as Yellow Lines. If Price Goes Above Opening Range then Line Turns Green. If Price Goes Below Opening Range Line Turns Red.
By default the First Profit Target is 1/2 the Width of the Opening Range and the 2nd Profit Target is 1 Times the Opening Range. However these are Adjustable in the Inputs Tab.
By Default the Opening Range Length is 1 Hour. However, you can Change the Opening Range Length to 15 min, 30 min, 2 hours etc. in the Inputs Tab.
Plots a 1 Above or Below Candle when 1st Profit Target is Achieved, and a 2 when 2nd Profit Target is Achieved.

Indicator: Trend Trigger FactorIntroduced by M.H.Pee, Trend Trigger Factor is designed to keep the trader trading with the trend.
System rules according to the developer:
* If the 15-day TTF is above 100 (indicating an uptrend), you will want to be in long positions.
* If the 15-day TTF is below -100, you will want to be short.
* If it is between -100 and 100, you should remain with the current position.
More info:
Original Article by Mr.Pee: drive.google.com

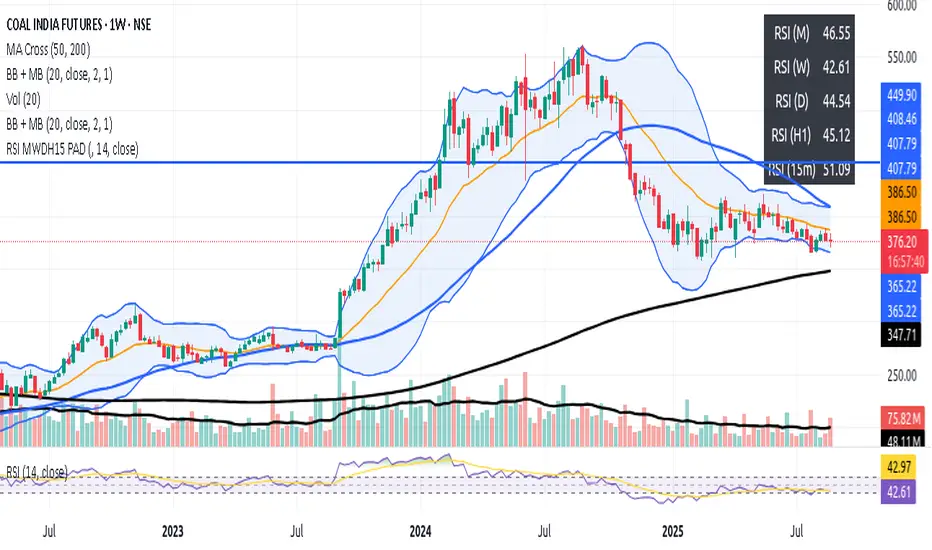
PINAKI__RSI M/W/D/H/15 (Top Right, Padding)display monthly, weekly, daily, 1Hr, 15Min RSI in single frame
BE-Volume Footprint & Pressure Candles█ Overview:
BE-Volume Footprint & Pressure Candles, is an indicator which is preliminarily designed to analyze the supply and demand patterns based on Rally Base Rally (RBR), Drop Base Drop (DBD), Drop Base Rally (DBR) & Rally Base Drop (RBD) concepts in conjunction to volume pressure. Understanding these concepts are crucial. Let's break down why the "Base" is you Best friend in this context.
Commonness in RBR, DBD, DBR, RBD patterns ?
There is an impulse price movement at first, be it rally (price moving up) or the Drop (price moving down), followed by a period of consolidation which is referred as "BASE" and later with another impulse move of price (Rally or Drop).
Why is the Base Important
1. Market Balance: Base represents a balance between buyers and sellers. This is where decisions are made.
2. Confirmation: It confirms the strength of previous impulse move which has happened.
Base & the Liquidity Play:
Supply & Demand Zone predict the presence of all large orders within the limits of the Base Zone. Price is expected to return to the zone to fill the unfilled orders placed by large players.
For the price to move in the intended direction Liquidity plays the major role. hence indicator aims to help traders in identifying those zones where liquidity exists and the volume pressure helps in confirming that liquidity is making its play.
Bottom pane in the below snapshots is a visual representation of Buyers volume pressure (Green Line & the Green filled area) making the price move upwards vs Sellers volume pressure (Red Line & the Red filled area) making the price move downwards.
Top pane in the below snapshots is a visual representation on the pattern identification (Blue marked zone & the Blue line referred as Liquidity level)
Bullish Pressure On Buy Liquidity:
Bearish Pressure On Sell Liquidity:
█ How It Works:
1. Indicator computes technical & mathematical operations such as ATR, delta of Highs & Lows of the candle and Candle ranges to identify the patterns and marks the liquidity lines accordingly.
2. Indicator then waits for price to return to the liquidity levels and checks if Directional volume pressure to flow-in while the prices hover near the Liquidity zones.
3. Once the Volume pressure is evident, loop in to the ride.
█ When It wont Work:
When there no sufficient Liquidity or sustained Opposite volume pressure, trades are expected to fail.
█ Limitations:
Works only on the scripts which has volume info. Relays on LTF candles to determine intra-bar volumes. Hence, Use on TF greater than 1 min and lesser than 15 min.
█ Indicator Features:
1. StrictEntries: employs' tighter rules (rather most significant setups) on the directional volume pressure applied for the price to move. If unchecked, liberal rules applied on the directional volume pressure leading to more setups being identified.
2. Setup Confirmation period: Indicates Waiting period to analyze the directional volume pressure. Early (lesser wait period) is Risky and Late (longer wait period) is too late for the
ride. Find the quant based on the accuracy of the setup provided in the bottom right table.
3. Algo Enabled with Place Holders:
Indicator is equipped with algo alerts, supported with necessary placeholders to trade any instrument like stock, options etc.
Accepted PlaceHolders (Case Sensitive!!)
1. {{ticker}}-->InstrumentName
2. {{datetime}}-->Date & Time Of Order Placement
3. {{close}}-->LTP Price of Script
4. {{TD}}-->Current Level:
Note: Negative Numbers for Short Setup
5. {{EN}} {{SL}} {{TGT}} {{T1}} {{T2}} --> Trade Levels
6. {{Qty}} {{Qty*x}} --> Qty -> Trade Qty mapped in Settings. Replace x with actual number of your choice for the multiplier
7. {{BS}}-->Based on the Direction of Trade Output shall be with B or S (B == Long Trade & S == Short Trade)
8. {{BUYSELL}}-->Based on the Direction of Trade Output shall be with BUY or SELL (BUY == Long Trade & SELL == Short Trade)
9. {{IBUYSELL}}-->Based on the Direction of Trade Output shall be with BUY or SELL (BUY == SHORT Trade & SELL == LONG Trade)
Dynamic Alerts:
10. { {100R0} }-->Dynamic Place Holder 100 Refers to Strike Difference and Zero refers to ATM
11. { {100R-1} }-->Dynamic Place Holder 100 Refers to Strike Difference and -1 refers to
ATM - 100 strike
12. { {50R2} }-->Dynamic Place Holder 50 Refers to Strike Difference and 2 refers to
ATM + (2 * 50 = 100) strike
13. { {"ddMMyy", 0} }-->Dynamically Picks today date in the specified format.
14. { {"ddMMyy", n} }-->replace n with actual number of your choice to Pick date post today date in the specified format.
15. { {"ddMMyy", "MON"} }-->dynamically pick Monday date (coming Monday, if today is not Monday)
Note. for the 2nd Param-->you can choose to specify either Number OR any letter from =>
16. {{CEPE}} {{ICEPE}} {{CP}} {{ICP}} -> Dynamic Option Side CE or C refers to Calls and PE or P refers to Puts. If "I" is used in PlaceHolder text, On long entries PUTs shall be used
Indicator is equipped with customizable Trade & Risk management settings like multiple Take profit levels, Trailing SL.

Globex Trap w/ percentage [SLICKRICK]Globex Trap w/ Percentage
Overview
The Globex Trap w/ Percentage indicator is a powerful tool designed to help traders identify high-probability trading opportunities by analyzing price action during the Globex (overnight) session and regular trading hours. By combining Globex session ranges with Supply & Demand zones, this indicator highlights potential "trap" areas where significant price reactions may occur. Additionally, it calculates the Globex session range as a percentage of the daily Average True Range (ATR), providing valuable context for assessing market volatility.
This indicator is ideal for traders in futures markets or other instruments traded during Globex sessions, offering a visual and analytical edge for spotting key price levels and potential reversals or breakouts.
Key Features
Globex Session Tracking:
Visualizes the high and low of the Globex session (default: 3:00 PM to 6:30 AM PST) with customizable time settings.
Displays a semi-transparent box to mark the Globex range, with labels for "Globex High" and "Globex Low."
Calculates the Globex range as a percentage of the daily ATR, displayed as a label for quick reference.
Supply & Demand Zones:
Identifies Supply & Demand zones during regular trading hours (default: 6:00 AM to 8:00 AM PST) with customizable time settings.
Draws semi-transparent boxes to highlight these zones, aiding in the identification of key support and resistance areas.
Trap Area Identification:
Highlights potential trap zones where Globex ranges and Supply & Demand zones overlap, indicating areas where price may reverse or consolidate due to trapped traders.
Customizable Settings:
Adjust Globex and Supply & Demand session times to suit your trading preferences.
Toggle visibility of Globex and Supply & Demand zones independently.
Customize box colors for better chart readability.
Set the lookback period (default: 10 days) to control how many historical zones are displayed.
Configure the ATR length (default: 14) for the percentage calculation.
PST Timezone Default:
All times are based on Pacific Standard Time (PST) by default, ensuring accurate session tracking for users in this timezone or those aligning with U.S. West Coast market hours.
Recommended Usage
Timeframes: Best used on 1-hour charts or lower (e.g., 15-minute, 5-minute) for precise entry and exit points.
Markets: Optimized for futures (e.g., ES, NQ, CL) and other instruments traded during Globex sessions.
Historical Data: Ensure at least 10 days of historical data for optimal visualization of zones.
Strategy Integration: Use the indicator to identify potential reversals or breakouts at Globex highs/lows or Supply & Demand zones. The ATR percentage provides context for whether the Globex range is significant relative to typical daily volatility.
How It Works
Globex Session:
Tracks the high and low prices during the user-defined Globex session (default: 3:00 PM to 6:30 AM PST).
When the session ends, a box is drawn from the start to the end of the session, capturing the high and low prices.
Labels are placed at the midpoint of the session, showing "Globex High," "Globex Low," and the range as a percentage of the daily ATR (e.g., "75.23% of Daily ATR").
Supply & Demand Zones:
Tracks the high and low prices during the user-defined regular trading hours (default: 6:00 AM to 8:00 AM PST).
Draws a box to mark these zones, which often act as key support or resistance levels.
ATR Percentage:
Calculates the Globex range (high minus low) and divides it by the daily ATR to express it as a percentage.
This metric helps traders gauge whether the overnight price movement is significant compared to the instrument’s typical volatility.
Time Handling:
Uses PST (UTC-8) for all time calculations, ensuring accurate session timing for users aligning with this timezone.
Properly handles overnight sessions that cross midnight, ensuring seamless tracking.
Input Settings
Globex Session Settings:
Show Globex Session: Enable/disable Globex session visualization (default: true).
Globex Start/End Time: Set the start and end times for the Globex session (default: 3:00 PM to 6:30 AM PST).
Globex Box Color: Customize the color of the Globex session box (default: semi-transparent gray).
Supply & Demand Zone Settings:
Show Supply & Demand Zone: Enable/disable zone visualization (default: true).
Zone Start/End Time: Set the start and end times for Supply & Demand zones (default: 6:00 AM to 8:00 AM PST).
Zone Box Color: Customize the color of the zone box (default: semi-transparent aqua).
General Settings:
Days to Look Back: Number of historical days to display zones (default: 10).
ATR Length: Period for calculating the daily ATR (default: 14).
Notes
All times are in Pacific Standard Time (PST). Adjust the start and end times if your market operates in a different timezone or if you prefer different session windows.
The indicator is optimized for instruments with active Globex sessions, such as futures. Results may vary for non-24/5 markets.
A typo in the label "Globe Low" (should be "Globex Low") will be corrected in future updates.
Ensure your TradingView chart is set to display sufficient historical data to view the full lookback period.
Why Use This Indicator?
The Globex Trap w/ Percentage indicator provides a unique combination of session-based range analysis, Supply & Demand zone identification, and volatility context via the ATR percentage. Whether you’re a day trader, swing trader, or scalper, this tool helps you:
Pinpoint key price levels where institutional traders may act.
Assess the significance of overnight price movements relative to daily volatility.
Identify potential trap zones for high-probability setups.
Customize the indicator to fit your trading style and market preferences.

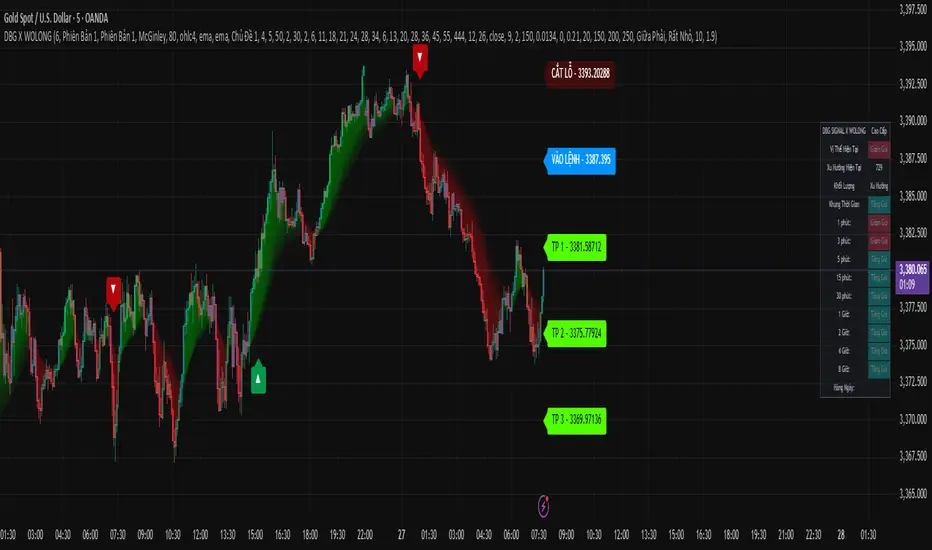
DBG X WOLONG📊 USER GUIDE – DBG X WOLONG ALGORITHM
🎯 OVERVIEW
The DBG X WOLONG Future Algorithm is a Pine Script v5 that integrates multiple advanced technical indicators, enabling traders to analyze markets and make precise trading decisions.
⚙️ MAIN SETTINGS
🔹 Sensitivity
Value: 1–20 (Default: 6)
Function: Adjusts the sensitivity of the SuperTrend signal
Guidelines:
Low value (1–5): Fewer signals, higher accuracy
High value (15–20): More signals, but with possible noise
🎨 DISPLAY SETTINGS
🔹 Candle Colors
Version 1: Based on MACD histogram
Version 2: Based on SuperTrend
🔹 Color Themes
Theme 1: Traditional Green/Red
Theme 2: Gold/Purple
Theme 3: Blue/Orange
No Fill: No background color displayed
📊 TRADING SIGNALS
🔹 Buy/Sell Signals
BUY 🚀 appears when:
SuperTrend shifts from bearish to bullish
Closing price > SMA 13
Braid Filter confirms
SELL appears when:
SuperTrend shifts from bullish to bearish
Closing price < SMA 13
Braid Filter confirms
🔹 Reversal Signals
▲ (Up Arrow): Buy signal when RSI crosses above 30
▼ (Down Arrow): Sell signal when RSI crosses below 70
🔹 Pullback Signals
▲ Purple: Pullback in bullish trend
▼ Purple: Pullback in bearish trend
🎯 TAKE PROFIT & STOP LOSS
🔹 TP Modes
Version 1: TP based on pivot points
Version 2: TP based on regression line
Close Price: TP at candle close
🔹 TP/SL Settings
TP Ratio: 2.0 (Default)
TP Length: 150 (Default)
ATR SL Length: 10
ATR SL Risk: 1.9
🔹 Labels Displayed
ENTRY: Entry point
STOP LOSS: Stop loss point
TP 1/2/3: 3 take profit levels
☁️ MOVING AVERAGE CLOUD
🔹 Supported MA Types
SMA – Simple Moving Average
EMA – Exponential Moving Average
WMA – Weighted Moving Average
HMA – Hull Moving Average
ALMA – Arnaud Legoux Moving Average
McGinley – McGinley Dynamic
FRAMA – Fractal Adaptive Moving Average
🔹 Cloud Cycles
Default: 2, 6, 11, 18, 21, 24, 28, 34
Customizable: All 8 cycles
🔹 Ribbon Cycles
Default: 6, 13, 20, 28, 36, 45, 55, 444
Customizable: All 8 cycles
🔧 BRAID FILTER
🔹 Function
Filters out noise signals
Confirms strong trends
🔹 Settings
MA Filter: McGinley (Recommended)
Filter Strength: 80% (Default)
📈 TRENDS & INDICATORS
🔹 SuperTrend
Main trend indicator
Generates primary buy/sell signals
🔹 Advanced Ichimoku
Tenkan-Sen: Blue line
Kijun-Sen: Orange line
Senkou Span A/B: Ichimoku cloud
🔹 Trend Tracking
Based on EMA 10 vs EMA 20
Candle colors follow trend direction
🔹 Trend Catcher
Range Filter with multiple options
Adjustable sensitivity
📊 MULTI-TIMEFRAME TREND PANEL
🔹 Displayed Timeframes
1m, 3m, 5m
15m, 30m, 1H
2H, 4H, 8H, Daily
🔹 Displayed Info
Current Position: Bullish/Bearish
Trend: Per timeframe
Volume: Current trading volume
🔹 Panel Positioning
9 selectable positions
Sizes: Large, Normal, Small, Extra Small
🚀 TRADE EXECUTION
📈 LONG ENTRY
✅ Entry Conditions
BUY 🚀 signal appears
SuperTrend turns from red to green
Price > SMA 13
Braid Filter confirms (green)
Trend Panel shows "Bullish" across multiple TFs
📊 Additional Confirmations
MACD Histogram > 0 and rising
RSI crosses above 30 (if reversal signal)
EMA Pullback shows ▲ purple
🎯 Trade Management
Entry: According to ENTRY label
Stop Loss: According to STOP LOSS label
Take Profit: TP1 → TP2 → TP3
📉 SHORT ENTRY
✅ Entry Conditions
SELL signal appears
SuperTrend turns from green to red
Price < SMA 13
Braid Filter confirms (red)
Trend Panel shows "Bearish" across multiple TFs
📊 Additional Confirmations
MACD Histogram < 0 and declining
RSI crosses below 70 (if reversal signal)
EMA Pullback shows ▼ purple
🎯 Trade Management
Entry: According to ENTRY label
Stop Loss: According to STOP LOSS label
Take Profit: TP1 → TP2 → TP3
🎛️ RECOMMENDED SETTINGS
👥 For Beginners
Sensitivity: 6
Candle Colors: Version 1
Buy/Sell Signals: ON
Reversal Signals: OFF
Trend Panel: ON
🏆 For Experienced Traders
Sensitivity: 4–8 (depending on market)
Reversal Signals: ON
Pullback: ON
All indicators: ON
ATR SL Risk: 1.5–2.0
⚡ For Scalping
Sensitivity: 8–12
Timeframes: 1m, 3m, 5m
Use only: SuperTrend + Braid Filter
Quick TP: Only TP1
📊 For Swing Trading
Sensitivity: 4–6
Timeframes: 1H, 4H, 1D
Use all: Full signals
TP: All 3 levels (TP1, TP2, TP3)
⚠️ IMPORTANT NOTES
🔴 Avoid Trading When
Signals conflict across timeframes
Market is strongly ranging/sideways
Abnormally low volume
Price is at major support/resistance zones
🟢 Prefer Trading When
At least 2–3 confirmations align
Clear trend across multiple timeframes
Strong volume surge
Breakout from consolidation zone
💡 Usage Tips
Always wait for confirmation: Never enter with just 1 signal
Risk management: Place SL according to STOP LOSS label
Follow trend panel: Prioritize overall trend
Use multiple timeframes: Analyze top-down
Backtest first: Test strategy on historical data
🛠️ TROUBLESHOOTING
❓ No signals appear
Check if inputs are enabled
Adjust sensitivity
Try switching timeframe
❓ Too many false signals
Lower sensitivity
Increase Braid Filter strength
Trade only with main trend
❓ Trend panel not showing
Enable "Display Dashboard"
Select proper panel position
Adjust panel size
📞 SUPPORT
If you encounter issues using this script, please:
Carefully read this guide
Practice on a demo account
Backtest thoroughly before live trading
📈 Wishing you successful trading! 🚀
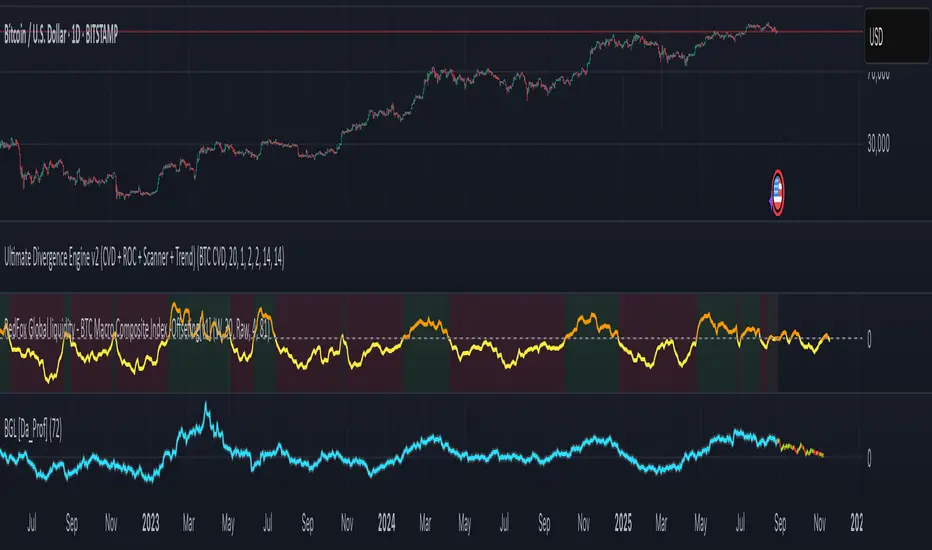
BTC Macro Composite Index -Offsettingthis is an indicator using Howell's Thesis of BTC moved by liquidity :
instead of using global M2, it composes :
Global Liquidity (41%) = USD-adjusted CB balance sheets (WALCL, EUCBBS, JPCBBS, CNCBBS)
Investor Risk Appetite (22%)=Copper/Gold ratio, inverted VIX (risk-on), HY vs IG OAS
Gold-related factors(15-20%)= XAUUSD + BTC/Gold ratio (Gold influence on Bitcoin)
All of it offset foward 90 days , and it does a better job on identifying where the btc price will be headed .....
Adaptive Rolling Quantile Bands [CHE] Adaptive Rolling Quantile Bands
Part 1 — Mathematics and Algorithmic Design
Purpose. The indicator estimates distribution‐aware price levels from a rolling window and turns them into dynamic “buy” and “sell” bands. It can work on raw price or on *residuals* around a baseline to better isolate deviations from trend. Optionally, the percentile parameter $q$ adapts to volatility via ATR so the bands widen in turbulent regimes and tighten in calm ones. A compact, latched state machine converts these statistical levels into high-quality discretionary signals.
Data pipeline.
1. Choose a source (default `close`; MTF optional via `request.security`).
2. Optionally compute a baseline (`SMA` or `EMA`) of length $L$.
3. Build the *working series*: raw price if residual mode is off; otherwise price minus baseline (if a baseline exists).
4. Maintain a FIFO buffer of the last $N$ values (window length). All quantiles are computed on this buffer.
5. Map the resulting levels back to price space if residual mode is on (i.e., add back the baseline).
6. Smooth levels with a short EMA for readability.
Rolling quantiles.
Given the buffer $X_{t-N+1..t}$ and a percentile $q\in $, the indicator sorts a copy of the buffer ascending and linearly interpolates between adjacent ranks to estimate:
* Buy band $\approx Q(q)$
* Sell band $\approx Q(1-q)$
* Median $Q(0.5)$, plus optional deciles $Q(0.10)$ and $Q(0.90)$
Quantiles are robust to outliers relative to means. The estimator uses only data up to the current bar’s value in the buffer; there is no look-ahead.
Residual transform (optional).
In residual mode, quantiles are computed on $X^{res}_t = \text{price}_t - \text{baseline}_t$. This centers the distribution and often yields more stationary tails. After computing $Q(\cdot)$ on residuals, levels are transformed back to price space by adding the baseline. If `Baseline = None`, residual mode simply falls back to raw price.
Volatility-adaptive percentile.
Let $\text{ATR}_{14}(t)$ be current ATR and $\overline{\text{ATR}}_{100}(t)$ its long SMA. Define a volatility ratio $r = \text{ATR}_{14}/\overline{\text{ATR}}_{100}$. The effective quantile is:
Smoothing.
Each level is optionally smoothed by an EMA of length $k$ for cleaner visuals. This smoothing does not change the underlying quantile logic; it only stabilizes plots and signals.
Latched state machines.
Two three-step processes convert levels into “latched” signals that only fire after confirmation and then reset:
* BUY latch:
(1) HLC3 crosses above the median →
(2) the median is rising →
(3) HLC3 prints above the upper (orange) band → BUY latched.
* SELL latch:
(1) HLC3 crosses below the median →
(2) the median is falling →
(3) HLC3 prints below the lower (teal) band → SELL latched.
Labels are drawn on the latch bar, with a FIFO cap to limit clutter. Alerts are available for both the simple band interactions and the latched events. Use “Once per bar close” to avoid intrabar churn.
MTF behavior and repainting.
MTF sourcing uses `lookahead_off`. Quantiles and baselines are computed from completed data only; however, any *intrabar* cross conditions naturally stabilize at close. As with all real-time indicators, values can update during a live bar; prefer bar-close alerts for reliability.
Complexity and parameters.
Each bar sorts a copy of the $N$-length window (practical $N$ values keep this inexpensive). Typical choices: $N=50$–$100$, $q_0=0.15$–$0.25$, $k=2$–$5$, baseline length $L=20$ (if used), adaptation strength $s=0.2$–$0.7$.
Part 2 — Practical Use for Discretionary/Active Traders
What the bands mean in practice.
The teal “buy” band marks the lower tail of the recent distribution; the orange “sell” band marks the upper tail. The median is your dynamic equilibrium. In residual mode, these tails are deviations around trend; in raw mode they are absolute price percentiles. When ATR adaptation is on, tails breathe with regime shifts.
Two core playbooks.
1. Mean-reversion around a stable median.
* Context: The median is flat or gently sloped; band width is relatively tight; instrument is ranging.
* Entry (long): Look for price to probe or close below the buy band and then reclaim it, especially after HLC3 recrosses the median and the median turns up.
* Stops: Place beyond the most recent swing low or $1.0–1.5\times$ ATR(14) below entry.
* Targets: First scale at the median; optional second scale near the opposite band. Trail with the median or an ATR stop.
* Symmetry: Mirror the rules for shorts near the sell band when the median is flat to down.
2. Continuation with latched confirmations.
* Context: A developing trend where you want fewer but cleaner signals.
* Entry (long): Take the latched BUY (3-step confirmation) on close, or on the next bar if you require bar-close validation.
* Invalidation: A close back below the median (or below the lower band in strong trends) negates momentum.
* Exits: Trail under the median for conservative exits or under the teal band for trend-following exits. Consider scaling at structure (prior swing highs) or at a fixed $R$ multiple.
Parameter guidance by timeframe.
* Scalping / LTF (1–5m): $N=30$–$60$, $q_0=0.20$, $k=2$–3, residual mode on, baseline EMA $L=20$, adaptation $s=0.5$–0.7 to handle micro-vol spikes. Expect more signals; rely on latched logic to filter noise.
* Intraday swing (15–60m): $N=60$–$100$, $q_0=0.15$–0.20, $k=3$–4. Residual mode helps but is optional if the instrument trends cleanly. $s=0.3$–0.6.
* Swing / HTF (4H–D): $N=80$–$150$, $q_0=0.10$–0.18, $k=3$–5. Consider `SMA` baseline for smoother residuals and moderate adaptation $s=0.2$–0.4.
Baseline choice.
Use EMA for responsiveness (fast trend shifts) and SMA for stability (smoother residuals). Turning residual mode on is advantageous when price exhibits persistent drift; turning it off is useful when you explicitly want absolute bands.
How to time entries.
Prefer bar-close validation for both band recaptures and latched signals. If you must act intrabar, accept that crosses can “un-cross” before close; compensate with tighter stops or reduced size.
Risk management.
Position size to a fixed fractional risk per trade (e.g., 0.5–1.0% of equity). Define invalidation using structure (swing points) plus ATR. Avoid chasing when distance to the opposite band is small; reward-to-risk degrades rapidly once you are deep inside the distribution.
Combos and filters.
* Pair with a higher-timeframe median slope as a regime filter (trade only in the direction of the HTF median).
* Use band width relative to ATR as a range/trend gauge: unusually narrow bands suggest compression (mean-reversion bias); expanding bands suggest breakout potential (favor latched continuation).
* Volume or session filters (e.g., avoid illiquid hours) can materially improve execution.
Alerts for discretion.
Enable “Cross above Buy Level” / “Cross below Sell Level” for early notices and “Latched BUY/SELL” for conviction entries. Set alerts to “Once per bar close” to avoid noise.
Common pitfalls.
Do not interpret band touches as automatic signals; context matters. A strong trend will often ride the far band (“band walking”) and punish counter-trend fades—use the median slope and latched logic to separate trend from range. Do not oversmooth levels; you will lag breaks. Do not set $q$ too small or too large; extremes reduce statistical meaning and practical distance for stops.
A concise checklist.
1. Is the median flat (range) or sloped (trend)?
2. Is band width expanding or contracting vs ATR?
3. Are we near the tail level aligned with the intended trade?
4. For continuation: did the 3 steps for a latched signal complete?
5. Do stops and targets produce acceptable $R$ (≥1.5–2.0)?
6. Are you trading during liquid hours for the instrument?
Summary. ARQB provides statistically grounded, regime-aware bands and a disciplined, latched confirmation engine. Use the bands as objective context, the median as your equilibrium line, ATR adaptation to stay calibrated across regimes, and the latched logic to time higher-quality discretionary entries.
Disclaimer
No indicator guarantees profits. Adaptive Rolling Quantile Bands is a decision aid; always combine with solid risk management and your own judgment. Backtest, forward test, and size responsibly.
The content provided, including all code and materials, is strictly for educational and informational purposes only. It is not intended as, and should not be interpreted as, financial advice, a recommendation to buy or sell any financial instrument, or an offer of any financial product or service. All strategies, tools, and examples discussed are provided for illustrative purposes to demonstrate coding techniques and the functionality of Pine Script within a trading context.
Any results from strategies or tools provided are hypothetical, and past performance is not indicative of future results. Trading and investing involve high risk, including the potential loss of principal, and may not be suitable for all individuals. Before making any trading decisions, please consult with a qualified financial professional to understand the risks involved.
By using this script, you acknowledge and agree that any trading decisions are made solely at your discretion and risk.
Enhance your trading precision and confidence 🚀
Best regards
Chervolino

SMC - Institutional Confidence Oscillator [PhenLabs]📊 Institutional Confidence Oscillator
Version: PineScript™v6
📌 Description
The Institutional Confidence Oscillator (ICO) revolutionizes market analysis by automatically detecting and evaluating institutional activity at key support and resistance levels using our own in-house detection system. This sophisticated indicator combines volume analysis, volatility measurements, and mathematical confidence algorithms to provide real-time readings of institutional sentiment and zone strength.
Using our advanced thin liquidity detection, the ICO identifies high-volume, narrow-range bars that signal institutional zone formation, then tracks how these zones perform under market pressure. The result is a dual-wave confidence oscillator that shows traders when institutions are actively defending price levels versus when they’re abandoning positions.
The indicator transforms complex institutional behavior patterns into clear, actionable confidence percentiles, helping traders align with smart money movements and avoid common retail trading pitfalls.
🚀 Points of Innovation
Automated thin liquidity zone detection using volume threshold multipliers and zone size filtering
Dual-sided confidence tracking for both support and resistance levels simultaneously
Sigmoid function processing for enhanced mathematical accuracy in confidence calculations
Real-time institutional defense pattern analysis through complete test cycles
Advanced visual smoothing options with multiple algorithmic methods (EMA, SMA, WMA, ALMA)
Integrated momentum indicators and gradient visualization for enhanced signal clarity
🔧 Core Components
Volume Threshold System: Analyzes volume ratios against baseline averages to identify institutional activity spikes
Zone Detection Algorithm: Automatically identifies thin liquidity zones based on customizable volume and size parameters
Confidence Lifecycle Engine: Tracks institutional defense patterns through complete observation windows
Mathematical Processing Core: Uses sigmoid functions to convert raw market data into normalized confidence percentiles
Visual Enhancement Suite: Provides multiple smoothing methods and customizable display options for optimal chart interpretation
🔥 Key Features
Auto-Detection Technology: Automatically scans for institutional zones without manual intervention, saving analysis time
Dual Confidence Tracking: Simultaneously monitors both support and resistance institutional activity for comprehensive market view
Smart Zone Validation: Evaluates zone strength through volume analysis, adverse excursion measurement, and defense success rates
Customizable Parameters: Extensive input options for volume thresholds, observation windows, and visual preferences
Real-Time Updates: Continuously processes market data to provide current institutional confidence readings
Enhanced Visualization: Features gradient fills, momentum indicators, and information panels for clear signal interpretation
🎨 Visualization
Dual Oscillator Lines: Support confidence (cyan) and resistance confidence (red) plotted as percentage values 0-100%
Gradient Fill Areas: Color-coded regions showing confidence dominance and strength levels
Reference Grid Lines: Horizontal markers at 25%, 50%, and 75% levels for easy interpretation
Information Panel: Real-time display of current confidence percentiles with color-coded dominance indicators
Momentum Indicators: Rate of change visualization for confidence trends
Background Highlights: Extreme confidence level alerts when readings exceed 80%
📖 Usage Guidelines
Auto-Detection Settings
Use Auto-Detection
Default: true
Description: Enables automatic thin liquidity zone identification based on volume and size criteria
Volume Threshold Multiplier
Default: 6.0, Range: 1.0+
Description: Controls sensitivity of volume spike detection for zone identification, higher values require more significant volume increases
Volume MA Length
Default: 15, Range: 1+
Description: Period for volume moving average baseline calculation, affects volume spike sensitivity
Max Zone Height %
Default: 0.5%, Range: 0.05%+
Description: Filters out wide price bars, keeping only thin liquidity zones as percentage of current price
Confidence Logic Settings
Test Observation Window
Default: 20 bars, Range: 2+
Description: Number of bars to monitor zone tests for confidence calculation, longer windows provide more stable readings
Clean Break Threshold
Default: 1.5 ATR, Range: 0.1+
Description: ATR multiple required for zone invalidation, higher values make zones more persistent
Visual Settings
Smoothing Method
Default: EMA, Options: SMA/EMA/WMA/ALMA
Description: Algorithm for signal smoothing, EMA responds faster while SMA provides more stability
Smoothing Length
Default: 5, Range: 1-50
Description: Period for smoothing calculation, higher values create smoother lines with more lag
✅ Best Use Cases
Trending market analysis where institutional zones provide reliable support/resistance levels
Breakout confirmation by validating zone strength before position entry
Divergence analysis when confidence shifts between support and resistance levels
Risk management through identification of high-confidence institutional backing
Market structure analysis for understanding institutional sentiment changes
⚠️ Limitations
Performs best in liquid markets with clear institutional participation
May produce false signals during low-volume or holiday trading periods
Requires sufficient price history for accurate confidence calculations
Confidence readings can fluctuate rapidly during high-impact news events
Manual fallback zones may not reflect actual institutional activity
💡 What Makes This Unique
Automated Detection: First Pine Script indicator to automatically identify thin liquidity zones using sophisticated volume analysis
Dual-Sided Analysis: Simultaneously tracks institutional confidence for both support and resistance levels
Mathematical Precision: Uses sigmoid functions for enhanced accuracy in confidence percentage calculations
Real-Time Processing: Continuously evaluates institutional defense patterns as market conditions change
Visual Innovation: Advanced smoothing options and gradient visualization for superior chart clarity
🔬 How It Works
1. Zone Identification Process:
Scans for high-volume bars that exceed the volume threshold multiplier
Filters bars by maximum zone height percentage to identify thin liquidity conditions
Stores qualified zones with proximity threshold filtering for relevance
2. Confidence Calculation Process:
Monitors price interaction with identified zones during observation windows
Measures volume ratios and adverse excursions during zone tests
Applies sigmoid function processing to normalize raw data into confidence percentiles
3. Real-Time Analysis Process:
Continuously updates confidence readings as new market data becomes available
Tracks institutional defense success rates and zone validation patterns
Provides visual and numerical feedback through the oscillator display
💡 Note:
The ICO works best when combined with traditional technical analysis and proper risk management. Higher confidence readings indicate stronger institutional backing but should be confirmed with price action and volume analysis. Consider using multiple timeframes for comprehensive market structure understanding.

Apex Edge - London Open Session# Apex Edge - London Open Session Trading System
## Overview
The London Open Session indicator captures institutional price action during the first hour of the London forex session (8:00-9:00 AM GMT) and identifies high-probability breakout and retest opportunities. This system tracks the session's high/low range and generates precise entry signals when price breaks or retests these key institutional levels.
## Core Strategy
**Session Tracking**: Automatically identifies and marks the London Open session boundaries, creating a trading zone from the first hour's price range.
**Dual Entry Logic**:
- **Breakout Entries**: Triggers when price closes beyond the session high/low and continues in that direction
- **Retest Entries**: Activates when price returns to test the broken level as new support/resistance
**Performance Analytics**: Built-in win rate tracking displays real-time performance statistics over user-defined lookback periods, enabling data-driven optimization for each currency pair.
## Key Features
### Automated Zone Detection
- Precise London session timing with timezone offset controls
- Visual session boundaries with customizable colours
- Automatic high/low range calculation and display
### Smart Entry System
- Breakout confirmation requiring candle close beyond zone
- Retest detection with configurable pip distance tolerance
- Separate risk/reward ratios for breakout vs retest entries
- Visual entry arrows with clear trade direction labels
### Performance HUD
- Real-time win rate calculation over customizable periods (7-365 days)
- Total trades tracking with win/loss breakdown
- Average risk-reward ratio display
- Color-coded performance metrics (green >70%, yellow >50%, red <50%)
### PineConnector Integration
- Direct MT4/MT5 execution via PineConnector alerts
- Proper forex pip calculations for all currency pairs
- Customizable risk percentage per trade
- Symbol override capability for broker compatibility
- Automatic SL/TP level calculation in pips
## Critical Usage Requirements
### Pair-Specific Optimization
Each currency pair requires individual optimization due to varying volatility characteristics, institutional participation levels, and typical price ranges during London hours. The performance HUD is essential for identifying optimal settings before live trading.
**Recommended Testing Process**:
1. Apply indicator to desired currency pair and timeframe
2. Experiment with session timing - while 8:00-9:00 AM GMT is standard, some pairs may show improved performance with alternative hourly windows (e.g., 7:00-8:00 AM or 9:00-10:00 AM)
3. Adjust Stop Loss distances, Risk/Reward ratios, and Retest distances
4. Monitor win rate over 30+ day periods using the performance HUD
5. Only proceed with live alerts once consistent 60%+ win rates are achieved
6. Create separate optimized chart setups for each profitable pair/timeframe combination
### Timeframe Specifications
This indicator is specifically designed and tested for:
- **1-minute charts**: Optimal for capturing immediate institutional reactions
- **5-minute charts**: Balanced approach between noise reduction and opportunity frequency
Higher timeframes generally produce inferior results due to increased noise and reduced institutional edge during the London session window.
## Settings Configuration
### Session Timing
- **London Open/Close Hours**: Adjust for your chart's timezone
- **Rectangle End Time**: Set to 4:30 PM to stop signals before NY session close
- **Timezone Offset**: Ensure accurate London session capture
### Entry Parameters
- **Retest Distance**: 3-8 pips depending on pair volatility
- **Stop Loss Pips**: Separate settings for breakouts (10-15 pips) and retests (8-12 pips)
- **Risk/Reward Ratios**: Independent ratios for different entry types
### PineConnector Setup
- **License ID**: Your PineConnector license key
- **Symbol Override**: MT4/MT5 symbol names if different from TradingView
- **Risk Percentage**: Position size as percentage of account balance
- **Prefix/Comment**: Organize trades in terminal
## Manual Trading Limitations
Without PineConnector automation, traders face significant practical challenges:
**Settings Management**: Each currency pair requires different optimized parameters. Switching between charts means manually adjusting multiple settings each time, creating potential for errors and missed opportunities.
**Timing Sensitivity**: London Open signals can occur rapidly during high-volatility periods. Manual execution may result in slippage or missed entries.
**Multi-Pair Monitoring**: Tracking 4-11 currency pairs simultaneously while manually adjusting settings for each switch becomes impractical for most traders.
**Parameter Consistency**: Risk of using suboptimal settings when quickly switching between pairs, potentially compromising the careful optimization work.
## Recommended Workflow
1. **Historical Testing**: Use win rate HUD to identify profitable pairs and optimal parameters
2. **Demo Automation**: Test PineConnector alerts on demo accounts with optimized settings
3. **Live Implementation**: Deploy alerts only on proven profitable pair/timeframe combinations
4. **Ongoing Monitoring**: Regular review of performance metrics to maintain edge
## Risk Disclaimer
This indicator provides analysis tools and automation capabilities but does not guarantee profitable trading outcomes. Past performance does not predict future results. Users should thoroughly backtest and demo trade before risking live capital. The London session strategy works best during specific market conditions and may underperform during low volatility or unusual market environments.
## Support Requirements
Successful implementation requires:
- Basic understanding of London session market dynamics
- PineConnector subscription for automation features
- Patience for proper optimization process
- Realistic expectations about win rates and drawdown periods
This system is designed for serious traders willing to invest time in proper optimization and risk management rather than plug-and-play solutions.

Sunmool's Silver Bullet Model FinderICT Silver Bullet Model Indicator - Complete Guide
📈 Overview
The ICT Silver Bullet Model indicator is a supplementary tool for utilizing ICT's (Inner Circle Trader) market structure analysis techniques. This indicator detects institutional liquidity hunting patterns and automatically identifies structural levels, helping traders analyze market structure more effectively.
🎯 Core Features
1. Structural Level Identification
STL (Short Term Low): Recent support levels formed in the short term
STH (Short Term High): Recent resistance levels formed in the short term
ITL (Intermediate Term Low): Stronger support levels with more significance
ITH (Intermediate Term High): Stronger resistance levels with more significance
2. Kill Zone Time Display
London Kill Zone: 02:00-05:00 (default)
New York Kill Zone: 08:30-11:00 (default)
These are the most active trading hours for institutional players where significant price movements occur
3. Smart Sweep Detection
Bear Sweep (🔻): Pattern where price sweeps below lows then recovers - Simply indicates sweep occurrence
Bull Sweep (🔺): Pattern where price sweeps above highs then declines - Simply indicates sweep occurrence
Important: Sweep labels only mark liquidity hunting locations, not directional bias.
🔧 Configuration Parameters
Basic Settings
Sweep Detection Lookback: Number of candles for sweep detection (default: 20)
Structure Point Lookback: Number of candles for structural point detection (default: 10)
Sweep Threshold: Percentage threshold for sweep validation (default: 0.1%)
Time Settings
London Kill Zone: Active hours for London session
New York Kill Zone: Active hours for New York session
Visualization Settings
Customizable colors for each level type
Enable/disable alert notifications
📊 How to Use
1. Chart Setup
Most effective on 1-minute to 1-hour timeframes
Recommended for major currency pairs (EUR/USD, GBP/USD, etc.)
Also applicable to cryptocurrencies and indices
2. Signal Interpretation
🔻 Bear Sweep / 🔺 Bull Sweep Labels
Simply indicate liquidity hunting occurrence points
Not directional bias indicators
Reference for understanding overall context on HTF
🟢 Silver Bullet Long (Huge Green Triangle)
After Bear Sweep occurrence
Within Kill Zone timeframe
Current price positioned above swept level
→ Actual BUY entry signal
🔴 Silver Bullet Short (Huge Red Triangle)
After Bull Sweep occurrence
Within Kill Zone timeframe
Current price positioned below swept level
→ Actual SELL entry signal
3. Risk Management
Use swept levels as stop-loss reference points
Approach signals outside Kill Zone hours with caution
Recommended to use alongside other technical analysis tools
💡 Trading Strategies
Silver Bullet Strategy
Preparation Phase: Monitor charts 30 minutes before Kill Zone
Sweep Observation: Identify liquidity hunting points with 🔻🔺 labels (reference only)
Entry: Enter ONLY when huge triangle Silver Bullet signal appears within Kill Zone
Take Profit: Target opposite structural level or 1:2 reward ratio
Stop Loss: Beyond the swept level
Important: Small sweep labels are NOT trading signals!
Multi-Timeframe Approach
Step 1: HTF (Higher Time Frame) Sweep Reference
Observe 🔻🔺 sweep labels on 4-hour and daily charts
Reference only sweeps occurring at major structural levels
HTF sweeps are used to identify liquidity hunting points
Reference only, not for directional bias
Step 2: Transition to LTF (Lower Time Frame)
Move to 15-minute, 5-minute, and 1-minute charts
Analyze LTF with reference to HTF sweep information
Use STL, STH, ITL, ITH for precise entry point identification
Structural levels on LTF are the core of actual trading decisions
Only huge triangle (Silver Bullet) signals are actual entry signals
Recommended Usage
Identify overall sweep occurrence points on HTF (🔻🔺 labels)
Use this indicator on LTF to identify structural levels
Reference only huge triangle signals for actual trading during Kill Zone
Small sweep labels (🔻🔺) are for reference only, not entry signals
📋 Information Table Interpretation
Real-time information in the top-right table:
Kill Zone Status: Current active session status
Level Counts: Number of each structural level type
⚠️ Important Disclaimers
Backtesting results do not guarantee future performance
Exercise caution during high market volatility periods
Always apply proper risk management
Recommend comprehensive analysis with other analytical tools
🎓 Learning Resources
Study original ICT concepts through free YouTube educational content
Research Market Structure analysis techniques
Optimize through backtesting for personal use
🔬 Technical Implementation
Algorithm Logic
Pivot Point Detection: Uses TradingView's built-in pivot functions to identify swing highs and lows
Classification System: Automatically categorizes levels based on recent price action frequency
Sweep Validation: Confirms legitimate sweeps through price action analysis
Time-Based Filtering: Prioritizes signals during institutional active hours
Performance Optimization
Efficient array management prevents memory overflow
Dynamic level cleanup maintains chart clarity
Real-time calculation ensures minimal lag
🛠️ Customization Tips
Adjust lookback periods based on market volatility
Modify kill zone times for different market sessions
Experiment with sweep threshold for different instruments
Color-code levels according to personal preference
📈 Expected Outcomes
When properly implemented, this indicator can help traders:
Identify high-probability reversal points
Time entries with institutional flow
Reduce false signals through kill zone filtering
Improve risk-to-reward ratios
This indicator automates ICT's concepts into a user-friendly tool that can be enhanced through continuous learning and practical application. Success depends on understanding the underlying market structure principles and combining them with proper risk management techniques.

Liquidity Sweep Breakout - LSBLiquidity Sweep Breakout - LSB
A professional session-based breakout system designed for OANDA:USDJPY and other JPY pairs.
Not guesswork, but precision - built on detailed observation of institutional moves to capture clear trade direction daily.
Master the Market’s Daily Bank Flow.
---
Strategy Detail:
I discovered this strategy after carefully studying how Japanese banks influence the forex market during their daily settlement period. Banks are some of the biggest players in the financial world, and when they adjust or settle their accounts in the morning, it often creates a push in the market. From years of observation, I noticed a consistent pattern, once banks finish their settlements, the market usually continues moving in the same direction that was formed right after those actions. This daily banking flow often sets the tone for the entire trading session, especially for JPY pairs like USDJPY.
To capture this move, I built the indicator so that it follows the bank-driven trend with clear rules for entries, stop-loss (SL), and take-profit (TP). The system is designed with professional risk management in mind. By default, it assumes a $10,000 account size, risks only 1% of that balance per trade, and targets a 1:1.5 reward-to-risk ratio. This means for every $100 risked, the potential profit is $150. Such controlled risk makes the system safer and more sustainable for long-term traders. At the same time, users are not limited to this setup, they can adjust the account balance in the settings, and the indicator will automatically recalculate the lot size and risk levels based on their own capital. This ensures the strategy works for small accounts and larger accounts alike.
🌍 Why It Works
Fundamentally driven: Based on **daily Japanese banking settlement flows**.
Session-specific precision: Targets the exact window when USDJPY liquidity reshapes.
Risk-managed: Always calculates lot size based on account and risk preferences.
Automatable: With webhook + MT5 EA, it can be fully hands-free.
---
✅ Recommended
Pair: USDJPY (best observed behavior).
Timeframe: 3-Minute chart.
Platform: TradingView Premium (for webhooks).
Execution: MT5 via EA.
---
🔎 Strategy Concept
The Tokyo Magic Breakout (TMB) is built on years of session observation and the unique daily rhythm of the Japanese banking system.
Every morning between 5:50 AM – 6:10 AM PKT (09:50 – 10:10 JST), Japanese banks perform daily reconciliation and settlement. This often sets the tone for the USDJPY direction of the day.
This strategy isolates that critical moment of liquidity adjustment and waits for a clean breakout confirmation. Instead of chasing noise, it executes only when price action is aligned with the Tokyo market’s hidden flows.
---
🕒 Timing Logic
Session Start: 5:00 AM PKT (Tokyo market open range).
Magic Candle: The 5:54 AM PKT candle is marked as the reference “breakout selector.”
Checkpoints: First confirmation at 6:30 AM PKT, then every 15 minutes until 8:30 AM PKT.
* If price stays inside the magic range → wait.
* If a breakout happens but the candle wick touches the range → wait for the next checkpoint.
* If by 8:30 AM PKT no clean breakout occurs → the day is marked as No Trade Day (NTD).
👉 Recommended timeframe: 3-Minute chart (3M) for precise signals.
---
📈 Trade Execution
Entry: Clean break above/below the magic candle’s range.
Stop-Loss: Opposite side of the Tokyo session high/low.
Take-Profit: Calculated by Reward\:Risk ratio (default 1.5:1).
Lot Size: Auto-calculated based on your risk model:
* Fixed Dollar
* % of Equity
* Conservative (minimum of both).
Visuals include:
✅ Entry/SL/TP lines
✅ Shaded risk (red) and reward (green) zones
✅ Trade labels (Buy/Sell with lot size & levels)
✅ TP/SL hit markers
---
🔔 Alerts & Automation (AutoTMB)
This strategy is fully automation-ready with EA + MT5:
1. Enable alerts in TMB settings.
2. Insert your PineConnector License Key.
3. Configure your risk management preferences.
4. Create a TradingView alert → in the message box simply type:
Pine Script®
{{alert_message}}
and set the EA webhook.
Now, every breakout trade (with exact entry, SL, TP, and lot size) is sent instantly.
👉 On your MT5:
* Install the EA.
* Use the same license key.
* Run it on a VPS or local MT5 terminal.
You now have a hands-free trading system: AutoTMB.

MTF Adaptive Trendline Scalper (ATR + EMA System) By GouravThe MTF Adaptive Trendline Scalper is a precision-built trading tool designed for intraday scalpers and swing traders.
🔹 Core Features:
Adaptive Trendline Engine: Dynamically shifts trendline support/resistance using volatility (ATR) and Bollinger-band extremes.
Multi-Timeframe Mode: Calculate signals on your chosen higher timeframe or sync with the chart resolution.
Automatic Buy/Sell Signals: Clear trend reversal markers (💣 Buy / 🔨 Sell) for fast execution.
Volatility Filtering: ATR-based buffer reduces noise in choppy conditions.
Extra EMA Overlay: Plots 9 / 15 / 50 / 200 EMAs to help confirm trend bias and momentum.
🔹 How It Helps You Trade:
Catch scalping entries with trendline flips.
Trade trend-following continuations using EMA alignment.
Spot reversals when price pierces the adaptive channel.
Works on all assets (Forex, Crypto, Stocks, Indices) and any timeframe.
⚠️ Note: This is not financial advice. Always combine with your own risk management and strategy.

ICT GMMA VegasHigh-Level Summary
This indicator blends:
ICT concepts (Market Structure Shift, Break of Structure, Order Blocks, Liquidity Pools, Fair Value Gaps, Killzones, etc.).
GMMA (Guppy Multiple Moving Averages) to visualize short, medium, and long trend strength.
Vegas Tunnels (EMA channels 144/169 and 576/676, plus optional 288/388 mid-tunnels).
Vegas Touch entry module with candlestick patterns (Pin Bar 40%, Engulfing 60%).
Extra slope EMAs (EMA60 & EMA200 with color change by slope).
It not only shows the structure (OB, Liquidity, FVGs) but also plots entry arrows and alerts when Vegas Touch + GMMA align.
⚙️ Script Components
1. GMMA Visualization
Short-term EMAs (3–15, green).
Medium-term EMAs (30–60, red).
Long-term EMAs (100–250, blue).
Used to measure crowd sentiment: short EMAs = traders, long EMAs = investors.
The script counts how many EMAs the close is above/below:
If close above ≥17 → possible buy trend.
If close below ≥17 → possible sell trend.
Plots arrows for buy/sell flips.
2. Vegas Tunnels
Short-term tunnel → EMA144 & EMA169.
Long-term tunnel → EMA576 & EMA676.
Mid-tunnels → EMA288 & EMA388.
Plotted as orange/fuchsia/magenta bands.
Conditions:
Breakout checks → if close crosses above/below these EMAs compared to prior bar.
3. ICT Toolkit
Market Structure Shift (MSS) & BOS (Break of Structure): labels & dotted lines when price shifts trend.
Liquidity zones (Buy/Sell): boxes drawn around swing highs/lows with clustering.
Fair Value Gaps (FVG/IFVG): automatic box drawing, showing break status.
Order Blocks (OB): bullish/bearish blocks, breaker OB recognition.
Killzones: highlights NY open, London open/close, Asia session with background shading.
Displacement: plots arrows on large impulse candles.
NWOG/NDOG: Weekly/Monday Open Gaps.
Basically, this section gives a full ICT price action map on the chart.
4. Vegas Touch Entry Module (Pin40/Eng60 + EMA12 switch)
This is the custom entry system you added:
Logic:
If EMA12 > EMA169, use Tunnel (144/169) as reference.
If EMA12 ≤ EMA169, use Base (576/676).
Hard lock: no longs if EMA12 < EMA676; no shorts if EMA12 > EMA676.
Touch condition:
Long → price touches lower band (Tunnel/Base).
Short → price touches upper band (Tunnel/Base).
With ATR/Percent tolerance.
Trend filter:
Must also align with long-term Vegas direction (144/169 vs 576/676 cross).
Close must be on the outer side of the band.
Candlestick filter:
Pin Bar (≥40% wick) or
Engulfing (≥60% bigger body than previous).
Cooldown: avoids multiple signals in short succession.
Plots:
Green triangle below = Long entry.
Red triangle above = Short entry.
Alerts: triggers once per bar close with full message.
5. Slope EMAs (Extra)
EMA60 and EMA200 plotted as thick lines.
Color:
Green if sloping upward (current > value 2 bars ago).
Red if sloping downward.
📡 Outputs & Alerts
Arrows for GMMA trend flips.
Arrows for Vegas Touch entries.
Labels for MSS, BOS, FVGs, OBs.
Liquidity/FVG/OB boxes.
Background shading for killzones.
Alerts:
“📡 Entry Alert (Long/Short)” for GMMA.
“VT LONG/SHORT” for Vegas Touch.
📝 Key Idea
This is not just one system, but a multi-layered confluence tool:
ICT structure & liquidity context.
GMMA trend recognition.
Vegas Tunnel directional bias.
Candlestick-based confirmation (Pin/Engulf).
Alert automation for live trading.
👉 It’s essentially a trader’s dashboard: structural map + moving averages + entry signals all in one.

Same-Direction Candles (Two Symbols)Same-Direction Candles (Two Symbols)
What it does
Highlights bars on your chart when two symbols print the same candle direction on the chosen timeframe:
Both Bullish → one color
Both Bearish → another color
Great for spotting synchronous moves (e.g., NQ & ES, QQQ & SPY), or confirming risk-on/risk-off with an inverse asset (e.g., NQ vs DXY with inversion).
How it works
For each bar, the script checks whether close > open (bullish), close < open (bearish), or equal (doji) for:
The chart’s symbol
A second symbol pulled via request.security() (optionally on a different timeframe)
If both symbols are bullish, it paints Bull color; if both are bearish, it paints Bear color. Dojis can be ignored.
Inputs
Second symbol: Ticker to compare (e.g., CME_MINI:ES1!, NASDAQ:QQQ, TVC:DXY).
Second symbol timeframe: Leave blank to use the chart’s TF, or set a specific one (e.g., 5, 15, D).
Invert second symbol direction?: Flips the second symbol’s candle direction (useful for inversely related assets like DXY vs indices).
Ignore doji candles: Skip highlights when either candle is neutral (open == close).
Coloring options: Toggle bar coloring and/or background shading; pick colors; set background transparency.
Alerts
Three alert conditions:
Both Bullish
Both Bearish
Both Same Direction (bullish or bearish)
Create alerts from the Add Alert dialog after adding the script.
Use cases
Index confluence: NQ & ES moving in lockstep
ETF confirmation: QQQ & SPY agreement
FX/Index risk signals: Invert DXY against NQ/ES to see when equity strength aligns with dollar weakness
Tips
For mixed timeframes (e.g., chart on 1m, ES on 5m), set Second symbol timeframe to the higher TF to reduce noise.
Keep Ignore dojis on for cleaner signals.
Combine with your own entry rules (structure, FVGs, liquidity sweeps).
Notes
Works on any symbol/timeframe supported by TradingView.
Overlay script; no strategy/entries/exits are executed.
Past performance ≠ future results; for education only.
Version: 1.0 – initial release (bar/background highlights, doji filter, inversion, multi-TF support, alerts).

MACD StrategyOverview
The "MACD Strategy" is a straightforward trading strategy tested for BTCUSDT Futures on the 1-minute timeframe, leveraging the Moving Average Convergence Divergence (MACD) indicator to identify momentum-based buy and sell opportunities. Developed with input from expert trading analyst insights, this strategy combines technical precision with risk management, making it suitable for traders of all levels on platforms like TradingView. It focuses on capturing trend reversals and momentum shifts, with clear visual cues and automated alerts for seamless integration with trading bots (e.g., Bitget webhooks).
#### How It Works
This strategy uses the MACD indicator to generate trading signals based on momentum and trend direction:
- **Buy Signal**: Triggered when the MACD line crosses above the signal line, and the MACD histogram turns positive (above zero). This suggests increasing bullish momentum.
- **Sell Signal**: Triggered when the MACD line crosses below the signal line, and the MACD histogram turns negative (below zero), indicating growing bearish momentum.
Once a signal is detected, the strategy opens a position (long for buy, short for sell) with a position size calculated based on your risk tolerance. It includes a stop-loss to limit losses and a take-profit to lock in gains, both dynamically adjusted using the Average True Range (ATR) for adaptability to market volatility.
#### Key Features
- **MACD-Based Signals**: Relies solely on MACD for entry points, plotted in a separate pane for clear momentum analysis.
- **Risk Management**: Automatically calculates position size based on a percentage of your account balance and sets stop-loss and take-profit levels using ATR multipliers and a risk:reward ratio.
- **Visual Feedback**: Plots entry, stop-loss, and take-profit lines on the chart with labeled markers for easy tracking.
- **Alerts**: Includes Bitget webhook-compatible alerts for automated trading, notifying you of buy and sell signals in real-time.
#### Input Parameters
- **Account Balance**: Default 10000 – Set your initial trading capital to determine position sizing.
- **MACD Fast Length**: Default 12 – The short-term EMA period for MACD sensitivity.
- **MACD Slow Length**: Default 26 – The long-term EMA period for MACD calculation.
- **MACD Signal Length**: Default 9 – The smoothing period for the signal line.
- **Risk Per Trade (%)**: Default 3.0 – The percentage of your account balance risked per trade (e.g., 3% of 10000 = 300).
- **Risk:Reward Ratio**: Default 3.0 – The ratio of potential profit to risk (e.g., 3:1 means risking 1 to gain 3).
- **SL Multiplier**: Default 1.0 – Multiplies ATR to set the stop-loss distance (e.g., 1.0 x ATR).
- **TP Multiplier**: Default 3.0 – Multiplies ATR to set the take-profit distance, adjusted by the risk:reward ratio.
- **Line Length (bars)**: Default 25 – Duration in bars for displaying trade lines on the chart.
- **Label Position**: Default 'left' – Position of text labels (left or right) relative to trade lines.
- **ATR Period**: Default 14 – The number of periods for calculating ATR to measure volatility.
#### How to Use
1. **Add to Chart**: Load the "MACD Strategy" as a strategy and the "MACD Indicator" as a separate indicator on your TradingView chart (recommended for BTCUSDT Futures on the 1-minute timeframe).
2. **Customize Settings**: Adjust the input parameters based on your risk tolerance and market conditions. For BTCUSDT Futures, consider reducing `Risk Per Trade (%)` during high volatility (e.g., 1%) or increasing `SL Multiplier` for wider stops.
3. **Visual Analysis**: Watch the main chart for trade entry lines (green for buy, red for sell), stop-loss (red), and take-profit (green) lines with labels. Use the MACD pane below to confirm momentum shifts.
4. **Set Alerts**: Create alerts in TradingView for "Buy Signal" and "Sell Signal" to automate trades via Bitget webhooks.
5. **Backtest and Optimize**: Test the strategy on historical BTCUSDT Futures 1-minute data to fine-tune parameters. The short timeframe requires quick execution, so monitor closely for slippage or latency.
#### Tips for Success
- **Market Conditions**: This strategy performs best in trending markets on the 1-minute timeframe. Avoid choppy conditions where MACD crossovers may produce false signals.
- **Risk Management**: Start with the default 3% risk per trade and adjust downward (e.g., 1%) during volatile periods like BTCUSDT news events. The 3:1 risk:reward ratio targets consistent profitability.
- **Timeframe**: Optimized for 1-minute charts; switch to 5-minute or 15-minute for less noise if needed.
- **Confirmation**: Cross-check MACD signals with price action or support/resistance levels for higher accuracy on BTCUSDT Futures.
#### Limitations
- This strategy relies solely on MACD, so it may lag in fast-moving or sideways markets. Consider adding a secondary filter (e.g., RSI) if needed.
- Stop-loss and take-profit are ATR-based and may need adjustment for BTCUSDT Futures’ high volatility, especially during leverage trading.
#### Conclusion
The "MACD Strategy" offers a simple yet effective way to trade momentum shifts using the MACD indicator, tested for BTCUSDT Futures on the 1-minute timeframe, with robust risk management and visual tools. Whether you’re scalping crypto futures or exploring short-term trends, this strategy provides a solid foundation for automated or manual trading. Share your feedback or customizations in the comments, and happy trading!

BB Trading WindowsTrading Windows for Blue Belt Strategy. The windows are as follows:
1:00-02:59
13:00-15:59
22:00-22:59
All in NY timezone.

Custom Volume + Buyer & Price %Title: Custom Volume + Buyer & Price %
Description:
This indicator helps you see who is controlling the market — buyers or sellers — using volume and price action. It works even if your chart is on a small timeframe (like 5-min or 15-min), by showing Daily, Weekly, and Monthly information from the higher timeframe volume charts.
Key Features & How It Works:
Buyer % (B%):
Measures where the closing price is within the high-low range of a candle.
Calculation:
\text{Buyer %} = \frac{\text{Close} - \text{Low}}{\text{High} - \text{Low}} \times 100
Interpretation:
> 50% → Buyers are stronger
< 50% → Sellers are stronger
50% → Balanced
Volume Coloring:
Volume bars are colored based on Buyer %, not price movement:
Green → Buyers dominate
Red → Sellers dominate
Yellow → Balanced day
Higher Timeframe Insight:
Displays Daily, Weekly, and Monthly volume & Buyer % even if your chart is on a smaller timeframe.
Lets you understand long-term buying or selling pressure while trading intraday.
21-Day Average:
Shows average Buyer % and average volume over the past 21 days for trend context.
Why It’s Useful:
Quickly visualize whether the market is buyer-driven or seller-driven.
Identify strong accumulation or distribution days.
Works on any chart timeframe while giving higher timeframe perspective.
Ideal for traders who want easy, visual insight into market sentiment.

Donchian Squeeze Oscillator# Donchian Squeeze Oscillator (DSO) - User Guide
## Overview
The Donchian Squeeze Oscillator is a technical indicator designed to identify periods of low volatility (squeeze) and high volatility (expansion) in financial markets by measuring the distance between Donchian Channel bands. The indicator normalizes this measurement to a 0-100 scale, making it easy to interpret across different timeframes and instruments.
## How It Works
The DSO calculates the width of Donchian Channels as a percentage of the middle line, smooths this data, and then normalizes it using historical highs and lows over a specified lookback period. The result is inverted so that:
- **High values (80+)** = Narrow channels = Low volatility = Squeeze
- **Low values (20-)** = Wide channels = High volatility = Expansion
## Key Parameters
### Core Settings
- **Donchian Channel Period (20)**: The number of bars used to calculate the highest high and lowest low for the Donchian Channels
- **Smoothing Period (5)**: Applies moving average smoothing to reduce noise in the oscillator
- **Normalization Lookback (200)**: Historical period used to normalize the oscillator between 0-100
### Threshold Levels
- **Over Squeeze (80)**: Values above this level indicate strong squeeze conditions
- **Over Expansion (20)**: Values below this level indicate strong expansion conditions
## Reading the Indicator
### Color Coding
- **Red Line**: Squeeze condition (above 80 threshold) - Markets are consolidating
- **Orange Line**: Neutral/trending condition with upward momentum
- **Green Line**: Expansion condition or downward momentum
### Visual Elements
- **Red Dashed Line (80)**: Squeeze threshold - potential breakout zone
- **Gray Dotted Line (50)**: Middle line - neutral zone
- **Green Dashed Line (20)**: Expansion threshold - high volatility zone
- **Red Background**: Highlights active squeeze periods
## Trading Applications
### 1. Breakout Trading
- **Setup**: Wait for DSO to reach 80+ (squeeze zone)
- **Entry**: Look for breakouts when DSO starts declining from squeeze levels
- **Logic**: Prolonged low volatility often precedes significant price movements
### 2. Volatility Cycle Trading
- **Squeeze Phase**: DSO > 80 - Prepare for potential breakout
- **Breakout Phase**: DSO declining from 80 - Trade the direction of breakout
- **Expansion Phase**: DSO < 20 - Expect trend continuation or reversal
### 3. Trend Confirmation
- **Orange Color**: Suggests bullish momentum during expansion
- **Green Color**: Suggests bearish momentum or consolidation
- Use in conjunction with price action for trend confirmation
## Best Practices
### Timeframe Selection
- **Higher Timeframes (Daily, 4H)**: More reliable signals, fewer false breakouts
- **Lower Timeframes (1H, 15M)**: More frequent signals but higher noise
- **Multi-timeframe Analysis**: Confirm squeeze on higher TF, enter on lower TF
### Parameter Optimization
- **Volatile Markets**: Increase Donchian period (25-30) and smoothing (7-10)
- **Range-bound Markets**: Decrease Donchian period (15-20) for more sensitivity
- **Trending Markets**: Use longer normalization lookback (300-400)
### Signal Confirmation
Always combine DSO signals with:
- **Price Action**: Support/resistance levels, chart patterns
- **Volume**: Confirm breakouts with increasing volume
- **Other Indicators**: RSI, MACD, or momentum oscillators
## Alert System
The indicator includes built-in alerts for:
- **Squeeze Started**: When DSO crosses above the squeeze threshold
- **Expansion Started**: When DSO crosses below the expansion threshold
## Common Pitfalls to Avoid
1. **False Breakouts**: Don't trade every squeeze - wait for confirmation
2. **Parameter Over-optimization**: Stick to default settings initially
3. **Ignoring Market Context**: Consider overall market conditions and news
4. **Single Indicator Reliance**: Always use additional confirmation tools
## Advanced Tips
- Monitor squeeze duration - longer squeezes often lead to bigger moves
- Look for squeeze patterns at key support/resistance levels
- Use DSO divergences with price for potential reversal signals
- Combine with Bollinger Band squeezes for enhanced accuracy
## Conclusion
The Donchian Squeeze Oscillator is a powerful tool for identifying volatility cycles and potential breakout opportunities. Like all technical indicators, it should be used as part of a comprehensive trading strategy rather than as a standalone signal generator. Practice with the indicator on historical data before implementing it in live trading to understand its behavior in different market conditions.

Trend Display Table (with Change Alerts)📌 Indicator: Trend Display Table (with Change Alerts)
This indicator helps identify trend direction based on a 15-minute 20 SMA compared against a 10 EMA applied to that SMA.
Trend Logic:
Bullish → 20 SMA crosses above 10 EMA (on SMA values)
Bearish → 20 SMA crosses below 10 EMA (on SMA values)
Neutral → No crossover (trend continues from previous state)
Display:
A compact trend table appears on the chart (top-right), showing the current trend with customizable colors, font size, and background.
Alerts:
Alerts are triggered only when the trend changes (from Bullish → Bearish or Bearish → Bullish).
This prevents repeated alerts on every bar.
✅ Useful for:
Confirming higher timeframe trend bias
Filtering trades in choppy markets
Getting notified instantly when the trend flips
