BTC Markup/Markdown Zones by Koenigsegg📈 BTC Markup/Markdown Zones
A handcrafted indicator designed to mark Bitcoin's most critical High Time Frame (HTF) structure shifts. This tool overlays true institutional-level Markup and Markdown Zones, selected manually after deep market review. Whether you're testing strategies or actively trading, this tool gives you the bigger picture at all times.
🔍 Key Features:
✅ HTF Markup & Markdown Zones
Every zone is manually selected — no indicators, no repainting. Just raw market history and real structure.
✅ Two Display Modes
• Background Zones — soft overlays with low opacity for visual context — with the option to increase opacity manually if desired.
• Start Candle Highlight — sharply highlighted candle marking the final pivot before a macro reversal.
✅ Custom Color Controls (Style Tab)
All visual styling lives in the Style tab, with clearly labeled fields:
• Markup Zone
• Markdown Zone
• Start Candle Highlight Markup
• Start Candle Highlight Markdown
✅ Minimal Input Section
Just one toggle: display mode. Everything else is kept clean and intuitive.
🧠 Purpose:
This script is made for any timeframe:
• Zoom into lower timeframes to know whether you're trading inside a Markup or Markdown
• Use it during strategy testing for true structural awareness
📅 Handpicked Macro Turning Points:
Each zone originates from a manually confirmed candle — the last meaningful candle before a shift in control between bulls and bears:
• FRI 19 AUG 2011 12PM – MARK DOWN
• THU 20 OCT 2011 12AM – MARK UP
• WED 10 APR 2013 12PM – MARK DOWN
• FRI 12 APR 2013 12PM – MARK UP
• SAT 30 NOV 2013 12AM – MARK DOWN
• WED 14 JAN 2015 12PM – MARK UP
• SUN 17 DEC 2017 12PM – MARK DOWN
• SAT 15 DEC 2018 12PM – MARK UP
• WED 14 APR 2021 4AM – MARK DOWN
• TUE 22 JUN 2021 12PM – MARK UP
• WED 10 NOV 2021 12PM – MARK DOWN
• MON 21 NOV 2022 8PM – MARK UP
• THU 14 MAR 2024 4AM – MARK DOWN
• MON 5 AUG 2024 12PM – MARK UP
• MON 20 JAN 2025 4AM – MARK DOWN
💡 Zones are manually updated by me after each new confirmed Markup or Markdown.
🧬 Fractal Structure for MTF Systems
Price is fractal — meaning the same principles of structure repeat across all timeframes. In Version 2, this tool evolves by introducing manually selected sub-zones inside each High Time Frame (HTF) Markup or Markdown. These sub-zones reflect Medium Timeframe (MTF) structure shifts, offering precision for traders who operate on both intraday and swing levels.
This makes the indicator ideal for low timeframe (LTF) Markup/Markdown awareness — whether you're managing 15m entries or building multi-timeframe confluence systems.
No auto-zones. No guesswork. Just clean, intentional structure division within the broader trend, handpicked for maximum clarity and edge.
💡 Pro Tip:
When price is inside a Markup Zone, shorting becomes riskier — you're trading against a macro bullish structure.
When inside a Markdown Zone, longing becomes riskier — you're fighting against confirmed bearish momentum.
Use this tool to stay aligned with the broader move, especially when zoomed into smaller timeframes or managing entries/exits during intraday setups.
📈 Markup Phase – Bullish Sentiment
Definition: A period where price makes higher highs and higher lows — the uptrend is in full force.
Why sentiment is bullish:
- Institutions and smart money are already positioned long.
- Public/institutional demand drives prices up.
- Momentum is supported by positive news, breakouts, and FOMO.
- Higher highs confirm buyers are in control.
📉 Markdown Phase – Bearish Sentiment
Definition: A period where price makes lower lows and lower highs — clear downtrend.
Why sentiment is bearish:
- Distribution has already occurred, and supply outweighs demand.
- Smart money is short or sidelined, waiting for deeper prices.
- Panic selling or trend-following traders add downside momentum.
- Lower lows confirm sellers are in control.
❌ Trading Against the Trend — Consequences:
-Reduced Probability of Success
-You’re fighting the dominant flow. Most participants are pushing in the opposite direction.
-Drawdowns & Stop-Outs
-Countertrend trades often get wicked or flushed before any meaningful move, especially without structure-based entries.
-Low Risk-Reward Ratio
-Trends offer sustained moves. Countertrend trades may have small take-profit zones or chop.
-Mental Drain & Doubt
-Fighting momentum causes anxiety, second-guessing, and emotional reactions.
-Missed Opportunities
-Focusing on fighting the trend makes you blind to the high-probability setups with the trend.
-Increased Transaction Costs
-More stop-outs and re-entries mean more fees, more friction.
-FOMO from Watching the Trend Run
-Entering countertrend means you might watch the trend explode without you.
-Confirmation Bias & Stubbornness
-Countertrend traders often look for reasons to justify staying in the wrong direction — leading to bigger losses.
🧠 Summary
In markup = bulls dominate → you swim with the current.
In markdown = bears dominate → going long is like pushing a rock uphill.
Trading with the trend is not just safer, it's smarter. The edge lives in momentum — not ego.
⚠️ Disclaimer
This indicator is for educational and analytical use only. It is not financial advice and should not be relied on for decision-making without personal analysis.
This is not a predictive tool. No indicator can forecast upcoming price movements.
What you see here is based purely on past market behavior — specifically, historical tops and bottoms that marked the start of confirmed reversals.
This script does not know where the next reversal begins, nor can it determine where a new Markup or Markdown starts or ends. It is designed to provide context, not prediction.
Always trade with responsibility and perform your own due diligence.
Cari dalam skrip untuk "美国要强买强卖,要求中国购买指定商品,四年还必须买够15万亿?"

True Range Orginal📌 Description – True Range Original
This indicator calculates the range (price spread) of the last N candles and displays it directly on the chart, along with suggested dynamic stop-loss levels based on recent volatility. Ideal for scalpers and day traders working on short timeframes such as 1-minute charts.
🔍 Features:
Calculates the difference between the highest high and lowest low of the last N bars (default: 15).
Plots a floating label with the current range value, updated every 5 candles.
Displays 4 dynamic stop levels:
For long positions:
Stop at 1x range (green line)
Stop at 1.5x range (light green line)
For short positions:
Stop at 1x range (red line)
Stop at 1.5x range (dark red line)
⚙️ Inputs:
Range period (number of bars)
Stop multiplier 1 (default: 1.0)
Stop multiplier 2 (default: 1.5)
📈 Usage:
This tool helps you size your stop-loss dynamically based on recent price action instead of using fixed values. It can be used alone or in combination with other tools like support/resistance, volume, or aggression indicators.

Tango Multi-Timeframe Trend DotsTLDR: When the background is green, favor long. When the background is red, favor short.
By default: Will show 5-minute, 10-minute, 15-minute timeframe.
📈 Tango Multi-Timeframe Trend Dots
Tango Trend Dots is a visual trend-tracking tool that plots clean, color-coded trend signals from up to three different timeframes in a dedicated indicator pane. Each dot represents the trend direction on that timeframe:
🟢 Green = Uptrend
🔴 Red = Downtrend
🟡 Yellow = Trend-MACD conflict (optional MACD filter)
🔧 Features
Multi-Timeframe Support: Configure 3 different timeframes (default: 5m, 10m, 15m)
Color-Coded Trends:
Green = uptrend
Red = downtrend
Yellow = conflicting trend & MACD (if enabled)
MACD Filter (optional): Highlights trend conflicts using MACD histogram
Background Shading: Optional highlight when 2 out of 3 timeframes agree
Customizable UI: Clean labels and visual alignment of all signals
📊 Use Cases
Confirm short-term trades with higher timeframe alignment
Identify conflicting signals using MACD divergence
Spot consensus trends with visual clarity

CYCLE BY RiotWolftradingDescription of the "CYCLE" Indicator
The "CYCLE" indicator is a custom Pine Script v5 script for TradingView that visualizes cyclic patterns in price action, dividing the trading day into specific sessions and 90-minute quarters (Q1-Q4). It is designed to identify and display market phases (Accumulation, Manipulation, Distribution, and Continuation/Reversal) along with key support and resistance levels within those sessions. Additionally, it allows customization of boxes, lines, labels, and colors to suit user preferences.
Main Features
Cycle Phases:
Accumulation (1900-0100): Represents the phase where large operators accumulate positions.
Manipulation (0100-0700): Identifies potential manipulative moves to mislead retail traders.
Distribution (0700-1300): The phase where large operators distribute their positions.
Continuation/Reversal (1300-1900): Indicates whether the price continues the trend or reverses.
90-Minute Quarters (Q1-Q4):
Divides each 6-hour cycle (360 minutes) into four 90-minute quarters (Q1: 00:00-01:30, Q2: 01:30-03:00, Q3: 03:00-04:30, Q4: 04:30-06:00 UTC).
Each quarter is displayed with a colored box (Q1: light purple, Q2: light blue, Q3: light gray, Q4: light pink) and labels (defaulted to black).
Support and Resistance Visualization:
Draws boxes or lines (based on settings) showing the high and low levels of each session.
Optionally displays accumulated volume at the highs and lows within the boxes.
Daily Lines and Last 3 Boxes:
How to Use the Indicator
Step 1: Add the Indicator to TradingView
Open TradingView and select the chart where you want to apply the indicator (e.g., UMG9OOR on a 5-minute timeframe, as shown in the screenshot).
Go to the Pine Editor (at the bottom of the TradingView interface).
Copy and paste the provided code.
Click Compile and then Add to Chart.
Step 2: Configure the Indicator
Click on the indicator name on the chart ("CYCLE") and select Settings (or double-click the name).
Adjust the options based on your needs:
Cycle Phases: Enable/disable phases (Accumulation, Manipulation, Distribution, Continuation/Reversal) and adjust their time slots if needed.
90-Minute Quarters: Enable/disable quarters (Q1-Q4).
Step 3: Interpret the Indicator
Identify Cycle Phases:
Observe the red boxes indicating the phases (Accumulation, Manipulation, etc.).
The high and low levels within each phase are potential support/resistance zones.
If volume is enabled, pay attention to the accumulated volume at highs and lows, as it may indicate the strength of those levels.
Use the 90-Minute Quarters (Q1-Q4):
The colored boxes (Q1-Q4) divide the day into 90-minute segments.
Each quarter shows the price range (high and low) during that period.
Use these boxes to identify price patterns within each quarter, such as breakouts or consolidations.
The labels (Q1, Q2, etc.) help you track time and anticipate potential moves in the next quarter.
Analyze Support and Resistance:
The high and low levels of each phase/quarter act as support and resistance.
Daily lines (if enabled) show key levels from the previous day, useful for planning entries/exits.
The "last 3 boxes below price" (if enabled) highlight potential support levels the price might target.
Avoid Manipulation:
During the Manipulation phase (0100-0700), be cautious of sharp moves or false breakouts.
Use the high/low levels of this phase to identify potential traps (as explained in your first question about manipulation candles).
Step 4: Trading Strategy
Entries and Exits:
Support/Resistance: Use the high/low levels of phases and quarters to set entry or exit points.
For example, if the price bounces off a Q1 support level, consider a buy.
Breakouts: If the price breaks a high/low of a quarter (e.g., Q2), wait for confirmation to enter in the direction of the breakout.
Volume: If accumulated volume is high near a key level, that level may be more significant.
Risk Management:
Place stop-loss orders below lows (for buys) or above highs (for sells) identified by the indicator.
Avoid trading during the Manipulation phase unless you have a specific strategy to handle false breakouts.
Time Context:
Use the quarters (Q1-Q4) to plan your trades based on time. For example, if Q3 is typically volatile in your market, prepare for larger moves between 03:00-04:30 UTC.
Step 5: Adjustments and Testing
Test on Different Timeframes: The indicator is set for a 5-minute timeframe (as in the screenshot), but you can test it on other timeframes (e.g., 1-minute, 15-minute) by adjusting the time slots if needed.
Adjust Colors and Styles: If the default colors are not visible on your chart, change them for better clarity.
---
📌 1. **Accumulation: Strong Institutional Activity**
- During the **accumulation phase, we see **high volume: 82.773K, which suggests strong buying interest**, likely from institutional players.
- This sets the base for the following upward move in price.
---
📌 2. **Manipulation: False Breakout with Lower Volume**
- Later, there's a manipulation phase where price breaks above previous highs, but the volume (71.814K) is **lower than during accumulation**.
- This implies that buyers are not as aggressive as before—no real demandbehind the breakout.
- It’s likely a bull trap, where smart money is selling into the breakout to exit their positions.
---
### 📌 3. Distribution: Weakness and Lack of Demand
- The market enters a distribution phase, and volume drops even further (only 7.914K).
- Price struggles to go higher, and you start seeing rejections at the top.
- This shows that demand is drying up, and smart money is offloading positions**—not accumulating anymore.
---
### 💡 Why Take the Short Here?
- Volume is not increasing with new highs—showing weak demand**.
- The manipulation volume is weaker than the accumulation volume, confirming the breakout was likely false.
- Structure starts to break down (Q levels falling), which confirms weakness.
- This creates a high-probability short setup:
- **Entry:** after confirmation of distribution and structural breakdown.
- **Stop loss:** above the manipulation high.
- **Target:** down toward previous lows or value zones.
---
### ✅ Conclusion
Since the manipulation volume failed to exceed the accumulation volume, the breakout lacked real strength. Combined with decreasing volume in the distribution phase, this indicates fading demand and supply taking control—which justifies entering a short position.

ian_Trado v15 Trend Entry Filter# 📈 ian_Trado v15 Trend Entry Filter (Pine Script v6)
The **ian_Trado v15** is a multi-factor **trend confirmation filter** for NASDAQ (NAS100), Dow Jones (DJ30), Gold (XAU), DAX, and USDJPY.
It combines **EMA structure**, **Donchian channel breakout**, **MACD histogram momentum**, **Volume confirmation**, and a **Range Compression Filter** to avoid entering during choppy or sideways markets.
✅ Designed for **bot deployment** (e.g., grid bots, long/short breakout bots) or **manual trading**.
---
## 🔍 How This Filter Works:
1. **EMA Trend Confirmation**
- Long Trend: EMA(1) > EMA(5) > EMA(60)
- Short Trend: EMA(1) < EMA(5) < EMA(60)
2. **Donchian Channel Width Expansion**
- Only allows trades when the **breakout width** exceeds a minimum threshold.
3. **MACD Histogram Slope Filter (Optional)**
- Confirms momentum building in the direction of the trend.
- Strict Mode: MACD histogram must consistently rise or fall over 3 bars.
4. **Volume Filter (Optional)**
- Ensures volume supports the move (filters out weak conditions).
5. **Range Compression Filter (Optional)**
- Avoids entries during sideways chop.
6. **Cooldown Control**
- Limits overtrading by requiring spacing between entries.
7. **Exit Conditions**
- Gray dot appears when trending conditions are no longer valid.
---
## ⚙️ Settings Explained:
| Setting | Description |
|:--------|:------------|
| **Cooldown Bars** | Minimum bars between consecutive entries |
| **Profit Target (%)** | Visual profit marker for exit tracking |
| **Donchian Channel Length** | Lookback period for detecting breakout width |
| **Minimum Donchian Width** | Threshold to confirm meaningful breakouts |
| **Volume Lookback Period** | Average volume validation window |
| **Box Range (Range Compression)** | Max allowed price range over lookback bars |
| **Range Compression Bars** | Number of bars to check for range compression |
| **Strict MACD Filter** | Use stricter MACD slope checks |
---
## 📊 Recommended Settings by Instrument (1H Chart):
| Asset | Min Donchian Width | Range Compression | Profit Target |
|:------|:-------------------|:------------------|:--------------|
| **NAS100** (Nasdaq) | 300–450 pts | 400 pts / 40 bars | 1.5% |
| **DJ30** (Dow Jones) | 400–600 pts | 500 pts / 40 bars | 1.0–1.5% |
| **XAU/USD** (Gold) | 10–15 pts | 8 pts / 30 bars | 0.8–1.2% |
| **DAX40** (Germany) | 200–300 pts | 250 pts / 40 bars | 1.0% |
| **USD/JPY** (Forex) | 0.5–0.8 pts | 0.4 pts / 40 bars | 0.5–0.8% |
---
## 🔔 Alerts Available:
- Long Entry
- Short Entry
- Exit Zone
> **Note:** Volume filter may be disabled if volume is unreliable (e.g., some forex pairs).
---
## 📅 Version:
- **ian_Trado v15** — April 2025
- Built with **Pine Script v6** for maximum stability
- Clean toggling and plotting logic (no `na` errors)

Hippo Battlefield - Bulls VS Bears 20 bars## Hippo Battlefield – Bulls VS Bears (20 Bars)
**What it is**
A multi-dimensional momentum-and-sentiment oscillator that combines classic Bull/Bear Power with ATR- or peak-normalization, then layers on RSI and MACD-derived metrics into:
1. **A colored bar series** showing net Bull+Bear Power strength over the last 20 bars,
2. **A dynamic table** of each of those 20 BBP values (grouped into four 5-bar “quartals”), with symbols, per-bar change, and rolling averages, and
3. **A composite “Weighted BBP” histogram** blending normalized RSI, MACD, and BBP into a single view.
---
### Key Inputs
- **Length (EMA)** – look-back for the underlying EMA (default 60)
- **Normalization Length** – look-back window for peak-normalization (default 60)
- **Use ATR for Norm.** – toggle ATR-based normalization vs. highest-abs(BBP)
- **Show Tables** – toggle the bottom-right 21×11 grid of raw and average BBP values
---
### What You See
#### 1. Colored Bars (Overlay = false)
- Bars are colored by normalized BBP intensity:
- Extreme Bull (≥+10): deep blue
- Strong Bull (+5 to +10): green/yellow
- Weak Bull (+0 to +5): dark green
- Weak Bear (–0 to –5): dark red
- Strong Bear (–5 to –10): pink/red
- Extreme Bear (<–10): magenta
#### 2. Bottom-Right Table (20 Bars of Data)
- Divided into four columns (0–4, 5–9, 10–14, 15–19 bars ago) and one “average” row.
- Each cell shows:
1. Bar index (1–20),
2. Normalized BBP value (to four decimals),
3. Direction symbol (↑/↓/=),
4. Bar-to-bar change (± value),
5. A separator “|”.
- At the very bottom, each column’s 5-bar average is displayed as “Avg: X.XXXX” with a dot marker.
#### 3. Top-Center Mini-Table
- When ≥20 bars have elapsed, shows the date at 20 bars ago and the average BBP across the full 20-bar window.
#### 4. Normalized RSI Line
- Rescales the classic 14-period RSI into a –20…+20 band to align with BBP.
#### 5. MACD Lines (Hidden) & Composite Histogram
- MACD and signal lines are calculated but not plotted by default.
- A “Weighted BBP” histogram combines:
- 20% normalized RSI,
- 20% average of (MACD + signal + normalized BBP),
- 60% normalized BBP
- Plotted as columns, color-coded by strength using the same palette as the main bars.
#### 6. Middle Reference Line
- A horizontal zero line to anchor over/under-zero readings.
---
### How to Use It
- **Trend confirmation**: Strong blue/green bars alongside a rising histogram suggest bull conviction; strong reds/magentas signal bear dominance.
- **Divergence spotting**: Watch for price making new highs/lows while BBP or the histogram fails to follow.
- **Quartal analysis**: The 5-bar group averages can reveal whether recent momentum is accelerating or waning.
- **Cross-indicator weighting**: Because RSI, MACD, and raw BBP all feed into the final histogram, you get a smoothed, blended view of momentum shifts.
---
**Tip:** Tweak the EMA and normalization length to suit your preferred timeframe (e.g. shorter for intraday scalps, longer for swing trades). Enable/disable the table if you prefer a cleaner pane.

Rate of Change HistogramExplanation of Modifications
Converting ROC to Histogram:
Original ROC: The ROC is calculated as roc = 100 * (source - source ) / source , plotted as a line oscillating around zero.
Modification: Instead of plotting roc as a line, it’s now plotted as a histogram using style=plot.style_columns. This makes the ROC values visually resemble the MACD histogram, with bars extending above or below the zero line based on momentum.
Applying MACD’s Four-Color Scheme:
Logic: The histogram’s color is determined by:
Above Zero (roc >= 0): Bright green (#26A69A) if ROC is rising (roc > roc ), light green (#B2DFDB) if falling (roc < roc ).
Below Zero (roc < 0): Bright red (#FF5252) if ROC is falling (roc < roc ), light red (#FFCDD2) if rising (roc > roc ).
Implementation: Used the exact color logic and hex codes from the MACD code, applied to the ROC histogram. This highlights momentum ebbs (falling ROC, fading waves) and flows (rising ROC, strengthening waves).
Removing Signal Line:
Unlike the previous attempt, no signal line is added. The histogram is purely the ROC value, ensuring it directly reflects price change momentum without additional smoothing, making it faster and more responsive to pulse waves, as you indicated ROC performs better than other oscillators.
Alert Conditions:
Added alerts to match the MACD’s logic, triggering when the ROC histogram crosses the zero line:
Rising to Falling: When roc >= 0 and roc < 0, signaling a potential wave peak (e.g., end of Wave 3 or C).
Falling to Rising: When roc <= 0 and roc > 0, indicating a potential wave bottom (e.g., start of Wave 1 or rebound).
These alerts help identify transitions in 3-4 wave pulse patterns.
Plotting:
Histogram: Plotted as columns (plot.style_columns) with the four-color scheme, directly representing ROC momentum.
Zero Line: Kept the gray zero line (#787B86) for reference, consistent with the MACD.
Removed ROC Line/Signal Line: Since you want the ROC to act as the histogram itself, no additional lines are plotted.
Inputs:
Retained the original length (default 9) and source (default close) inputs for consistency.
Removed signal-related inputs (e.g., signal_length, sma_signal) as they’re not needed for a pure ROC histogram.
How This ROC Histogram Works for Wave Pulses
Wave Alignment:
Above Zero (Bullish Momentum): Positive ROC bars indicate flows (e.g., impulse Waves 1, 3, or rebounds in Wave B/C). Bright green bars show accelerating momentum (strong pulses), while light green bars suggest fading momentum (potential wave tops).
Below Zero (Bearish Momentum): Negative ROC bars indicate ebbs (e.g., corrective Waves 2, 4, A, or C). Bright red bars show increasing bearish momentum (strong pullbacks), while light red bars suggest slowing declines (potential wave bottoms).
3-4 Wave Pulses:
In a 3-wave A-B-C correction: Wave A (down) shows bright red bars (falling ROC), Wave B (up) shows bright/light green bars (rising ROC), and Wave C (down) shifts back to red bars.
In a 4-wave consolidation: Alternating green/red bars highlight the rhythmic ebbs and flows as momentum oscillates.
Timing:
Zero-line crossovers mark wave transitions (e.g., from Wave 2 to Wave 3).
Color changes (e.g., bright to light green) signal momentum shifts within waves, helping identify pulse peaks/troughs.
Advantages Over MACD:
The ROC histogram is more responsive than the MACD histogram because ROC directly measures price change percentage, while MACD relies on moving average differences, which introduce lag. This makes the ROC histogram better for capturing rapid 3-4 wave pulses, as you noted.
Example Usage
For a stock with 3-4 wave pulses on a 5-minute chart:
Wave 1 (Flow): ROC rises above zero, histogram turns bright green (rising momentum), indicating a strong bullish pulse.
Wave 2 (Ebb): ROC falls below zero, histogram shifts to bright red (falling momentum), signaling a corrective pullback.
Wave 3 (Flow): ROC crosses back above zero, histogram becomes bright green again, confirming a powerful pulse.
Wave 4 (Ebb): ROC dips slightly, histogram turns light green (falling momentum above zero) or light red (rising momentum below zero), indicating consolidation.
Alerts trigger on zero-line crosses (e.g., from Wave 2 to Wave 3), helping time trades.
Settings Recommendations
Default (length=9): Works well for most time frames, balancing sensitivity and smoothness.
Intraday Pulses: Use length=5 or length=7 for faster signals on 5-minute or 15-minute charts.
Daily Charts: Try length=12 or length=14 for broader wave cycles.
Testing: Apply to a stock with clear wave patterns (e.g., tech stocks like AAPL or TSLA) and adjust length to match the pulse frequency you observe.
Notes
Confirmation: Pair the ROC histogram with price action (e.g., Fibonacci retracements, support/resistance) to validate wave counts, as momentum oscillators can be noisy in choppy markets.
Divergences: Watch for divergences (e.g., price makes a higher high, but ROC histogram bars are lower) to spot wave reversals, especially at Wave 3 or C ends.
Comparison to MACD: The ROC histogram is faster and more direct, making it ideal for short-term pulse waves, but it may be more volatile, so use with technical levels for precision.

Williams R Zone Scalper v1.0[BullByte]Originality & Usefulness
Unlike standard Williams R cross-over scripts, this strategy layers five dynamic filters—moving-average trend, Supertrend, Choppiness Index, Bollinger Band Width, and volume validation —and presents a real-time dashboard with equity, PnL, filter status, and key indicator values. No other public Pine script combines these elements with toggleable filters and a custom dashboard. In backtests (BTC/USD (Binance), 5 min, 24 Mar 2025 → 28 Apr 2025), adding these filters turned a –2.09 % standalone Williams R into a +5.05 % net winner while cutting maximum drawdown in half.
---
What This Script Does
- Monitors Williams R (length 14) for overbought/oversold reversals.
- Applies up to five dynamic filters to confirm trend strength and volatility direction:
- Moving average (SMA/EMA/WMA/HMA)
- Supertrend line
- Choppiness Index (CI)
- Bollinger Band Width (BBW)
- Volume vs. its 50-period MA
- Plots blue arrows for Long entries (R crosses above –80 + all filters green) and red arrows for Short entries (R crosses below –20 + all filters green).
- Optionally sets dynamic ATR-based stop-loss (1.5×ATR) and take-profit (2×ATR).
- Shows a dashboard box with current position, equity, PnL, filter status, and real-time Williams R / MA/volume values.
---
Backtest Summary (BTC/USD(Binance), 5 min, 24 Mar 2025 → 28 Apr 2025)
• Total P&L : +50.70 USD (+5.05 %)
• Max Drawdown : 31.93 USD (3.11 %)
• Total Trades : 198
• Win Rate : 55.05 % (109/89)
• Profit Factor : 1.288
• Commission : 0.01 % per trade
• Slippage : 0 ticks
Even in choppy March–April, this multi-filter approach nets +5 % with a robust risk profile, compared to –2.09 % and higher drawdown for Williams R alone.
---
Williams R Alone vs. Multi-Filter Version
• Total P&L :
– Williams R alone → –20.83 USD (–2.09 %)
– Multi-Filter → +50.70 USD (+5.05 %)
• Max Drawdown :
– Williams R alone → 62.13 USD (6.00 %)
– Multi-Filter → 31.93 USD (3.11 %)
• Total Trades : 543 vs. 198
• Win Rate : 60.22 % vs. 55.05 %
• Profit Factor : 0.943 vs. 1.288
---
Inputs & What They Control
- wrLen (14): Williams R look-back
- maType (EMA): Trend filter type (SMA, EMA, WMA, HMA)
- maLen (20): Moving-average period
- useChop (true): Toggle Choppiness Index filter
- ciLen (12): CI look-back length
- chopThr (38.2): CI threshold (below = trending)
- useVol (true): Toggle volume-above-average filter
- volMaLen (50): Volume MA period
- useBBW (false): Toggle Bollinger Band Width filter
- bbwMaLen (50): BBW MA period
- useST (false): Toggle Supertrend filter
- stAtrLen (10): Supertrend ATR length
- stFactor (3.0): Supertrend multiplier
- useSL (false): Toggle ATR-based SL/TP
- atrLen (14): ATR period for SL/TP
- slMult (1.5): SL = slMult × ATR
- tpMult (2.0): TP = tpMult × ATR
---
How to Read the Chart
- Blue arrow (Long): Williams R crosses above –80 + all enabled filters green
- Red arrow (Short) : Williams R crosses below –20 + all filters green
- Dashboard box:
- Top : position and equity
- Next : cumulative PnL in USD & %
- Middle : green/white dots for each filter (green=passing, white=disabled)
- Bottom : Williams R, MA, and volume current values
---
Usage Tips
- Add the script : Indicators → My Scripts → Williams R Zone Scalper v1.0 → Add to BTC/USD chart on 5 min.
- Defaults : Optimized for BTC/USD.
- Forex majors : Raise `chopThr` to ~42.
- Stocks/high-beta : Enable `useBBW`.
- Enable SL/TP : Toggle `useSL`; stop-loss = 1.5×ATR, take-profit = 2×ATR apply automatically.
---
Common Questions
- * Why not trade every Williams R reversal?*
Raw Williams R whipsaws in sideways markets. Choppiness and volume filters reduce false entries.
- *Can I use on 1 min or 15 min?*
Yes—adjust ATR length or thresholds accordingly. Defaults target 5 min scalping.
- *What if all filters are on?*
Fewer arrows, higher-quality signals. Expect ~10 % boost in average win size.
---
Disclaimer & License
Trading carries risk of loss. Use this script “as is” under the Mozilla Public License 2.0 (mozilla.org). Always backtest, paper-trade, and adjust risk settings to your own profile.
---
Credits & References
- Pine Script v6, using TradingView’s built-in `ta.supertrend()`.
- TradingView House Rules: www.tradingview.com
Goodluck!
BullByte

Smart Breakout with ATR Stop-LossThe Smart Breakout indicator combines a classic 20-day Donchian channel breakout with a tight trailing stop, drawing green lines and “ENTRY” labels at the bar after a valid breakout, and red lines and “EXIT” label at the bar after a stop-loss breach.
By default it uses the chart’s timeframe to compute ATR and stops, but you can flip on Daily lock to freeze both ATR and price reads at the daily resolution—so your stops stay the same whether you view at 1s, 15 m, 4h or lower frequency bars.
Key features:
20-day Donchian breakout: entry when price closes above the highest high of the previous 20 bars
2 × ATR(14) trailing stop: initialized at entry and raised only when the new (close – 2 × ATR) exceeds the prior stop
Daily lock option: Ensures all ATR and close values are calculated on the daily timeframe, keeping stop levels consistent across resolutions

Overnight ES Strategy: CBC + Fractal + RSI + ATR FilterThis script is designed for overnight trading of the E-mini S&P 500 futures (ES) between 6 PM and 11 PM EST.
It combines multiple technical confluences to generate high-probability buy and sell signals, focusing on volatility-rich, low-liquidity evening sessions.
Key Features:
Candle Body Confluence (CBC) Approximation:
Identifies candles with small real bodies compared to total range, simulating consolidation zones where price is likely to reverse.
Williams Fractal Confirmation:
Detects local tops and bottoms based on 5-bar fractal reversal patterns, helping validate breakout or reversal points.
RSI Filter:
Ensures momentum is supportive — buys only when RSI < 35 (oversold) and sells only when RSI > 65 (overbought).
ATR Volatility Filter:
Trades are only allowed if the Average True Range (ATR) exceeds a user-defined threshold, filtering out low-volatility, risky environments.
Time Session Control:
Signals are only generated during the user-defined evening session (default: 6 PM to 11 PM EST) to match market behavior.
Real-Time Alerts Enabled:
Alerts can be set for BUY or SELL conditions, enabling mobile notifications, emails, or pop-ups without constant chart monitoring.
Recommended Settings:
Chart Timeframe: 15-minute or 30-minute candles
Assets: ES Mini (ES1!), NQ Mini, or other CME futures
Session: New York Time (EST)
ATR Threshold: Adjust based on market conditions; 5.0 suggested starting point for ES Mini on 15m.
Important:
This script only plots signals, it does not auto-execute trades.
Always backtest and paper trade before using live capital.
Volatility can vary; consider adjusting RSI and ATR filters based on market environment.
Credits:
Script designed based on confluence of price action, momentum, reversal structure, and volatility filtering principles used by professional traders.
Inspired by Candle Body Confluence (CBC) theory and Williams fractal techniques.

Liquidity Trap Reversal Pro (Radar v2)Liquidity Trap Reversal Pro (Radar v2) is a non-repainting indicator designed to detect hidden liquidity traps at key swing highs and lows. It combines wick analysis, volume spike detection, and optional trend and exhaustion filters to identify high-probability reversal setups.
🔷 Features:
Non-Repainting: Pivots confirmed after lookback period, no future leaking.
Volume Spike Detection: Filters traps that occur during major liquidity events.
EMA Trend Filter (Optional): Focus on traps aligned with the prevailing trend.
Higher Timeframe Trend Filter (Optional): Confirm traps using a higher timeframe EMA bias.
Exhaustion Guard (Optional): Prevents traps after overextended moves based on ATR stretch.
Clean Visuals: Distinct plots for raw trap points vs confirmed traps.
Alerts Included: Set alerts for confirmed high/low liquidity traps.
📚 How to Use:
Watch for Trap Signals:
A Trap High signal suggests a potential bearish reversal.
A Trap Low signal suggests a potential bullish reversal.
Use Confirmed Signals for Best Entries:
Confirmed traps fire only after price moves opposite to the trap direction, adding reliability.
Use Trend Filters to Improve Accuracy:
In an uptrend (price above EMA), prefer Trap Lows (buy setups).
In a downtrend (price below EMA), prefer Trap Highs (sell setups).
Use the Exhaustion Guard to Avoid Bad Trades:
This filter blocks signals when price has moved too far from trend, helping avoid late entries.
Recommended Settings:
Best used on 15-minute, 1-hour, or 4-hour charts.
Trend filter ON for trending markets.
Exhaustion guard ON for volatile or stretched markets.
📈 Important Notes:
This script does not repaint once a pivot is confirmed.
Alerts trigger only on confirmed trap signals.
Always combine signals with sound risk management and trading strategy.
Disclaimer:
This script is for educational purposes only. It is not investment advice or a guarantee of results. Always do your own research before trading.

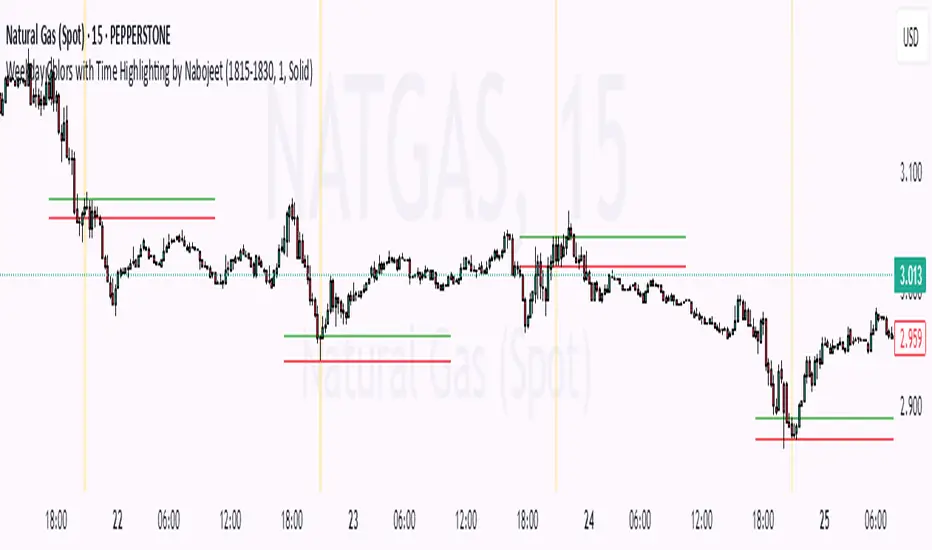
Weekday Colors with Time Highlighting by NabojeetThis script is a Pine Script (version 6) indicator called "Weekday Colors with Time Highlighting" designed for TradingView charts. It has several key functions:
1. **Weekday Color Coding**:
- Assigns different background colors to each trading day (Monday through Friday)
- Allows users to customize the color for each day
- Includes toggles to enable/disable colors for specific days
2. **Time Range Highlighting**:
- Highlights a specific time period (e.g., 18:15-18:30) on every trading day
- Uses a custom color that can be adjusted by the user
- The time range is specified in HHMM-HHMM format
3. **High/Low Line Drawing**:
- Automatically identifies the highest high and lowest low points within the specified time range
- Draws horizontal lines at these levels when the time period ends
- Lines extend forward in time to serve as support/resistance references
- Users can customize the line color, width, and style (solid, dotted, or dashed)
The script is organized into logical sections with input parameters grouped by function (Weekday Colors, Weekday Display, Time Highlighting, and Horizontal Lines). Each section's inputs are customizable through the indicator settings panel.
This indicator would be particularly useful for traders who:
- Want visual distinction between different trading days
- Focus on specific time periods each day (like market opens, closes, or specific sessions)
- Use intraday support/resistance levels from key time periods
- Want to quickly identify session highs and lows
The implementation resets tracking variables at the beginning of each new time range and draws the lines once the time period ends, ensuring accurate high/low marking for each day's specified time window.
Author - Nabojeet
Crypto EMA TableCrypto EMA Trend Scanner
A powerful tool for crypto traders to quickly identify trend strength across multiple timeframes
This indicator helps you spot potential trading opportunities by analyzing the EMA (Exponential Moving Average) alignment across four different timeframes. It displays a clean, color-coded table showing which cryptocurrencies are in a strong uptrend.
Key Features:
Multi-Timeframe Analysis: Simultaneously scan 3-minute, 15-minute, 1-hour, and 4-hour charts
Clear Visual Signals: Green cells indicate bullish EMA alignment (EMA 20 > EMA 50 > EMA 200)
Customizable Symbols: Track up to 3 different cryptocurrencies of your choice
Exchange Selection: Compatible with major exchanges (Bybit, Binance, Coinbase, Kraken, KuCoin, FTX)
Flexible Positioning: Place the table anywhere on your chart
How to Use:
Add the indicator to your chart
Select your preferred cryptocurrencies in the settings
Position the table where you want it
Look for green cells indicating EMA lineup.
Use this information to identify potential entry points or confirm your trading bias

Machine Learning | Adaptive Trend Signals [Bitwardex]⚙️🧠Machine Learning | Adaptive Trend Signals
🔷Overview
Machine Learning | Adaptive Trend Signals is a Pine Script™ v6 indicator designed to visualize market trends and generate signals through a combination of volatility clustering, Gaussian smoothing, and adaptive trend calculations. Built as an overlay indicator, it integrates advanced techniques inspired by machine learning concepts, such as K-Means clustering, to adapt to changing market conditions. The script is highly customizable, includes a backtesting module, and supports alert conditions, making it suitable for traders exploring trend-based strategies and developers studying volatility-driven indicator design.
🔷Functionality
The indicator performs the following core functions:
• Volatility Clustering: Uses K-Means clustering to categorize market volatility into high, medium, and low states, adjusting trend sensitivity accordingly.
• Trend Calculation: Computes adaptive trend lines (SmartTrend) based on volatility-adjusted standard deviation, smoothed RSI, and ADX filters.
• Signal Generation: Identifies potential buy and sell points through trend line crossovers and directional confirmation.
• Backtesting Module: Tracks trade outcomes based on the SmartTrend3 value, displaying win rate and total trades.
• Visualization: Plots trend lines with gradient colors and optional signal markers (bullish 🐮 and bearish 🐻).
• Alerts: Provides configurable alerts for trend shifts and volatility state changes.
🔷Technical Methodology
Volatility Clustering with K-Means
The indicator employs a K-Means clustering algorithm to classify market volatility, measured via the Average True Range (ATR), into three distinct clusters:
• Data Collection: Gathers ATR values over a user-defined training period (default: 100 bars).
• Centroid Initialization: Sets initial centroids at the highest, lowest, and midpoint ATR values within the training period.
• Iterative Clustering: Assigns ATR data points to the nearest centroid, recalculates centroid means, and repeats until convergence.
• Dynamic Adjustment: Assigns a volatility state (high, medium, or low) based on the closest centroid, adjusting the trend factor (e.g., tighter for high volatility, wider for low volatility).
This approach allows the indicator to adapt its sensitivity to varying market conditions, providing a data-driven foundation for trend calculations.
🔷Gaussian Smoothing
To enhance signal clarity and reduce noise, the indicator applies Gaussian kernel smoothing to:
• RSI: Smooths the Relative Strength Index (calculated from OHLC4) to filter short-term fluctuations.
• SmartTrend: Smooths the primary trend line for a more stable output.
The Gaussian kernel uses a sigma value derived from the user-defined smoothing length, ensuring mathematically consistent noise reduction.
🔷SmartTrend Calculation
The pineSmartTrend function is the core of the indicator, producing three trend lines:
• SmartTrend: The primary trend line, calculated using a volatility-adjusted standard deviation, smoothed RSI, and ADX conditions.
• SmartTrend2: A secondary trend line with a wider factor (base factor * 1.382) for signal confirmation.
SmartTrend3: The average of SmartTrend and SmartTrend2, used for plotting and backtesting.
Key components of the calculation include:
• Dynamic Standard Deviation: Scales based on ATR relative to its 50-period smoothed average, with multipliers (1.0 to 1.4) applied according to volatility thresholds.
• RSI and ADX Filters: Requires RSI > 50 for bullish trends or < 50 for bearish trends, alongside ADX > 15 and rising to confirm trend strength.
Volatility-Adjusted Bands: Constructs upper and lower bands around price action, adjusted by the volatility cluster’s dynamic factor.
🔷Signal Generation
The generate_signals function generates signals as follows:
• Buy Signal: Triggered when SmartTrend crosses above SmartTrend2 and the price is above SmartTrend, with directional confirmation.
• Sell Signal: Triggered when SmartTrend crosses below SmartTrend2 and the price is below SmartTrend, with directional confirmation.
Directional Logic: Tracks trend direction to filter out conflicting signals, ensuring alignment with the broader market context.
Signals are visualized as small circles with bullish (🐮) or bearish (🐻) emojis, with an option to toggle visibility.
🔷Backtesting
The get_backtest function evaluates signal outcomes using the SmartTrend3 value (rather than closing prices) to align with the trend-based methodology.
It tracks:
• Total Trades: Counts completed long and short trades.
• Win Rate: Calculates the percentage of trades where SmartTrend3 moves favorably (higher for longs, lower for shorts).
Position Management: Closes opposite positions before opening new ones, simulating a single-position trading system.
Results are displayed in a table at the top-right of the chart, showing win rate and total trades. Note that backtest results reflect the indicator’s internal logic and should not be interpreted as predictive of real-world performance.
🔷Visualization and Alerts
• Trend Lines: SmartTrend3 is plotted with gradient colors reflecting trend direction and volatility cluster, accompanied by a secondary line for visual clarity.
• Signal Markers: Optional buy/sell signals are plotted as small circles with customizable colors.
• Alerts: Supports alerts for:
• Bullish and bearish trend shifts (confirmed on bar close).
Transitions to high, medium, or low volatility states.
🔷Input Parameters
• ATR Length (default: 14): Period for ATR calculation, used in volatility clustering.
• Period (default: 21): Common period for RSI, ADX, and standard deviation calculations.
• Base SmartTrend Factor (default: 2.0): Base multiplier for volatility-adjusted bands.
• SmartTrend Smoothing Length (default: 10): Length for Gaussian smoothing of the trend line.
• Show Buy/Sell Signals? (default: true): Enables/disables signal markers.
• Bullish/Bearish Color: Customizable colors for trend lines and signals.
🔷Usage Instructions
• Apply to Chart: Add the indicator to any TradingView chart.
• Configure Inputs: Adjust parameters to align with your trading style or market conditions (e.g., shorter ATR length for faster markets).
• Interpret Output:
• Trend Lines: Use SmartTrend3’s direction and color to gauge market bias.
• Signals: Monitor bullish (🐮) and bearish (🐻) markers for potential entry/exit points.
• Backtest Table: Review win rate and total trades to understand the indicator’s behavior in historical data.
• Set Alerts: Configure alerts for trend shifts or volatility changes to support manual or automated trading workflows.
• Combine with Analysis: Use the indicator alongside other tools or market context, as it is designed to complement, not replace, comprehensive analysis.
🔷Technical Notes
• Data Requirements: Requires at least 100 bars for accurate volatility clustering. Ensure sufficient historical data is loaded.
• Market Suitability: The indicator is designed for trend detection and may perform differently in ranging or volatile markets due to its reliance on RSI and ADX filters.
• Backtesting Scope: The backtest module uses SmartTrend3 values, which may differ from price-based outcomes. Results are for informational purposes only.
• Computational Intensity: The K-Means clustering and Gaussian smoothing may increase processing time on lower timeframes or with large datasets.
🔷For Developers
The script is modular, well-commented, encouraging reuse and modification with proper attribution.
Key functions include:
• gaussianSmooth: Applies Gaussian kernel smoothing to any data series.
• pineSmartTrend: Computes adaptive trend lines with volatility and momentum filters.
• getDynamicFactor: Adjusts trend sensitivity based on volatility clusters.
• get_backtest: Evaluates signal performance using SmartTrend3.
Developers can extend these functions for custom indicators or strategies, leveraging the volatility clustering and smoothing methodologies. The K-Means implementation is particularly useful for adaptive volatility analysis.
🔷Limitations
• The indicator is not predictive and should be used as part of a broader trading strategy.
• Performance varies by market, timeframe, and parameter settings, requiring user experimentation.
• Backtest results are based on historical data and internal logic, not real-world trading conditions.
• Volatility clustering assumes sufficient historical data; incomplete data may affect accuracy.
🔷Acknowledgments
Developed by Bitwardex, inspired by machine learning concepts and adaptive trading methodologies. Community feedback is welcome via TradingView’s platform.
🔷 Risk Disclaimer
Trading involves significant risks, and most traders may incur losses. Bitwardex AI Algo is provided for informational and educational purposes only and does not constitute financial advice or a recommendation to buy or sell any financial instrument . The signals, metrics, and features are tools for analysis and do not guarantee profits or specific outcomes. Past performance is not indicative of future results. Always conduct your own due diligence and consult a financial advisor before making trading decisions.

Dskyz Options Flow Flux (OFF) - FuturesDskyz Options Flow Flux (OFF) - Futures
*This is a repost due to moderator intervention on use of ™ in my scripts. I'm in the process of getting this rectified. This was originally posted around mid-night CDT.
🧠 The Dskyz Options Flow Flux (OFF) - Futures indicator is a game changer for futures traders looking to tap into institutional activity with limited resources. Designed for TradingView this tool simulates options flow data (call/put volume and open interest) for futures contracts like MNQ MES NQ and ES giving u actionable insights through volume spike detection volatility adjustments and stunning visuals like aurora flux bands and round number levels. Whether u’re a beginner learning the ropes or a pro hunting for an edge this indicator delivers real time market sentiment and key price levels to boost ur trading game
Key Features
⚡ Simulated Options Flow: Breaks down call/put volume and open interest using market momentum and volatility
📈 Spike Detection: Spots big moves in volume and open interest with customizable thresholds
🧠 Volatility Filter: Adapts to market conditions using ATR for smarter spike detection
✨ Aurora Flux Bands: Glows with market sentiment showing u bullish or bearish vibes at a glance
🎯 Round Number Levels: Marks key psychological levels where big players might step in
📊 Interactive Dashboard: Real time metrics like sentiment score and volatility factor right on ur chart
🚨 Alerts: Get notified of bullish or bearish spikes so u never miss a move
How It Works
🧠 This indicator is built to make complex options flow analysis simple even with the constraints of Pine Script. Here’s the step by step:
Simulated Volume Data (Dynamic Split):
Pulls daily volume for ur chosen futures contract (MNQ1! MES1! NQ1! ES1!)
Splits it into call and put volume based on momentum (ta.mom) and volatility (ATR vs its 20 period average)
Estimates open interest (OI) for calls and puts (1.15x for calls 1.1x for puts)
Formula: callRatio = 0.5 + (momentum / close) * 10 + (volatility - 1) * 0.1 capped between 0.3 and 0.7
Why It Matters: Mimics how big players might split their trades giving u a peek into institutional sentiment
Spike Detection:
Compares current volume/OI to short term (lookbackShort) and long term (lookbackLong) averages
Flags spikes when volume/OI exceeds the average by ur set threshold (spikeThreshold for regular highConfidenceThreshold for strong)
Adjusts for volatility so u’re not fooled by choppy markets
Output: optionsSignal (2 for strong bullish -2 for strong bearish 1 for bullish -1 for bearish 0 for neutral)
Why It Matters: Pinpoints where big money might be stepping in
Volatility Filter:
Uses ATR (10 periods) and its 20 period average to calculate a volatility factor (volFactor = ATR / avgAtr)
Scales spike thresholds based on market conditions (volAdjustedThreshold = spikeThreshold * max(1 volFactor * volFilter))
Why It Matters: Keeps ur signals reliable whether the market is calm or wild
Sentiment Score:
Calculates a call/put ratio (callVolume / putVolume) and adjusts for volatility
Converts it to a 0 to 100 score (higher = bullish lower = bearish)
Formula: sentimentScore = min(max((volAdjustedSentiment - 1) * 50 0) 100)
Why It Matters: Gives u a quick read on market bias
Round Number Detection:
Finds the nearest round number (e.g. 100 for MNQ1! 50 for MES1!)
Checks for volume spikes (volume > 3 period SMA * spikeThreshold) and if price is close (within ATR * atrMultiplier)
Updates the top activity level every 15 minutes when significant activity is detected
Why It Matters: Highlights psychological levels where price often reacts
Visuals and Dashboard:
Combines aurora flux bands glow effects round number lines and a dashboard to make insights pop (see Visual Elements below)
Plots triangles for call/put spikes (green/red for strong lime/orange for regular)
Sets up alerts for key market moves
Why It Matters: Makes complex data easy to read at a glance
Inputs and Customization
⚙️ Beginners can tweak these settings to match their trading style while pros can dig deeper for precision:
Futures Symbol (symbol): Pick ur contract (MNQ1! MES1! NQ1! ES1!). Default: MNQ1!
Short Lookback (lookbackShort): Days for short term averages. Smaller = more sensitive. Range: 1+. Default: 5
Long Lookback (lookbackLong): Days for long term averages. Range: 5+. Default: 10
Spike Threshold (spikeThreshold): How big a spike needs to be (e.g. 1.1 = 10% above average). Range: 1.0+. Default: 1.1
High Confidence Threshold (highConfidenceThreshold): For strong spikes (e.g. 3.0 = 3x average). Range: 2.0+. Default: 3.0
Volatility Filter (volFilter): Adjusts for market volatility (e.g. 1.2 = 20% stricter in volatile markets). Range: 1.0+. Default: 1.2
Aurora Flux Transparency (glowOpacity): Controls band transparency (0 = solid 100 = invisible). Range: 0 to 100. Default: 65
Show Show OFF Dashboard (showDashboard): Toggles the dashboard with key metrics. Default: true
Show Nearest Round Number (showRoundNumbers): Displays round number levels. Default: true
ATR Multiplier for Proximity (atrMultiplier): How close price needs to be to a round number (e.g. 1.5 = within 1.5x ATR). Range: 0.5+. Default: 1.5
Functions and Logic
🧠 Here’s the techy stuff pros will love:
Simulated Volume Data : Splits daily volume into call/put volume and OI using momentum and volatility
Volatility Filter: Scales thresholds with volFactor = atr / avgAtr for adaptive detection
Spike Detection: Flags spikes and assigns optionsSignal (2, -2, 1, -1, 0) for sentiment
Sentiment Score: Converts call/put ratio into a 0-100 score for quick bias reads
Round Number Detection: Identifies key levels and significant activity for trading zones
Dashboard Display: Updates real time metrics like sentiment score and volatility factor
Visual Elements
✨ These visuals make data come alive:
Gradient Background: Green (bullish) red (bearish) or yellow (neutral/choppy) at 95% transparency to show trend
Aurora Flux Bands: Stepped bands (linewidth 3) around a 14 period EMA ± ATR * 1.8. Colors shift with sentiment (green red lime orange gray) with glow effects at 85% transparency
Round Number Visualization: Stepped lines (linewidth 2) at key levels (solid if active dashed if not) with labels (black background white text size.normal)
Visual Signals: Triangles above/below bars for spikes (size.small for strong size.tiny for regular)
Dashboard: Bottom left table (2 columns 10 rows) with a black background (29% transparency) gray border and metrics:
⚡ Round Number Activity: “Detected” or “None”
📈 Trend: “Bullish” “Bearish” or “Neutral” (colored green/red/gray)
🧠 ATR: Current 10 period ATR
📊 ATR Avg: 20 period SMA of ATR
📉 Volume Spike: “YES” (green) or “NO” (red)
📋 Call/Put Ratio: Current ratio
✨ Flux Signal: “Strong Bullish” “Strong Bearish” “Bullish” “Bearish” or “Neutral” (colored green/red/gray)
⚙️ Volatility Factor: Current volFactor
📈 Sentiment Score: 0-100 score
Usage and Strategy Recommendations
🎯 For Beginners: Use high confidence spikes (green/red triangles) for easy entries. Check the dashboard for a quick market read (sentiment score above 60 = bullish below 40 = bearish). Watch round number levels for support/resistance
💡 For Pros: Combine flux signals with round number activity for high probability setups. Adjust lookbackShort/lookbackLong for trending vs choppy markets. Use volFactor for position sizing (higher = smaller positions)

Custom Opening Range - CommoditiesThe Custom Opening Range Indicator for Commodities is designed for instruments that trade nearly 24 hours, such as crude oil or natural gas. It allows traders to define the Opening Range based on Indian Standard Time (IST)—typically starting at 3:30 AM IST, which aligns with the global commodities market open. Users can customize both the start time and duration of the range (e.g., 5, 15, or 30 minutes). The indicator dynamically plots the high and low of this range and shades the area between them, providing a clear visual reference for breakout or reversal setups during the rest of the trading session.
Aggregate PDH High Break Alert**Aggregate PDH High Break Alert**
**Overview**
The “Aggregate PDH High Break Alert” is a lightweight Pine Script v6 indicator designed to instantly notify you when today’s price breaks above any prior-day high in a user-defined lookback window. Instead of manually scanning dozens of daily highs, this script automatically loops through the last _N_ days (up to 100) and fires a single-bar alert the moment price eclipses a specific day’s high.
**Key Features**
- **Dynamic Lookback**: Choose any lookback period from 1 to 100 days via a single `High-Break Lookback` input.
- **Single Security Call**: Efficiently retrieves the entire daily-high series in one call to avoid TradingView’s 40-call security limit.
- **Automatic Looping**: Internally loops through each prior-day high, so there’s no need to manually code dozens of lines.
- **Custom Alerts**: Generates a clear, formatted alert message—e.g. “Crossed high from 7 day(s) ago”—for each breakout.
- **Lightweight & Maintainable**: Compact codebase (<15 lines) makes tweaking and debugging a breeze.
**Inputs**
- **High-Break Lookback (days)**: Number of past days to monitor for high breaks. Valid range: 1–100.
**How to Use**
1. **Add to Chart**: Open TradingView, click “Indicators,” then “Create,” and paste in the code.
2. **Configure Lookback**: In the script’s settings, set your desired lookback window (e.g., 20 for the past 20 days).
3. **Enable Alerts**: Right-click the indicator’s name on your chart, select “Add Alert on Aggregate PDH High Break Alert,” and choose “Once per bar close.”
4. **Receive Notifications**: Whenever price crosses above any of the specified prior-day highs, you’ll get an on-screen and/or mobile push alert with the exact number of days ago.
**Use Cases**
- **Trend Confirmation**: Confirm fresh bullish momentum when today’s high outpaces any of the last _N_ days.
- **Breakout Trading**: Automate entries off multi-day highs without manual chart scanning.
- **System Integration**: Integrate with alerts to trigger orders in third-party bots or webhook receivers.
**Disclaimer**
Breakouts alone do not guarantee sustained moves. Combine with your preferred risk management, volume filters, and other indicators for higher-probability setups. Use on markets and timeframes where daily breakout behavior aligns with your strategy.

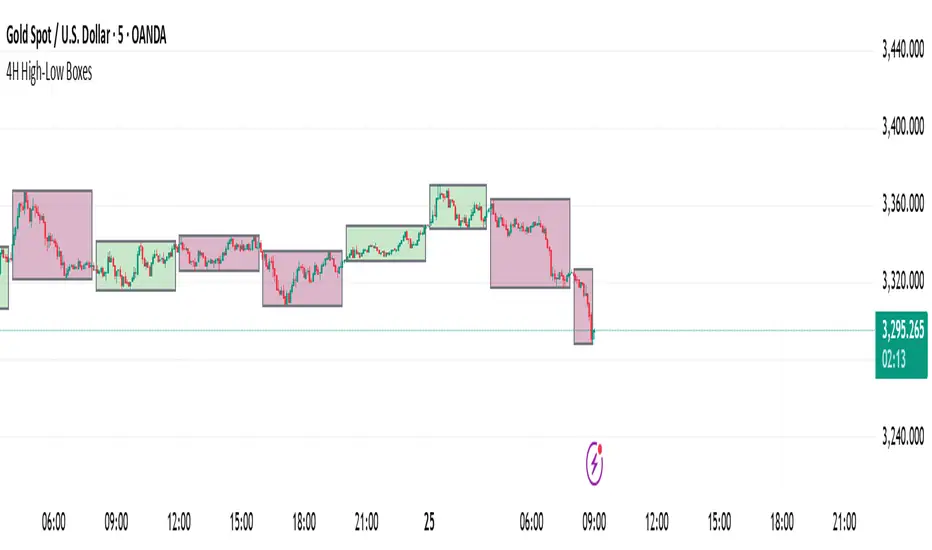
4H High-Low BoxesThis indicator dynamically plots high-low boxes based on the most recent 4-hour candle, providing visual markers for key price levels and trends. The box is updated in real-time to reflect the highest and lowest points of the current 4-hour candle, and its color changes based on the market's direction.
Key Features:
Dynamic Boxes: The indicator automatically adjusts to the 4-hour candle's high, low, and open price, creating a box that updates with price action.
Color-Coding: The box color changes based on the price direction. A green box indicates bullish market sentiment (price is above the 4H open), while a red box indicates bearish sentiment (price is below the 4H open).
Accurate Timeframe Representation: It works across any intraday timeframe (e.g., 5-minute, 15-minute, 1-hour), providing consistent, visually relevant markers for trading decisions.
Real-Time Updates: The box is adjusted dynamically as price evolves, ensuring it accurately represents the 4-hour price range during live trading.
Customizable Settings: Tailor the visual aspects of the box, including border color, background transparency, and other parameters.
Trading Strategy Ideas:
Rejection at High/Low: Look for price rejection at the 4H high/low for potential reversal signals.
Breakout Strategy: Trade breakouts above the 4H high or below the 4H low for momentum trades.
Mean Reversion: Enter when price moves away from the 4H open, expecting it to return to the open price.
This indicator can be used as a standalone tool or combined with other technical indicators to improve entry and exit points. Perfect for swing traders and those using price action to identify key support and resistance levels.
HAPPY TRADING
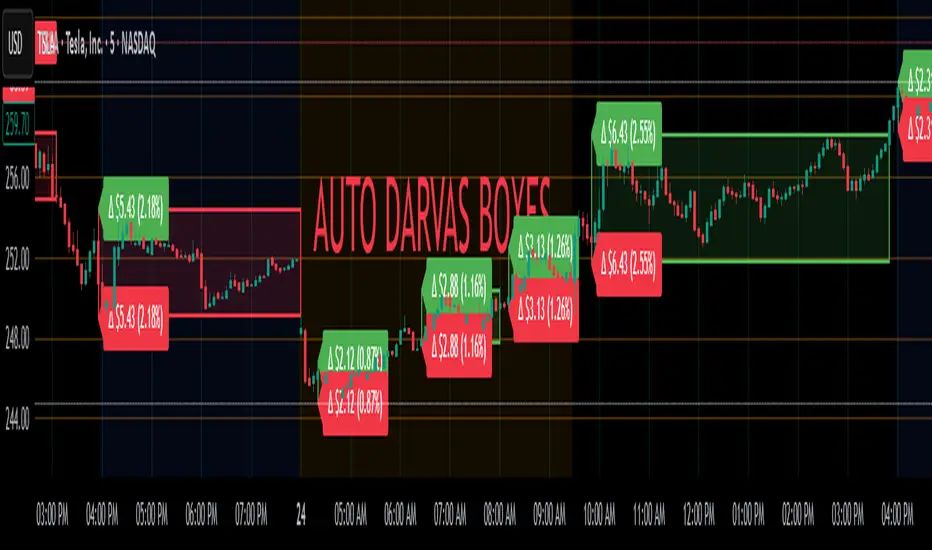
Auto Darvas Boxes## AUTO DARVAS BOXES
---
### OVERVIEW
**Auto Darvas Boxes** is a fully-automated, event-driven implementation of Nicolas Darvas’s 1950s box methodology.
The script tracks consolidation zones in real time, verifies that price truly “respects” those zones for a fixed validation window, then waits for the first decisive range violation to mark a directional breakout.
Every box is plotted end-to-end—from the first candle of the sideways range to the exact candle that ruptures it—giving you an on-chart, visually precise record of accumulation or distribution and the expansion that follows.
---
### HISTORICAL BACKGROUND
* Nicolas Darvas was a professional ballroom dancer who traded U.S. equities by telegram while touring the world.
* Without live news or Level II, he relied exclusively on **price** to infer institutional intent.
* His core insight: true market-moving entities leave footprints in the form of tight ranges; once their buying (or selling) is complete, price erupts out of the “box.”
* Darvas’s original procedure was manual—he kept notebooks, drew rectangles around highs and lows, and entered only when price punched out of the roof of a valid box.
* This indicator distills that logic into a rolling, self-resetting state machine so you never miss a box or breakout on any timeframe.
---
### ALGORITHM DETAIL (FOUR-STATE MACHINE)
**STATE 0 – RANGE DEFINITION**
• Examine the last *N* candles (default 7).
• Record `rangeHigh = highest(high, N) + tolerance`.
• Record `rangeLow = lowest(low, N) – tolerance`.
• Remember the index of the earliest bar in this window (`startBar`).
• Immediately transition to STATE 1.
**STATE 1 – RANGE VALIDATION**
• Observe the next *N* candles (again default 7).
• If **any** candle prints `high > rangeHigh` or `low < rangeLow`, the validation fails and the engine resets to STATE 0 **beginning at the violating candle**—no halfway boxes, no overlap.
• If all *N* candles remain inside the range, the box becomes **armed** and we transition to STATE 2.
**STATE 2 – ARMED (LIVE VISUAL FEEDBACK)**
• Draw a **green horizontal line** at `rangeHigh`.
• Draw a **red horizontal line** at `rangeLow`.
• Lines are extended in real time so the user can see the “live” Darvas ceiling and floor.
• Engine waits indefinitely for a breakout candle:
– **Up-Breakout** if `high > rangeHigh`.
– **Down-Breakout** if `low < rangeLow`.
**STATE 3 – BREAKOUT & COOLDOWN**
• Upon breakout the script:
1. Deletes the live range lines.
2. Draws a **filled rectangle (box)** from `startBar` to the breakout bar.
◦ **Green fill** when price exits above the ceiling.
◦ **Red fill** when price exits below the floor.
3. Optionally prints two labels at the left edge of the box:
◦ Dollar distance = `rangeHigh − rangeLow`.
◦ Percentage distance = `(rangeHigh − rangeLow) / rangeLow × 100 %`.
• After painting, the script waits a **user-defined cooldown** (default = 7 bars) before reverting to STATE 0. The cooldown guarantees separation between consecutive tests and prevents overlapping rectangles.
---
### INPUT PARAMETERS (ALL ADJUSTABLE FROM THE SETTINGS PANEL)
* **BARS TO DEFINE RANGE** – Number of candles used for both the definition and validation windows. Classic Darvas logic uses 7 but feel free to raise it on higher timeframes or volatile instruments.
* **OPTIONAL TOLERANCE** – Absolute price buffer added above the ceiling and below the floor. Use a small tolerance to ignore single-tick spikes or data-feed noise.
* **COOLDOWN BARS AFTER BREAKOUT** – How long the engine pauses before hunting for the next consolidation. Setting this equal to the range length produces non-overlapping, evenly spaced boxes.
* **SHOW BOX DISTANCE LABELS** – Toggle on/off. When on, each completed box displays its vertical size in both dollars and percentage, anchored at the box’s left edge.
---
### REAL-TIME VISUALISATION
* During the **armed** phase you see two extended, colour-coded guide-lines showing the exact high/low that must hold.
* When the breakout finally occurs, those lines vanish and the rectangle instantly appears, coloured to match the breakout direction.
* This immediate visual feedback turns any chart into a live Darvas tape—no manual drawing, no lag.
---
### PRACTICAL USE-CASES & BEST-PRACTICE WORKFLOWS
* **INTRADAY MOMENTUM** – Drop the script on 1- to 15-minute charts to catch tight coils before they explode. The coloured box marks the precise origin of the expansion; stops can sit just inside the opposite side of the box.
* **SWING & POSITION TRADING** – On 4-hour or daily charts, boxes often correspond to accumulation bases or volatility squeezes. Waiting for the box-validated breakout filters many false signals.
* **MEAN-REVERSION OR “FADE” STRATEGIES** – If a breakout immediately fails and price re-enters the box, you may have trapped momentum traders; fading that failure can be lucrative.
* **RISK MANAGEMENT** – Box extremes provide objective, structure-based stop levels rather than arbitrary ATR multiples.
* **BACK-TEST RESEARCH** – Because each box is plotted from first range candle to breakout candle, you can programmatically measure hold time, range height, and post-breakout expectancy for any asset.
---
### CUSTOMISATION IDEAS FOR POWER USERS
* **VOLATILITY-ADAPTIVE WINDOW** – Replace the fixed 7-bar length with a dynamic value tied to ATR percentile so the consolidation window stretches or compresses with volatility.
* **MULTI-TIMEFRAME LOGIC** – Only arm a 5-minute box if the 1-hour trend is aligned.
* **STRATEGY WRAPPER** – Convert the indicator to a full `strategy{}` script, automate entries on breakouts, and benchmark performance across assets.
* **ALERTS** – Create TradingView alerts on both up-breakout and down-breakout conditions; route them to webhook for broker automation.
---
### FINAL THOUGHTS
**Auto Darvas Boxes** packages one of the market’s oldest yet still potent price-action frameworks into a modern, self-resetting indicator. Whether you trade equities, futures, crypto, or forex, the script highlights genuine contraction-expansion sequences—Darvas’s original “boxes”—with zero manual effort, letting you focus solely on execution and risk.
Price Map Profile [BigBeluga]An advanced volume-based tool designed to map out how trading activity is distributed across price levels. It combines dynamic volume profiling with structural pivot detection to highlight key levels of interest in the market — including hidden support/resistance zones and dominant liquidity areas.
Unlike traditional volume profiles locked to fixed sessions, this indicator continuously processes historical bars to build a real-time "map" of volume distribution. It intelligently reveals where buyers and sellers were most active, helping traders pinpoint high-impact zones with clarity.
🔵 KEY FEATURES
Creates a volume map profile by scanning price action over a defined lookback window (`length`).
Divides price vertically into volume bins (default: 100) and aggregates either total volume or bar count per bin.
Bins are plotted as horizontal zones extending to the right of the chart — wider offset means more volume at that price.
Each zone is color-coded using gradients to represent volume magnitude:
- Below average volume = cool tones (blue/teal)
- Above average volume = warm tones (red/orange)
The highest volume bin is highlighted with a red label showing the exact volume, helping to identify strong price agreement.
Detects pivot highs and lows using a 15-bar swing method, marking them as potential S/R levels.
If a pivot level is located inside a low-volume zone (volume < average), it is emphasized with a dashed line and label .
Pivot line color matches direction:
- High pivots = yellow
- Low pivots = aqua
The volume of the bin containing the pivot is shown alongside the pivot, providing volume context for the structural level.
Filters out nearby duplicate pivots using ATR-based distance checks to ensure clean and non-redundant signals.
🔵 HOW TO USE
Use the wide red zones as liquidity and consolidation areas where price may stall, reverse, or absorb volume.
Pivot-based dashed lines within low-volume zones highlight hidden support/resistance levels where price may react sharply.
Combine this indicator with trend or order flow tools to validate reversal or breakout setups .
Switch between Volume and Frequency modes to adapt to the type of data your asset provides.
🔵 CONCLUSION
The Price Map Profile transforms raw volume into an actionable visual map. By aligning volume depth with key market structure levels, it helps traders identify where market participants are most active — and where hidden inefficiencies lie. Ideal for traders seeking precision entries, dynamic S/R zones, and deeper volume structure insight.

[blackcat] L3 Trend BoxOVERVIEW
The L3 Trend Box indicator is a sophisticated technical analysis tool designed to assist traders in identifying trends and pinpointing potential entry and exit points within the market. By leveraging multiple moving averages and price level analyses, this indicator provides a detailed view of market dynamics. It plots several key lines and labels directly onto the chart, offering clear visual signals for both bullish and bearish scenarios. Its adaptability through customizable parameters makes it suitable for various trading strategies and market conditions 📊✅.
FEATURES
Comprehensive Parameter Customization: Tailor the indicator to match specific trading preferences:
High Length: Defines the period over which the highest prices are considered.
Low Length: Specifies the period for evaluating the lowest prices.
Upper Box Length: Smoothes out the upper boundary of the trend box using a specified period.
Lower Box Length: Smoothes out the lower boundary of the trend box similarly.
Trend Line Length: Determines the period for calculating the overall trend line.
Fast EMA Length: Sets the period for the fast-moving exponential moving average (EMA), crucial for capturing short-term movements.
MA15 EMA Length: Configures the period for the medium-term moving average (MA15 EMA) to provide a balanced perspective.
Short Spirit Length: Influences how quickly the indicator responds to recent price changes.
Golden EMA Length: Fine-tunes the long-term EMA for stability and reliability.
Buy Price Length: Establishes the lookback period for determining optimal buy prices.
Var1 Length & Var2 Length: Adjusts periods for variance calculations, enhancing the accuracy of trend detection.
Detailed Chart Plots:
Upper Box Top: A fuchsia-colored line representing the smoothed highest prices, marking resistance levels.
Lower Box Bottom: A green-colored line showing the smoothed lowest prices, highlighting support zones.
MA15 Up/Down: Dynamic red and green lines illustrating the directionality of the 15-period EMA, helping gauge momentum shifts.
Conditional Plots: Multiple lines based on intricate price actions and computed values, such as closing below the lower box while also closing at or above/below the opening price, ensuring nuanced insights into market behavior.
Buy/Sell Labels: Clearly marked 'Buy' and 'Sell' labels positioned strategically on the chart, facilitating quick decision-making without missing critical signals 🎯.
Alert System: Automatically generates alerts based on predefined buy and sell conditions, enabling timely responses to market changes 🛎️.
HOW TO USE
Adding the Indicator: Start by adding the L3 Trend Box to your TradingView chart via the indicators menu.
Parameter Configuration: Adjust each parameter according to your trading style and market volatility. For instance, increasing the High Length can make the indicator less sensitive to minor fluctuations but more responsive to significant trends.
Monitoring Signals: Keep an eye on the plotted lines and labels. Pay special attention to the crossover events between the fast EMA and the lower box bottom, as these often signify strong buy signals.
Setting Alerts: Configure alerts based on the buy/sell conditions provided by the indicator. This ensures you never miss an opportunity due to inattention.
Combining Strategies: While powerful on its own, combining this indicator with others like RSI or Bollinger Bands can enhance its predictive power and reduce false positives.
LIMITATIONS
Market Volatility: In extremely volatile or sideways-trending markets, the indicator might produce false signals. Always verify with additional confirmations.
Asset-Specific Performance: Different assets and timeframes will yield varying results; thorough backtesting across diverse instruments is recommended.
Over-Reliance Risk: Avoid relying solely on this indicator. Integrate it into a broader analytical framework that includes fundamental analysis and other technical indicators.
NOTES
Data Sufficiency: Ensure ample historical data is available for precise computations. Lack of data can skew results and lead to inaccurate signals.
Demo Testing: Before deploying the indicator in real trades, rigorously test it on demo accounts under varied market conditions to understand its strengths and weaknesses.
Customization Flexibility: Feel free to tweak the parameters continuously until they align perfectly with your unique trading approach and risk tolerance.
Vacuum Candles [XrayAlgo]The Vacuum Candles indicator helps traders identify inefficient price movements—where the price moves significantly but lacks sufficient volume to support it. These inefficiencies may signal weak trends, potential reversals, or false breakouts/breakdowns.
Inefficient candles are visually marked with a darker / black body to indicate when the price movement is disproportionate to the volume.
1. Spotting Potential Reversals
When the indicator marks an inefficient candle, it signals that the price movement may be unsustainable.
In an uptrend: A inefficient bullish candle suggests that the uptrend is losing momentum, potentially leading to a downward reversal.
In a downtrend: A inefficient bearish candle signals that the downtrend may be weakening, with a potential bullish reversal.
2. Identifying Breakout and Breakdown Failures
This indicator is useful for recognizing false breakouts or false breakdowns.
If price breaks resistance but the candle is inefficient, the breakout may be weak and could fail quickly.
If price breaks support with an inefficient bearish candle, the breakdown could be a false signal, with price reverting back above support.
3. Recognizing Weak Trends
Inefficient candles help you spot when a trend is losing strength and could soon reverse or consolidate.
In an uptrend: A series of dark body bullish candles suggests that the uptrend may be weakening, signaling a potential correction or trend reversal.
In a downtrend: A series of dark body bearish candles suggests that the selling pressure is weakening, indicating a potential bullish reversal.
4. Fine-Tuning Entries and Exits
Inefficient candles offer an opportunity to fine-tune your entries and exits based on weak price moves.
Entering a trade: An inefficient candle near key support or resistance can indicate a reversal, making it a good entry point for a counter-trend position.
Exiting a trade: If you're already in a trend, and an inefficient candle appears, it suggests the trend is losing strength, indicating it may be a good time to exit before a potential reversal.
5. Fine-Tuning with Inputs
The Vacuum Candles indicator includes two key inputs:
Length: The number of candles used to calculate the average price movement and volume. A longer length (e.g., 20-30) smooths out the inefficiencies, while a shorter length (e.g., 10-15) makes the indicator more sensitive to recent price moves.
Multiplier: Controls the threshold for what is considered an inefficient candle:
A higher Multiplier (e.g., 1.5–3) filters out smaller inefficiencies and focuses on large discrepancies.
A lower Multiplier (e.g., 0.1–0.9) captures even smaller inefficiencies in highly efficient markets.

Bullish and Bearish Breakout Alert for Gold Futures PullbackBelow is a Pine Script (version 6) for TradingView that includes both bullish and bearish breakout conditions for my intraday trading strategy on micro gold futures (MGC). The strategy focuses on scalping two-legged pullbacks to the 20 EMA or key levels with breakout confirmation, tailored for the Apex Trader Funding $300K challenge. The script accounts for the Daily Sentiment Index (DSI) at 87 (overbought, favoring pullbacks). It generates alerts for placing stop-limit orders for 175 MGC contracts, ensuring compliance with Apex’s rules ($7,500 trailing threshold, $20,000 profit target, 4:59 PM ET close).
Script Requirements
Version: Pine Script v6 (latest for TradingView, April 2025).
Purpose:
Bullish: Alert when price breaks above a rejection candle’s high after a two-legged pullback to the 20 EMA in a bullish trend (price above 20 EMA, VWAP, higher highs/lows).
Bearish: Alert when price breaks below a rejection candle’s low after a two-legged pullback to the 20 EMA in a bearish trend (price below 20 EMA, VWAP, lower highs/lows).
Context: 5-minute MGC chart, U.S. session (8:30 AM–12:00 PM ET), avoiding overbought breakouts above $3,450 (DSI 87).
Output: Alerts for stop-limit orders (e.g., “Buy: Stop=$3,377, Limit=$3,377.10” or “Sell: Stop=$3,447, Limit=$3,446.90”), quantity 175 MGC.
Apex Compliance: 175-contract limit, stop-losses, one-directional news trading, close by 4:59 PM ET.
How to Use the Script in TradingView
1. Add Script:
Open TradingView (tradingview.com).
Go to “Pine Editor” (bottom panel).
Copy the script from the content.
Click “Add to Chart” to apply to your MGC 5-minute chart .
2. Configure Chart:
Symbol: MGC (Micro Gold Futures, CME, via Tradovate/Apex data feed).
Timeframe: 5-minute (entries), 15-minute (trend confirmation, manually check).
Indicators: Script plots 20 EMA and VWAP; add RSI (14) and volume manually if needed .
3. Set Alerts:
Click the “Alert” icon (bell).
Add two alerts:
Bullish Breakout: Condition = “Bullish Breakout Alert for Gold Futures Pullback,” trigger = “Once Per Bar Close.”
Bearish Breakout: Condition = “Bearish Breakout Alert for Gold Futures Pullback,” trigger = “Once Per Bar Close.”
Customize messages (default provided) and set notifications (e.g., TradingView app, SMS).
Example: Bullish alert at $3,377 prompts “Stop=$3,377, Limit=$3,377.10, Quantity=175 MGC” .
4. Execute Orders:
Bullish:
Alert triggers (e.g., stop $3,377, limit $3,377.10).
In TradingView’s “Order Panel,” select “Stop-Limit,” set:
Stop Price: $3,377.
Limit Price: $3,377.10.
Quantity: 175 MGC.
Direction: Buy.
Confirm via Tradovate.
Add bracket order (OCO):
Stop-loss: Sell 175 at $3,376.20 (8 ticks, $1,400 risk).
Take-profit: Sell 87 at $3,378 (1:1), 88 at $3,379 (2:1) .
Bearish:
Alert triggers (e.g., stop $3,447, limit $3,446.90).
Select “Stop-Limit,” set:
Stop Price: $3,447.
Limit Price: $3,446.90.
Quantity: 175 MGC.
Direction: Sell.
Confirm via Tradovate.
Add bracket order:
Stop-loss: Buy 175 at $3,447.80 (8 ticks, $1,400 risk).
Take-profit: Buy 87 at $3,446 (1:1), 88 at $3,445 (2:1) .
5. Monitor:
Green triangles (bullish) or red triangles (bearish) confirm signals.
Avoid bullish entries above $3,450 (DSI 87, overbought) or bearish entries below $3,296 (support) .
Close trades by 4:59 PM ET (set 4:50 PM alert) .
