Cari dalam skrip untuk "股价在8元左右净利润为正市值小于80亿的热门股票有哪些"
Exploring UnicodeThis script demonstrates how to display Unicode characters and symbols, including emoji, in Pine:
• Part 1 displays multi-line labels on hi/lo pivots.
• Part 2 displays price/volume bumps using small up/down arrows plotted with plotchar() .
• Part 3 detects bounces and uses plotshape() to mark them.
You can use our `f_bounceFrom()` function from this part as confirmation for signals in your strategies.
Note that the labels displayed on pivots with the code in Part 1 are plotted in the past. In realtime, they would only appear where they are after 50 bars have elapsed from that point. The other plots are plotted on the bar where their conditions are detected.
You can display thousands of Unicode characters and symbols using Pine. As you can see with our script, it is very easy to do so. The challenge will often be to find the exact symbols you are looking for. Many websites exist to help you explore Unicode characters or symbols. The PineCoders Resources page contains a section presenting a few of them.
Duyck has a Unicode font function script containing functions to convert strings to monospaced Unicode representations. TradingView uses the Trebuchet font for most of its text, including text displayed with Pine scripts. While its numerals are monospace and will align vertically in labels text, Duyck's functions will be handy when you need to convert characters to a monospaced form, so they also align vertically in multi-line labels.
What is Unicode?
Unicode is to character encoding what Wikipedia is to knowledge; it holds codes to a good proportion of the characters or symbols used by humans, past or present. In the early days of computing, environments from different manufacturers often used different character encoding schemes, making transport between them difficult. Unicode solves that challenge. It is a comprehensive encoding scheme that visionaries from Xerox and Apple came up with in the late 80's. The addition of members from the Research Libraries Group, Sun Microsystems, Microsoft, Next and Metaphor created the "Unicode working group" and later, the Unicode Consortium , which continues to improve and manage the Unicode standard.
Theoretically, Unicode encodes values representing characters or glyphs —not their pictorial representations. The letters "A" or "a", or the blue heart emoji "💙" are each represented by a Unicode value. In practice, however, there are many different versions of the Latin alphabet in Unicode. That is how our low pivot label can display different representations of the letters "ITV". The exact rendition of Unicode symbols on a specific device is left to equipment manufacturers and typeface designers.
The current Unicode space is comprised of 17 planes of 65,536 characters each, which allows for more than one million code points . Planes are further divided into character blocks , which typically hold a character set corresponding to one script—or language. Emoticons are in the character block starting at U+1F600.
Look first. Then leap.

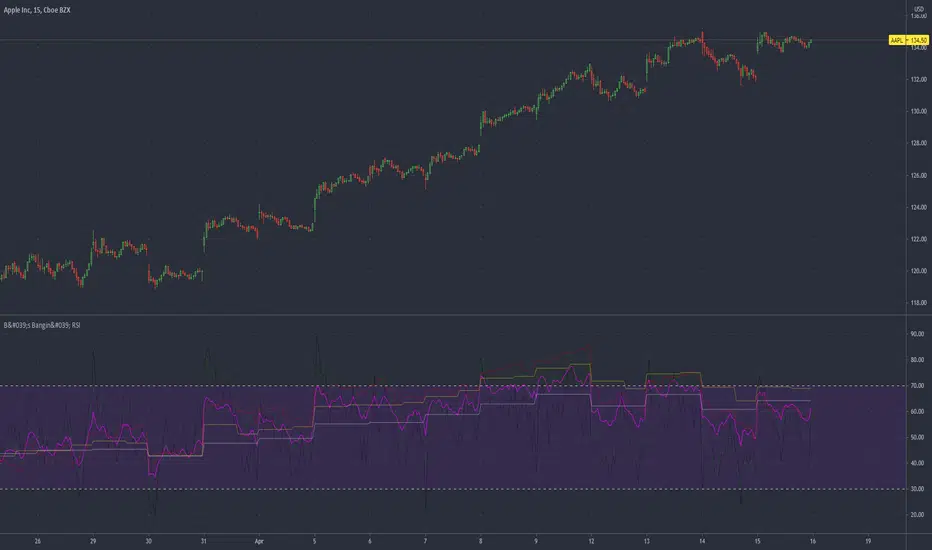
B's Average RSI (5m-1D)Multiple time frame RSIs plotted onto a single indicator.
Time frames used are:
5m (black)
15m (green)
60m (red)
240m (yellow)
Daily (white)
An average of all of the RSIs (pink)
RSI's are averaged into a single line. Also functions as multiple RSI's.
The pink average line should be used like any other RSI:
Above or below 50 signifies strength and weakness, respectively.
Above 80 and below 20 signal overbought and oversold conditions, respectively.
All in one [Liubam]Hey tradingviewers!
This is an All in one Indicator for those who can't add too many indicators on your charts. Inspired by ©LonesomeTheBlue "Indicators all in one" script. I found a lot of very interesting scripts on the public library and I decided to make a tool with some of the greatest IMO, adding some modifications to improve the indicators. With this tool you can plot 1 of 6 different indicators by selecting it from a drop-down list (on the indicator settings).
All the credit goes to it's respective owners (taggeds).
THIS INDICATOR INCLUDES:
1. Classic RSI with some OB/OS tools:
The relative strength index (RSI) is a popular momentum indicator displayed as an oscillator (a line graph that moves between two extremes) that measures the magnitude of recent price changes to evaluate overbought or oversold conditions, in other words it shows signals about bullish and bearish price momentum. I added some visual improvements to help you finding the OB/OS zones.
2. Classic CCI with some OB/OS tools.
The Commodity Channel Index (CCI) is a momentum-based oscillator used as market indicator to help determine market movements that may indicate buying or selling. Added some vistual improvements to the chart.
3. ADX and DMI oscillator with the keylevel coded by @console:
The Average Directional Index (ADX) is non-directional indicator used by some traders to determine the strength of a trend. When the ADX line is rising (Above the keylevel) trend strength is increasing, and the price moves in the direction of the trend whether up or down. Otherwise, low ADX (Below the keylevel) is usually a sign of accumulation or distribution (Range). Non-trending doesn't mean the price isn't moving. It may not be, but the price could also be making a trend change or is too volatile for a clear direction to be present.
Suggested settings of the keylevel is 23-25.... REMEMBER: The trend may be your friend.
4. MFI
The Money Flow Index (MFI) is a technical oscillator for identifying overbought or oversold signals in an asset. Unlike conventional oscillators such as the RSI, the Money Flow Index incorporates both price and volume data, as opposed to just price. It can also be used to spot divergences which warn of a trend change in price.
5. Stochastic:
A stochastic oscillator is range-bound, meaning it is always between 0 and 100. This makes it a useful indicator of overbought and oversold conditions. Traditionally, readings over 80 are considered in the overbought range, and readings under 20 are considered oversold. However, these are not always indicative of impending reversal; very strong trends can maintain overbought or oversold conditions for an extended period. Instead, traders should look to changes in the stochastic oscillator for clues about future trend shifts. I added some features for this popular indicator to show the stochastic crosses.
6. The famous Squeeze momentum Indicator made by @Lazybear:
This is derivate of John Carter's "TTM Squeeze" volatility indicator and its very strong when using with trending indicator such a ADX. Black line (or no-line) on the midline show that the market just entered a squeeze ( Bollinger Bands are with in Keltner Channel). This signifies low volatility , market preparing itself for an explosive move (up or down). Gray line signify "Squeeze release". Mr.Carter suggests waiting till the gray line after a blackline, and taking a position in the direction of the momentum (for ex., if momentum value is above zero, go long). Exit the position when the momentum changes.
------------------------------------------------------------------------------------------------------------------------------------------------------------------------------------------------------------------------------------------------
This script is source code protected, but you can add to your favorite list to use it. Also you can add twice to use 2 different indicators at the same time (E.g. Squeeze Momentum Indicator + ADX)
An additional indicator I made (MA Hunterz + InfoPanel) is needed to not miss good entry points.
Your valuable comment and feedback is much appreciated...
And remember indicators can be really helpfull but always use Price Action.

(IK) Stoch-60-15This strategy uses 60 minute and 15 minute stochastic data to determine entry and exit; it only executes long trades. I've only used this on BTC/USD, but I imagine the concepts employed should hold for any ticker
The script builds a simple Stochastic indicator for the current timeframe, and it also plots a single stochastic line for a higher resolution time frame. I've found good results trading on 15 minutes with a 60 minute higher resolution.
We enter a trade if the higher resolution stochastic is in an uptrend, if the current resolution stochastic is in an uptrend, and if the current stochastic value is less than 50.
We exit a trade when the current stochastic value crosses below 80 or the trailing stop loss is hit.
Stop loss is calculated with the input value, Stop Loss Percent. This value represents the percent of capital you're willing to lose before exiting a trade. A stop loss percent of 0.050 means your trade will exit if it falls 5% from the highest high since entering a trade. You will have at least 95% of your original capital left. There is no option to change a trailing stop loss to a set stop loss (in order to keep the code as simple as possible), however, you can turn it off by setting Stop Loss Percent to 1.
I tried to keep the script itself lightweight and very easy to understand, so it's not very customizable in regards to input options. You can change stochastic data, as well as the trailing stop percentage. The script can be adjusted to other timeframes, however this requires a small change in the code (details in script comments). Changing just the "Higher Resolution" input will not produce expected results
My hope is that by keeping it lightweight and simple, it will be easier for you to adjust to your specific needs, or work into a larger strategy.

Matrix Library (Linear Algebra, incl Multiple Linear Regression)What's this all about?
Ever since 1D arrays were added to Pine Script, many wonderful new opportunities have opened up. There has been a few implementations of matrices and matrix math (most notably by TradingView-user tbiktag in his recent Moving Regression script: ). However, so far, no comprehensive libraries for matrix math and linear algebra has been developed. This script aims to change that.
I'm not math expert, but I like learning new things, so I took it upon myself to relearn linear algebra these past few months, and create a matrix math library for Pine Script. The goal with the library was to make a comprehensive collection of functions that can be used to perform as many of the standard operations on matrices as possible, and to implement functions to solve systems of linear equations. The library implements matrices using arrays, and many standard functions to manipulate these matrices have been added as well.
The main purpose of the library is to give users the ability to solve systems of linear equations (useful for Multiple Linear Regression with K number of independent variables for example), but it can also be used to simulate 2D arrays for any purpose.
So how do I use this thing?
Personally, what I do with my private Pine Script libraries is I keep them stored as text-files in a Libraries folder, and I copy and paste them into my code when I need them. This library is quite large, so I have made sure to use brackets in comments to easily hide any part of the code. This helps with big libraries like this one.
The parts of this script that you need to copy are labeled "MathLib", "ArrayLib", and "MatrixLib". The matrix library is dependent on the functions from these other two libraries, but they are stripped down to only include the functions used by the MatrixLib library.
When you have the code in your script (pasted somewhere below the "study()" call), you can create a matrix by calling one of the constructor functions. All functions in this library start with "matrix_", and all constructors start with either "create" or "copy". I suggest you read through the code though. The functions have very descriptive names, and a short description of what each function does is included in a header comment directly above it. The functions generally come in the following order:
Constructors: These are used to create matrices (empy with no rows or columns, set shape filled with 0s, from a time series or an array, and so on).
Getters and setters: These are used to get data from a matrix (like the value of an element or a full row or column).
Matrix manipulations: These functions manipulate the matrix in some way (for example, functions to append columns or rows to a matrix).
Matrix operations: These are the matrix operations. They include things like basic math operations for two indices, to transposing a matrix.
Decompositions and solvers: Next up are functions to solve systems of linear equations. These include LU and QR decomposition and solvers, and functions for calculating the pseudo-inverse or inverse of a matrix.
Multiple Linear Regression: Lastly, we find an implementation of a multiple linear regression, including all the standard statistics one can expect to find in most statistical software packages.
Are there any working examples of how to use the library?
Yes, at the very end of the script, there is an example that plots the predictions from a multiple linear regression with two independent (explanatory) X variables, regressing the chart data (the Y variable) on these X variables. You can look at this code to see a real-world example of how to use the code in this library.
Are there any limitations?
There are no hard limiations, but the matrices uses arrays, so the number of elements can never exceed the number of elements supported by Pine Script (minus 2, since two elements are used internally by the library to store row and column count). Some of the operations do use a lot of resources though, and as a result, some things can not be done without timing out. This can vary from time to time as well, as this is primarily dependent on the available resources from the Pine Script servers. For instance, the multiple linear regression cannot be used with a lookback window above 10 or 12 most of the time, if the statistics are reported. If no statistics are reported (and therefore not calculated), the lookback window can usually be extended to around 60-80 bars before the servers time out the execution.
Hopefully the dev-team at TradingView sees this script and find ways to implement this functionality diretly into Pine Script, as that would speed up many of the operations and make things like MLR (multiple linear regression) possible on a bigger lookback window.
Some parting words
This library has taken a few months to write, and I have taken all the steps I can think of to test it for bugs. Some may have slipped through anyway, so please let me know if you find any, and I'll try my best to fix them when I have time to do so. This library is intended to help the community. Therefore, I am releasing the library as open source, in the hopes that people may improving on it, or using it in their own work. If you do make something cool with this, or if you find ways to improve the code, please let me know in the comments.

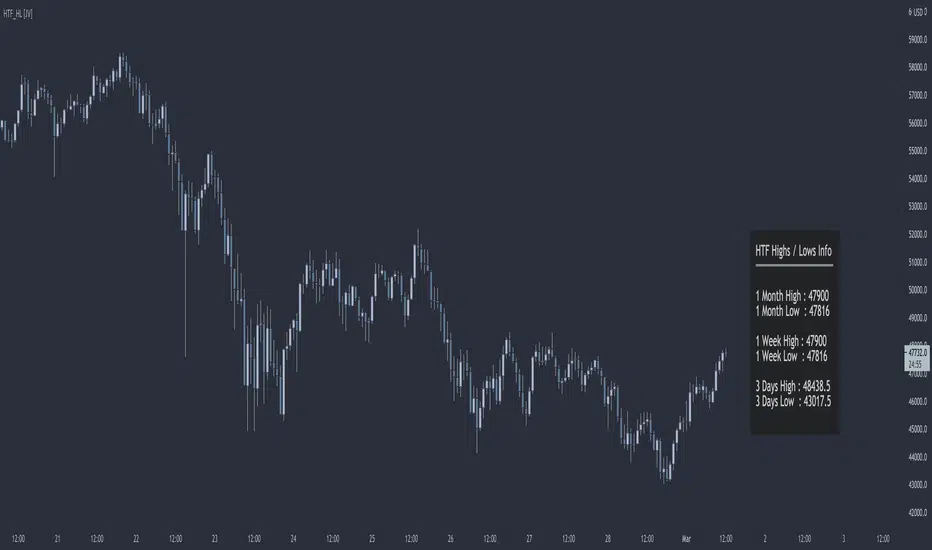
HTF Highs Lows [JV]█ OVERVIEW
This script presents a label with an overview of higher timeframe highs and lows. This can be useful information as we all know that price likes to revisit previous highs and lows area, specially on the higher timeframe.
█ CONCEPTS
This information can be relevant and valuable for various reasons:
Finding horizontal Support and Resistance
Get a better view on Market Structure
Provide some information about Order Flow
TrendLines
...
█ FEATURES
Plots
This script provides the option to show information about 3 timeframes
Each timeframe can be separately shown or hidden
The Y position of the info label can be user defined, based on high or low of the chosen timeframe
The X offset of the info label can be adjusted to the user's liking and the chart resolution
The label color and text color can be user defined
The info label's size can be user defined
█ NOTES
Caveat
The timeframes must be chosen in order of size. Meaning that the highest timeframe should be on top. This is title as such on the info label, but I want to mention it again as it's something to pay attention to.
Repainting
The question that pops up all the time is: Does it repaint ?
I will quote PineCoders on this:
We're pretty sure Wilder was not asked very often if RSI repainted. Why? Because it wasn't in fashion—and largely unnecessary—to ask that sort of question in the 80's. Many traders back then used daily charts only, and indicator values were calculated at the day's close, so everybody knew what they were getting. Additionally, indicator values were calculated by generally reputable outfits or traders themselves, so data was pretty reliable. Today, almost anybody can write a simple indicator, and the programming languages used to write them are complex enough for some coders lacking the caution, know-how or ethics of the best professional coders, to get in over their heads and produce code that does not work the way they think it does.
Briefly: yes, it repaints and no it does not matter.
Simple because we are working with highs and lows on a higher timeframe. So if we get a new high or low within a certain time frame, we want this new high or low to be displayed and, for me, it's not relevant if this information appears when it happens or when the candle closes.
Questions & Suggestions
Questions, suggestions or even a word of thanks are always welcomed in the comments section. I usually answer within the same day.
█ THANKS
A word of thanks to, and I hope I am allowed to use hyperlinks here, LonesomeTheBlue for being an inspiration on coding style and his work on arrays in Pine Script and to lmatl for his support, words of advice and letting me borrow his brain now and then.
Adaptive Double EMA StochInspired from the Works of Double Smoothed Stochastic by Walter Bressert,
I present to you!
Adaptive Double EMA Stoch Which Performs adaptively to the volumetric trends,
So the Green and Red Area Regions which you over the Stoch Indicator is the direction in which you should trade, These Areas are formed by a volumetric adaptive stoch, of adaptive period determined by the crosses of VWMA 55 and VWMA 200
The blue line is a stationary fixed length Double EMA Stoch of length 14,
How to Trade
1. Get the Status of the Trend : green area, for Bullish and red for Bearish from adaptive stoch
2. Check for the First Overbought (of stationary Stoch / blue line above 80) in Bearish Trend to go short
and similarly first Oversold (blue line below 20) in Bullish Trend to go long!
Enjoy!

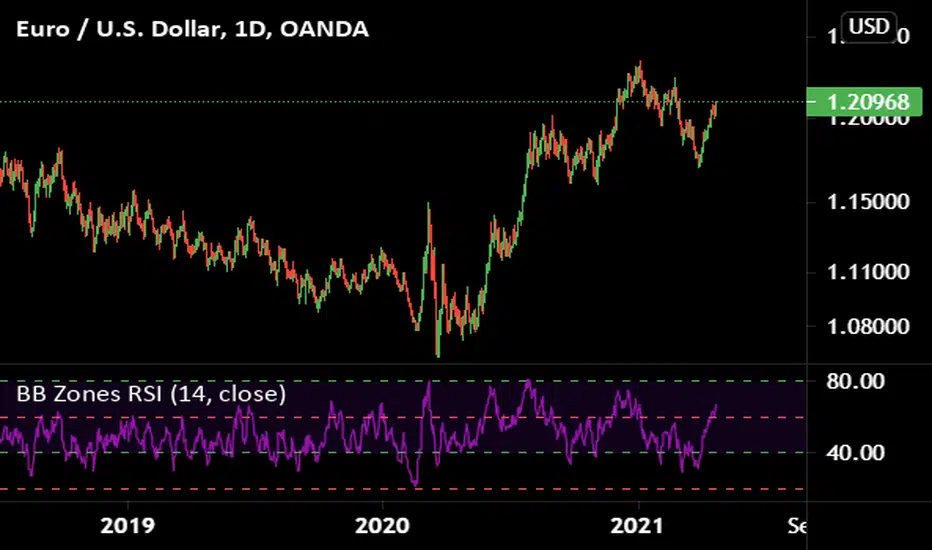
All-time high and percentage dropsThis script calculates the ATH of whichever chart you use and plots it in blue
There is also an option to display the following ATH percentages: 90, 80, 70, 60, 50, 40 and 30 in white

`security()` revisited [PineCoders]NOTE
The non-repainting technique in this publication that relies on bar states is now deprecated, as we have identified inconsistencies that undermine its credibility as a universal solution. The outputs that use the technique are still available for reference in this publication. However, we do not endorse its usage. See this publication for more information about the current best practices for requesting HTF data and why they work.
█ OVERVIEW
This script presents a new function to help coders use security() in both repainting and non-repainting modes. We revisit this often misunderstood and misused function, and explain its behavior in different contexts, in the hope of dispelling some of the coder lure surrounding it. The function is incredibly powerful, yet misused, it can become a dangerous WMD and an instrument of deception, for both coders and traders.
We will discuss:
• How to use our new `f_security()` function.
• The behavior of Pine code and security() on the three very different types of bars that make up any chart.
• Why what you see on a chart is a simulation, and should be taken with a grain of salt.
• Why we are presenting a new version of a function handling security() calls.
• Other topics of interest to coders using higher timeframe (HTF) data.
█ WARNING
We have tried to deliver a function that is simple to use and will, in non-repainting mode, produce reliable results for both experienced and novice coders. If you are a novice coder, stick to our recommendations to avoid getting into trouble, and DO NOT change our `f_security()` function when using it. Use `false` as the function's last argument and refrain from using your script at smaller timeframes than the chart's. To call our function to fetch a non-repainting value of close from the 1D timeframe, use:
f_security(_sym, _res, _src, _rep) => security(_sym, _res, _src )
previousDayClose = f_security(syminfo.tickerid, "D", close, false)
If that's all you're interested in, you are done.
If you choose to ignore our recommendation and use the function in repainting mode by changing the `false` in there for `true`, we sincerely hope you read the rest of our ramblings before you do so, to understand the consequences of your choice.
Let's now have a look at what security() is showing you. There is a lot to cover, so buckle up! But before we dig in, one last thing.
What is a chart?
A chart is a graphic representation of events that occur in markets. As any representation, it is not reality, but rather a model of reality. As Scott Page eloquently states in The Model Thinker : "All models are wrong; many are useful". Having in mind that both chart bars and plots on our charts are imperfect and incomplete renderings of what actually occurred in realtime markets puts us coders in a place from where we can better understand the nature of, and the causes underlying the inevitable compromises necessary to build the data series our code uses, and print chart bars.
Traders or coders complaining that charts do not reflect reality act like someone who would complain that the word "dog" is not a real dog. Let's recognize that we are dealing with models here, and try to understand them the best we can. Sure, models can be improved; TradingView is constantly improving the quality of the information displayed on charts, but charts nevertheless remain mere translations. Plots of data fetched through security() being modelized renderings of what occurs at higher timeframes, coders will build more useful and reliable tools for both themselves and traders if they endeavor to perfect their understanding of the abstractions they are working with. We hope this publication helps you in this pursuit.
█ FEATURES
This script's "Inputs" tab has four settings:
• Repaint : Determines whether the functions will use their repainting or non-repainting mode.
Note that the setting will not affect the behavior of the yellow plot, as it always repaints.
• Source : The source fetched by the security() calls.
• Timeframe : The timeframe used for the security() calls. If it is lower than the chart's timeframe, a warning appears.
• Show timeframe reminder : Displays a reminder of the timeframe after the last bar.
█ THE CHART
The chart shows two different pieces of information and we want to discuss other topics in this section, so we will be covering:
A — The type of chart bars we are looking at, indicated by the colored band at the top.
B — The plots resulting of calling security() with the close price in different ways.
C — Points of interest on the chart.
A — Chart bars
The colored band at the top shows the three types of bars that any chart on a live market will print. It is critical for coders to understand the important distinctions between each type of bar:
1 — Gray : Historical bars, which are bars that were already closed when the script was run on them.
2 — Red : Elapsed realtime bars, i.e., realtime bars that have run their course and closed.
The state of script calculations showing on those bars is that of the last time they were made, when the realtime bar closed.
3 — Green : The realtime bar. Only the rightmost bar on the chart can be the realtime bar at any given time, and only when the chart's market is active.
Refer to the Pine User Manual's Execution model page for a more detailed explanation of these types of bars.
B — Plots
The chart shows the result of letting our 5sec chart run for a few minutes with the following settings: "Repaint" = "On" (the default is "Off"), "Source" = `close` and "Timeframe" = 1min. The five lines plotted are the following. They have progressively thinner widths:
1 — Yellow : A normal, repainting security() call.
2 — Silver : Our recommended security() function.
3 — Fuchsia : Our recommended way of achieving the same result as our security() function, for cases when the source used is a function returning a tuple.
4 — White : The method we previously recommended in our MTF Selection Framework , which uses two distinct security() calls.
5 — Black : A lame attempt at fooling traders that MUST be avoided.
All lines except the first one in yellow will vary depending on the "Repaint" setting in the script's inputs. The first plot does not change because, contrary to all other plots, it contains no conditional code to adapt to repainting/no-repainting modes; it is a simple security() call showing its default behavior.
C — Points of interest on the chart
Historical bars do not show actual repainting behavior
To appreciate what a repainting security() call will plot in realtime, one must look at the realtime bar and at elapsed realtime bars, the bars where the top line is green or red on the chart at the top of this page. There you can see how the plots go up and down, following the close value of each successive chart bar making up a single bar of the higher timeframe. You would see the same behavior in "Replay" mode. In the realtime bar, the movement of repainting plots will vary with the source you are fetching: open will not move after a new timeframe opens, low and high will change when a new low or high are found, close will follow the last feed update. If you are fetching a value calculated by a function, it may also change on each update.
Now notice how different the plots are on historical bars. There, the plot shows the close of the previously completed timeframe for the whole duration of the current timeframe, until on its last bar the price updates to the current timeframe's close when it is confirmed (if the timeframe's last bar is missing, the plot will only update on the next timeframe's first bar). That last bar is the only one showing where the plot would end if that timeframe's bars had elapsed in realtime. If one doesn't understand this, one cannot properly visualize how his script will calculate in realtime when using repainting. Additionally, as published scripts typically show charts where the script has only run on historical bars, they are, in fact, misleading traders who will naturally assume the script will behave the same way on realtime bars.
Non-repainting plots are more accurate on historical bars
Now consider this chart, where we are using the same settings as on the chart used to publish this script, except that we have turned "Repainting" off this time:
The yellow line here is our reference, repainting line, so although repainting is turned off, it is still repainting, as expected. Because repainting is now off, however, plots on historical bars show the previous timeframe's close until the first bar of a new timeframe, at which point the plot updates. This correctly reflects the behavior of the script in the realtime bar, where because we are offsetting the series by one, we are always showing the previously calculated—and thus confirmed—higher timeframe value. This means that in realtime, we will only get the previous timeframe's values one bar after the timeframe's last bar has elapsed, at the open of the first bar of a new timeframe. Historical and elapsed realtime bars will not actually show this nuance because they reflect the state of calculations made on their close , but we can see the plot update on that bar nonetheless.
► This more accurate representation on historical bars of what will happen in the realtime bar is one of the two key reasons why using non-repainting data is preferable.
The other is that in realtime, your script will be using more reliable data and behave more consistently.
Misleading plots
Valiant attempts by coders to show non-repainting, higher timeframe data updating earlier than on our chart are futile. If updates occur one bar earlier because coders use the repainting version of the function, then so be it, but they must then also accept that their historical bars are not displaying information that is as accurate. Not informing script users of this is to mislead them. Coders should also be aware that if they choose to use repainting data in realtime, they are sacrificing reliability to speed and may be running a strategy that behaves very differently from the one they backtested, thus invalidating their tests.
When, however, coders make what are supposed to be non-repainting plots plot artificially early on historical bars, as in examples "c4" and "c5" of our script, they would want us to believe they have achieved the miracle of time travel. Our understanding of the current state of science dictates that for now, this is impossible. Using such techniques in scripts is plainly misleading, and public scripts using them will be moderated. We are coding trading tools here—not video games. Elementary ethics prescribe that we should not mislead traders, even if it means not being able to show sexy plots. As the great Feynman said: You should not fool the layman when you're talking as a scientist.
You can readily appreciate the fantasy plot of "c4", the thinnest line in black, by comparing its supposedly non-repainting behavior between historical bars and realtime bars. After updating—by miracle—as early as the wide yellow line that is repainting, it suddenly moves in a more realistic place when the script is running in realtime, in synch with our non-repainting lines. The "c5" version does not plot on the chart, but it displays in the Data Window. It is even worse than "c4" in that it also updates magically early on historical bars, but goes on to evaluate like the repainting yellow line in realtime, except one bar late.
Data Window
The Data Window shows the values of the chart's plots, then the values of both the inside and outside offsets used in our calculations, so you can see them change bar by bar. Notice their differences between historical and elapsed realtime bars, and the realtime bar itself. If you do not know about the Data Window, have a look at this essential tool for Pine coders in the Pine User Manual's page on Debugging . The conditional expressions used to calculate the offsets may seem tortuous but their objective is quite simple. When repainting is on, we use this form, so with no offset on all bars:
security(ticker, i_timeframe, i_source )
// which is equivalent to:
security(ticker, i_timeframe, i_source)
When repainting is off, we use two different and inverted offsets on historical bars and the realtime bar:
// Historical bars:
security(ticker, i_timeframe, i_source )
// Realtime bar (and thus, elapsed realtime bars):
security(ticker, i_timeframe, i_source )
The offsets in the first line show how we prevent repainting on historical bars without the need for the `lookahead` parameter. We use the value of the function call on the chart's previous bar. Since values between the repainting and non-repainting versions only differ on the timeframe's last bar, we can use the previous value so that the update only occurs on the timeframe's first bar, as it will in realtime when not repainting.
In the realtime bar, we use the second call, where the offsets are inverted. This is because if we used the first call in realtime, we would be fetching the value of the repainting function on the previous bar, so the close of the last bar. What we want, instead, is the data from the previous, higher timeframe bar , which has elapsed and is confirmed, and thus will not change throughout realtime bars, except on the first constituent chart bar belonging to a new higher timeframe.
After the offsets, the Data Window shows values for the `barstate.*` variables we use in our calculations.
█ NOTES
Why are we revisiting security() ?
For four reasons:
1 — We were seeing coders misuse our `f_secureSecurity()` function presented in How to avoid repainting when using security() .
Some novice coders were modifying the offset used with the history-referencing operator in the function, making it zero instead of one,
which to our horror, caused look-ahead bias when used with `lookahead = barmerge.lookahead_on`.
We wanted to present a safer function which avoids introducing the dreaded "lookahead" in the scripts of unsuspecting coders.
2 — The popularity of security() in screener-type scripts where coders need to use the full 40 calls allowed per script made us want to propose
a solid method of allowing coders to offer a repainting/no-repainting choice to their script users with only one security() call.
3 — We wanted to explain why some alternatives we see circulating are inadequate and produce misleading behavior.
4 — Our previous publication on security() focused on how to avoid repainting, yet many other considerations worthy of attention are not related to repainting.
Handling tuples
When sending function calls that return tuples with security() , our `f_security()` function will not work because Pine does not allow us to use the history-referencing operator with tuple return values. The solution is to integrate the inside offset to your function's arguments, use it to offset the results the function is returning, and then add the outside offset in a reassignment of the tuple variables, after security() returns its values to the script, as we do in our "c2" example.
Does it repaint?
We're pretty sure Wilder was not asked very often if RSI repainted. Why? Because it wasn't in fashion—and largely unnecessary—to ask that sort of question in the 80's. Many traders back then used daily charts only, and indicator values were calculated at the day's close, so everybody knew what they were getting. Additionally, indicator values were calculated by generally reputable outfits or traders themselves, so data was pretty reliable. Today, almost anybody can write a simple indicator, and the programming languages used to write them are complex enough for some coders lacking the caution, know-how or ethics of the best professional coders, to get in over their heads and produce code that does not work the way they think it does.
As we hope to have clearly demonstrated, traders do have legitimate cause to ask if MTF scripts repaint or not when authors do not specify it in their script's description.
► We recommend that authors always use our `f_security()` with `false` as the last argument to avoid repainting when fetching data dependent on OHLCV information. This is the only way to obtain reliable HTF data. If you want to offer users a choice, make non-repainting mode the default, so that if users choose repainting, it will be their responsibility. Non-repainting security() calls are also the only way for scripts to show historical behavior that matches the script's realtime behavior, so you are not misleading traders. Additionally, non-repainting HTF data is the only way that non-repainting alerts can be configured on MTF scripts, as users of MTF scripts cannot prevent their alerts from repainting by simply configuring them to trigger on the bar's close.
Data feeds
A chart at one timeframe is made up of multiple feeds that mesh seamlessly to form one chart. Historical bars can use one feed, and the realtime bar another, which brokers/exchanges can sometimes update retroactively so that elapsed realtime bars will reappear with very slight modifications when the browser's tab is refreshed. Intraday and daily chart prices also very often originate from different feeds supplied by brokers/exchanges. That is why security() calls at higher timeframes may be using a completely different feed than the chart, and explains why the daily high value, for example, can vary between timeframes. Volume information can also vary considerably between intraday and daily feeds in markets like stocks, because more volume information becomes available at the end of day. It is thus expected behavior—and not a bug—to see data variations between timeframes.
Another point to keep in mind concerning feeds it that when you are using a repainting security() plot in realtime, you will sometimes see discrepancies between its plot and the realtime bars. An artefact revealing these inconsistencies can be seen when security() plots sometimes skip a realtime chart bar during periods of high market activity. This occurs because of races between the chart and the security() feeds, which are being monitored by independent, concurrent processes. A blue arrow on the chart indicates such an occurrence. This is another cause of repainting, where realtime bar-building logic can produce different outcomes on one closing price. It is also another argument supporting our recommendation to use non-repainting data.
Alternatives
There is an alternative to using security() in some conditions. If all you need are OHLC prices of a higher timeframe, you can use a technique like the one Duyck demonstrates in his security free MTF example - JD script. It has the great advantage of displaying actual repainting values on historical bars, which mimic the code's behavior in the realtime bar—or at least on elapsed realtime bars, contrary to a repainting security() plot. It has the disadvantage of using the current chart's TF data feed prices, whereas higher timeframe data feeds may contain different and more reliable prices when they are compiled at the end of the day. In its current state, it also does not allow for a repainting/no-repainting choice.
When `lookahead` is useful
When retrieving non-price data, or in special cases, for experiments, it can be useful to use `lookahead`. One example is our Backtesting on Non-Standard Charts: Caution! script where we are fetching prices of standard chart bars from non-standard charts.
Warning users
Normal use of security() dictates that it only be used at timeframes equal to or higher than the chart's. To prevent users from inadvertently using your script in contexts where it will not produce expected behavior, it is good practice to warn them when their chart is on a higher timeframe than the one in the script's "Timeframe" field. Our `f_tfReminderAndErrorCheck()` function in this script does that. It can also print a reminder of the higher timeframe. It uses one security() call.
Intrabar timeframes
security() is not supported by TradingView when used with timeframes lower than the chart's. While it is still possible to use security() at intrabar timeframes, it then behaves differently. If no care is taken to send a function specifically written to handle the successive intrabars, security() will return the value of the last intrabar in the chart's timeframe, so the last 1H bar in the current 1D bar, if called at "60" from a "D" chart timeframe. If you are an advanced coder, see our FAQ entry on the techniques involved in processing intrabar timeframes. Using intrabar timeframes comes with important limitations, which you must understand and explain to traders if you choose to make scripts using the technique available to others. Special care should also be taken to thoroughly test this type of script. Novice coders should refrain from getting involved in this.
█ TERMINOLOGY
Timeframe
Timeframe , interval and resolution are all being used to name the concept of timeframe. We have, in the past, used "timeframe" and "resolution" more or less interchangeably. Recently, members from the Pine and PineCoders team have decided to settle on "timeframe", so from hereon we will be sticking to that term.
Multi-timeframe (MTF)
Some coders use "multi-timeframe" or "MTF" to name what are in fact "multi-period" calculations, as when they use MAs of progressively longer periods. We consider that a misleading use of "multi-timeframe", which should be reserved for code using calculations actually made from another timeframe's context and using security() , safe for scripts like Duyck's one mentioned earlier, or TradingView's Relative Volume at Time , which use a user-selected timeframe as an anchor to reset calculations. Calculations made at the chart's timeframe by varying the period of MAs or other rolling window calculations should be called "multi-period", and "MTF-anchored" could be used for scripts that reset calculations on timeframe boundaries.
Colophon
Our script was written using the PineCoders Coding Conventions for Pine .
The description was formatted using the techniques explained in the How We Write and Format Script Descriptions PineCoders publication.
Snippets were lifted from our MTF Selection Framework , then massaged to create the `f_tfReminderAndErrorCheck()` function.
█ THANKS
Thanks to apozdnyakov for his help with the innards of security() .
Thanks to bmistiaen for proofreading our description.
Look first. Then leap.

RSI of MACD Strategy [Long only]This strategy uses the RSI on MACD indicator.
BUY
====
When RSI indicator crossing over 30 or 35 line and price above slow ema
Note: when the position already taken, you may reenter on the purple candle
Partial Exit
==========
Partial profit taking option is available in settings. If this is selected , 1/3 position exited when RSI indicator crossing down 80 line
Close
=====
When RSI indicator crossing below 15
Stop Loss
=========
I havent used hard stop loss in this strategy. Reason is , when price going down , indicator may go up ... so just wanted to ride along with indicator ...
Stop loss mentioned in the settings is used in calculation of how many units can be be purchased based on risk level
Tested with SPY and QQQ ETFs on hourly chart
Warning
=========
For the eductional purposes only ...
This is not a financial advise. please do your own research before taking any trading decission

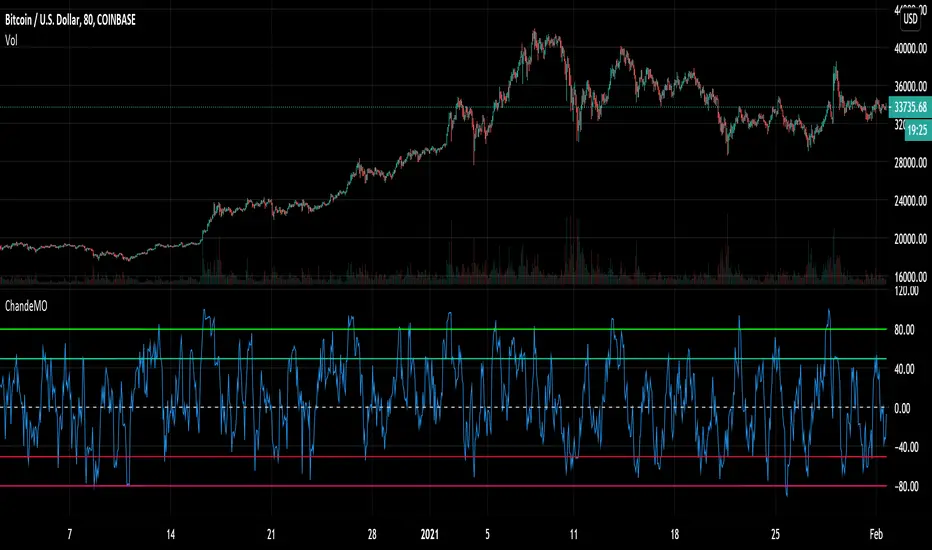
Chande Momentum Oscillator - Alerts and RegionsIt seemed weird to me that the default Chande didn't have overbought and oversold regions, despite them being described for Chande Momentum and working very well. So I added the lines and alert conditions. I've used this to very good results in my day trading.
My strategy involved 4 timeframes of candlestick, each with 4 timeframes of Chande overlaid. Candlesticks are 5 min, 20 min, 80 min, 320 min and Chandes are x1, x2, x4 and x8 of the relevant time zone. Give it a shot. Use the 5 min Chande as Buy and Sell signal with the other timeframes for trend confirmation. You may get a lot of extra alerts with this setup, but it's almost impossible to really miss an opportunity if you use it right. It will take up all your free time though, as a warning. Using this strat made me go crazy.
Use the chande crossing over the lines as the signal, not just being in the region, as that will make you buy early.
StochRSI x RSI x CCI x EMAsWanted to put this out there. Kind of a rough explanation but basically I wanted to build an indicator that takes out emotions and is easy to read. The indicator is basically RSI, stochRSI, CCI, and EMAs into an easy to read package. The traffic lights at the end will tell you if stochRSI/RSI and price action above according to EMA ribbon are in agreement. RSI with a period of 2 also always seemed very useful to me but it was just extremely distracting to look at it. I tried to make many rules in this indicator to find as much confluence between RSI, stochRSI, CCI, and EMAs to help you make better decisions. What is shown on the indicator is not necessarily a buy/sell signal. It should be seen as a way to view strength of price and possible momentum changes.
I find that one of the biggest distractions of indicators is taking your eyes off what is really happening at the chart above. This indicator uses popular and well used tools and helps you to get an easier visual of what is happening.
Purple lines at top and bottom: Short RSI ob/os
Red/orange and blue/green lines at top and bottom: When stochRSI kd and CCI also crosses +/- 100 or 200
Blue background: when stochRSI k > d and short RSI crosses above 30
Red background: when stochRSI k < d and short RSI crosses below 70
Green crosses: StochRSI is above 80 and making higher highs
Red X crosses: StochRSI is below 20 and making lower lows
Red/green fill of stochRSI and purple/blue dots on RSI: When short RSI and stochRSI are both ob/os
Red/green fill of RSI: Green when Long rsi > 50, red when Long rsi < 50
60/40 lines: Possible support/resistance for RSI
Traffic lights
1st light: Long RSI > EMA and stoch RSI k>d or vice versa
2nd light: Price above EMA 1 and 2 or vice versa
3rd light: when lights 1 and 2 are in agreement
Hope you enjoy!

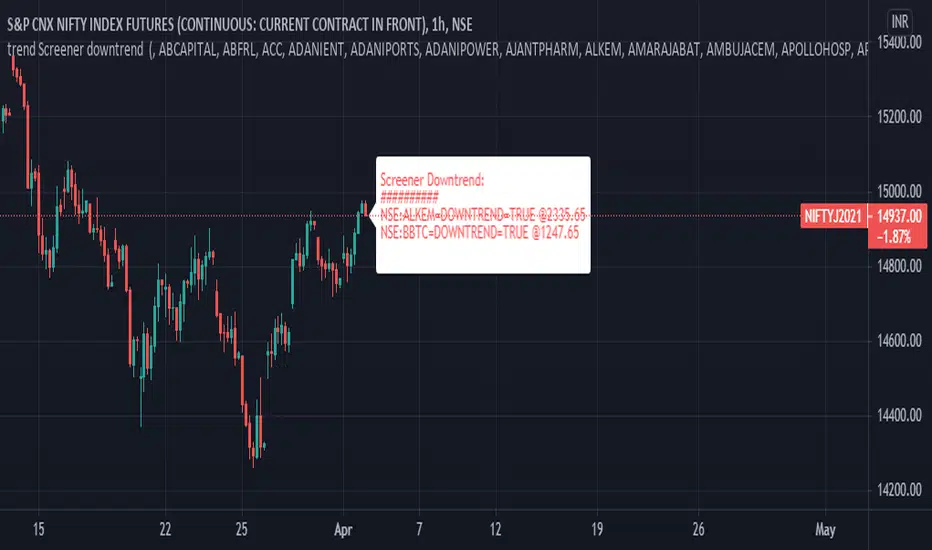
trend Screener downtrendthis is in continuation with - previous trend screener i have published, In this code only downtrend screener is there ,This is type of custom screener I searched and made to screen bulk stocks any one can modify it, other may get help out of it.
you can change or add new symbol in input section.
in my code i have made defined and printed last close price when downtrend was true.
1. downtrend = ema (close,55)< ema (close,144) and ema (close,144)< ema (close,388) and ema (close,388)<ema(close,576) and close<ema(close,388)
if the indicator is printing DOWNTREND=TRUE or UPTREND=TRUE then the corresponding stock is in currently in that trend out of the stocks listed in the code
in one code only 40 (max) stocks can be called.
to add more stocks I copied same code and changed the stocks in the code, now you can screen 80 stocks at a time.
This code runs on each bar and checks if the stocks is in uptrend or down trend.
you can customize this screener according to your requirement.
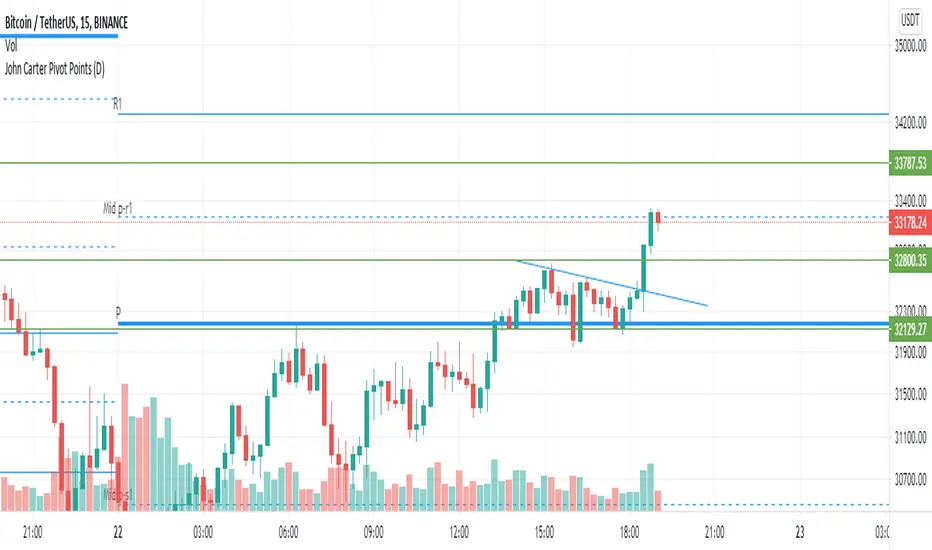
John Carter Pivot Points
This script is based on John Carter Mastering The Trade book. Pivot calculation is based on the previous day high, low, and close.
What Are the Trading Rules for Pivot Buys on Trending Days?
Sells are reversed.
1. Each day I update the appropriate pivot levels on the charts to reflect the previous day’s action. On Mondays, I also
update the weekly pivots, and on the first trading day of a new month, I update the monthly pivots.
2. The first pivot play is done in conjunction with the gap, if there is one. If there is a gap down, then I buy a decline into
the closest pivot level. If there isn’t a playable gap (more than 10 YM points or 1 ES point), then I will wait until
9:45 a.m. eastern to initiate the first play.
3. If the volume on the five-minute ES chart is more than 25,000 contracts, then I’ll wait for the markets to penetrate a
pivot level and move up at least a quarter of the way to the next pivot level. Once this happens, I will then set up a
bid to buy the first retracement back to the violated pivot level.
4. I enter my trades with limit orders only. I place orders “just in front of” the pivot. For the YM, I use 3 points; for the
ES, 0.25 point; for the NQ, 0.50 point; for the TF, 0.20 point; and for individual stocks, 5 cents. For example, if I’m
trading the YM and the pivot level is 10,000, then I would buy a decline to 10,003 and short a rally to 9997
.Sometimes the pivot will be an odd number, such as 1117.38 on the ES. In this case, I always round in the direction of
the trade. So, if I’m bidding for a long, I will round 1117.38 to 1117.50, and my bid will be 1117.75. If I’m offering a
short, I will round 1117.38 down to 1117.25 and place my offer at 1117.00. My stops and targets, then, would be “just
in front of” these appropriate long and short levels.
5. Once filled, I place an order to close the first half at the next pivot level and the second half at the pivot level after
that, using the same “just in front of” parameters.
6. I place a stop at 20 points for the YM, 2 points for the ES, 4 points for the NQ, and 1.50 points for the Russell. For
stocks, I will use a stop based roughly on the price of the stock. If the stock is under $10 a share, I will use a stop of
20 cents. If it is between $10 and $20, I will use a stop of 30 cents; if it is between $20 and $30, I will use a stop of
40 cents, and so on, adding another 10 cents for each $10 increment in price. (A $75 stock would have an 80-cent
stop, for example.)
7. If the first target is hit, I will then move up the stop to my entry-level pivot, minus the “just in front of” fractions
discussed in rule 3. For example, if I get in a YM long at 10,003 and the pivot is at 10,000, then my new stop would
be 9997 once the first target is hit.
8. If I am in a trade at the market close and neither my stop nor my target has been hit, I will close out my position “at the
market” at 4:10 p.m. eastern for futures, and at 3:58 p.m. eastern for stocks.
9. I don’t initiate any new positions after 3:30 p.m. eastern, but I will manage existing positions into the close.
10. The markets rarely have a sustained move above R3 or below S3. If I trade to those levels, I will always fade the
move.
11. After two losers in a row, I’m done with pivots for the day.
What Are the Trading Rules for Pivot Buys on Choppy Days?
Once again, sells are the same, just reversed. The rules for choppy days are identical except for the targets. On choppy days, I
just focus on the YM and the ES. My first target is mechanical: 10 points for the YM and 1 point for the ES on half of my
position. Once this is hit, I will trail up my stop in the same way I would for a trending trade. The second target becomes the
“just in front of” level for the actual next pivot level
Koalafied RSI StateConcept taken from RSI : The Complete Guide by John Hayden
2:1 momentum is associated with RSI values of 66.67 and 33.33 respectfully. In an Uptrend an RSI value of 40 should not be broken and in a downtrend a RSI value of 60 should not be exceeded. If so, then there is buying/selling pressure in the opposite direction (but not necessarily enough for a trend reversal). Alternatively it may show the presence of HTF traders. 4:1 momentum (RSI values of 80/20) can be associated with extreme market conditions, typically thought of as being Overbought or Oversold.
This script shows three market states based on RSI
1. Trend State - Triggered by RSI breaking a 2:1 momentum level
2. Trend Momentum - When RSI is above/below a 2:1 momentum level
3. Overbought/Oversold - When RSI is above a 4:1 momentum level

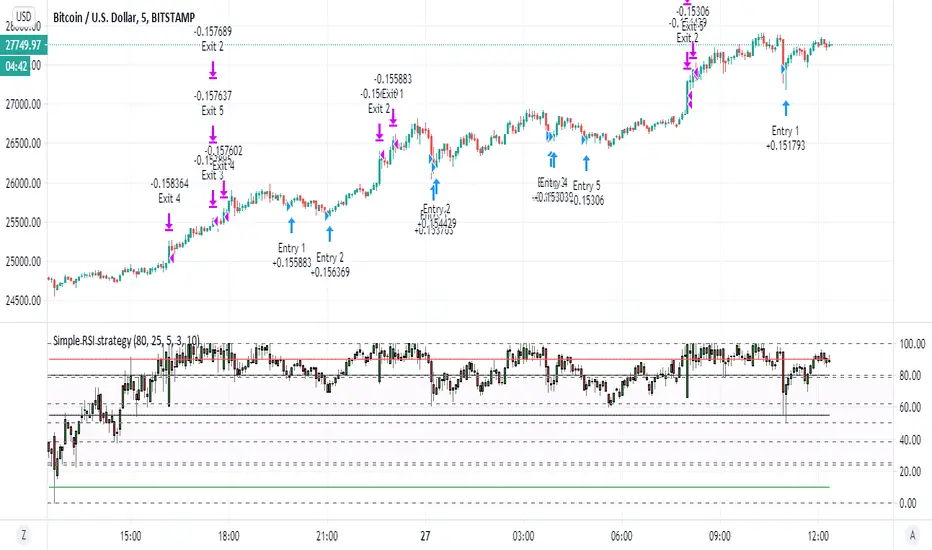
Simple RSI strategyso this script just take it as teaching how to make easy strategy
many time we try complex one and we fail
thanks to coinrule for his very smart method of pyramid
i just here in this very simple rsi strategy want to show how even lame strategy like RSI can be very profitable:)
1. we exit by take profit
2. we make sure that for exit by take profit the stop loss will be far lets say 10% or more
3. this shit only work good in up trending markets:)
why regular rsi strategy not working? because the exit is shity ... it depend on false top that based on RSI above 70 or 80 in general.
in bullish state this will exit us faster then we desire and will cost us loss . in bearish state rsi will not go so high and we exit too late so the stop loss is our our only saver
here by exiting by% we get much better results
so what happen if the trend is bearish? you can can try to do the same just reverse order to create more shorts (sometime it work sometime is not)
end conclusion in bullish trending market even shifty strategy is good
the only reason this one work is actually because of the script of coinrule so i want to thank him on this
happy new year to all TV members
Recession IndicatorThis script attempts to predict recessions four quarters ahead.
According to the New York Fed, "The yield curve—specifically, the spread between the interest rates on the ten-year Treasury
note and the three-month Treasury bill—is a valuable forecasting tool. It is simple to use
and significantly outperforms other financial and macroeconomic indicators in predicting
recessions two to six quarters ahead."
The paper offers Estimated Recession Probabilities Using the Yield Curve Spread:
Four Quarters Ahead
Recession Probability Value of Spread
(Percent) (Percentage Points)
5 1.21
10 0.76
15 0.46
20 0.22
25 0.02
30 -0.17
40 -0.50
50 -0.82
60 -1.13
70 -1.46
80 -1.85
90 -2.40
"Note: The yield curve spread is defined as the spread between the
interest rates on the ten-year Treasury note and the three-month
Treasury bill."
You can choose at which Recession Probability (percent) you want to display the signal (default value is 25%), as well as choose if you want to only display the signal at inversion (default) or at all times when the yield curve is inverted.
To use, just select your current timeframe from the menu.
Includes an option for repainting -- default value is true, meaning the script will repaint the current bar.
False = Not Repainting = Value for the current bar is not repainted, but all past values are offset by 1 bar.
True = Repainting = Value for the current bar is repainted, but all past values are correct and not offset by 1 bar.
In both cases, all of the historical values are correct, it is just a matter of whether you prefer the current bar to be realistically painted and the historical bars offset by 1, or the current bar to be repainted and the historical data to match their respective price bars.
As explained by TradingView,`f_security()` is for coders who want to offer their users a repainting/no-repainting version of the HTF data.

Xiang Stoch MACD 200EMAStochastic + MACD + 200 EMA indicator
Green flag
1) MACD crossover Signal line
2) Stochastic in oversold region (=80)
3) Below 200 EMA (direction of trend)
I use 200 EMA to determine the direction of the trend, (can ignore point 3 for both flag if you got other ways).
If green flag, high possibility of market going up.
If red flag, high possibility of market going down.

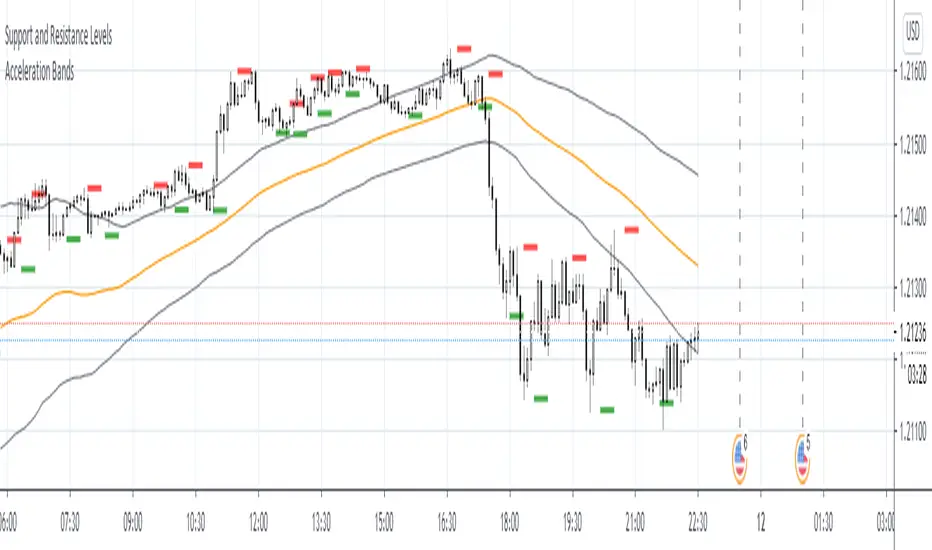
Acceleration BandsAcceleration Bands
Description:
Acceleration Bands serve as a trading envelope that factor in an assets typical volatility over standard settings of 20 or 80 bars. They can be used across any time period, though traders prefer to use them most across weekly and monthly timeframes as breakout indicators outside these bands.
Using the shorter time frames can define likely support and resistance levels at the lower and upper Acceleration Bands.
Entry is usually made at the breakout point. Once the price closes back within the Acceleration Bands, this is taken as a signal that the acceleration period is over and it’s best to close out the trade.
G-Oscillator Strength v.1Hello this is my new indicator. Purpose of this indicator is to find the strength of the trend.
This indicator was developed by RSI(14) and Stochastic(50)
How to used
Red = RSI(14) & Sto(50) < 40
Lightblue = RSI(14) >= 50 and Sto(40) < 50
Darkblue = RSI(14) & Sto(40) >= 50
Green = Sto(40) >= 80
Yellow = RSI(14) < 50 and Sto(40) >= 50
Buy&Sell
Buy signal for this indicator is Lightblue to Darkblue
Sell signal is Green to Darkblue or Darkblue to Yellow

William %R Scalper for GoldWilliam %R Scalper or WPR Scalper tool is used with small time frame : 5 , 3 or 1 minute, it uses two different William %R indicators : one for fast move with 9 period WPR9 and one slow with 54 period WPR54. You can find buy zone when WPR9 < -90 and WPR54 < -80 and sell zone when WPR9 > -10 AND WPR54 > -20. For experience user only you can adapt the two periods and threshold levels to your need. You can use only WPR9 to place trade and validate trend with WPR54.

MACD Trend CandlesThe script combines 2 indicators (MACD and Stoch-RSI) and puts them visually directly on the candles - can be used with normal OHLC candles or Heiken Ashi candles. Furthermore, you can derive divergences exremely easy directly visually from the candles as well. Lastly, a SMA 20 high and a SMA 20 low line build a trend channel.
Script is best used in trending markets to trade with the trend.
1) SMA trend channel:
* uptrend: close above
* downtrend: close below
* aggressive entry (uptrend) closing inside channel from below
* conservative entry (uptrend) closing above channel from inside
* hold (uptrend) until close below channel
* can be used accordingly for the downtrend
2) MACD candles
* visualization of the MACD histogram directly on the candles
* dark blue: histogram > 0 and histogram > histogram of previous candle
* light blue: histogram > 0 and histogram < histogram of previous candle
* orange: histogram < 0 and histogram < histogram of previous candle
* light blue: histogram < 0 and histogram > histogram of previous candle
* hold uptrend (dark/light blue candles) - combined with trend channel (above channel)
* hold downtrend (orange /yellow candles) - combined with trend channel (below channel)
* Color divergence: light blue candle > dark blue candle (price and MACD show divergence (bearish)
* Color divergence: yellow candle < orange candle (price and MACD show divergence (bullish)
* Trend change (0 line cross to upside) yellow or orange to dark blue
* Trend change (0 line cross to downside) dark or light blue to orange
3) Stoch RSI diamonds
* visualization of the STOCH-RSI as diamonds above or below the candle
* k, d line > 80: diamond above the candle
* k, d line < 20: diamond below the candle
* divergence caldle without diamond above > candle with diamond above (bearish divergence)
* divergence caldle without diamond below < candle with diamond below (bullish divergence)
Feel free to test each part individually and combine it with other indicators, e.g. BBands and Ichimoku Cloud - you will see it is a powerful visualization script
HAVE FUN
