Triple EMA Bundle (50, 100, 200) - Osbrah CRG📈 Advanced EMA Indicator – 50/100/200
This custom-built indicator displays the 50, 100, and 200 Exponential Moving Averages (EMAs), giving traders a powerful visual tool to identify key trend directions, dynamic support/resistance levels, and potential market reversals.
Designed for both beginners and advanced users, this tool offers extensive customization options:
* Select which EMAs to display (50, 100, 200)
* Adjust colors, line styles, and thickness
* Choose between different price sources (close, open, hl2, etc.)
* Set custom EMA lengths to fit your strategy
Use Cases:
* Spot trend direction and strength at a glance
* Identify key zones of support and resistance
* Confirm entries/exits based on EMA crossovers or rejections
* Align your trades with higher timeframe trends
Whether you're a swing trader or a scalper, this indicator helps you stay in sync with the market by bringing clarity to long-term momentum zones.
Cari dalam skrip untuk "股价长期底部,市值50亿左右"
Distance between EMA 50-100/100-150This script calculates and plots the percentage difference between the 50-period, 100-period, and 150-period Exponential Moving Averages (EMA) on a TradingView chart. The aim is to provide a clear visual representation of the market's momentum by analyzing the distance between key EMAs over time.
Key features of this script:
1. EMA Calculation : The script computes the EMA values for 50, 100, and 150 periods and calculates the percentage difference between EMA 50 and 100, and between EMA 100 and 150.
2. Custom Threshold : Users can adjust a threshold percentage to highlight significant divergences between the EMAs. A default threshold is set to 0.1%.
3. Visual Alerts : When the percentage difference exceeds the threshold, a visual marker appears on the chart:
Green Circles for bullish momentum (positive divergence),
Red Circles for bearish momentum (negative divergence),
Diamonds to indicate the first occurrence of new bullish or bearish signals, allowing users to catch fresh market trends.
4. Dynamic Plotting : The script plots two lines representing the percentage difference for each EMA pair, offering a quick and intuitive way to monitor trends.
Ideal for traders looking to gauge market direction using the relationship between multiple EMAs, this script simplifies analysis by focusing on key moving average interactions.

RSI 30-50-70 moving averageDescription:
The RSI 30-50-70 Moving Average indicator plots three distinct moving averages based on different RSI ranges (30%, 50%, and 70%). Each moving average corresponds to different market conditions and provides potential entry and exit signals. Here's how it works:
• RSI_30 Range (25%-35%): The moving average of closing prices when the RSI is between 25% and 35%, representing potential oversold conditions.
• RSI_50 Range (45%-55%): The moving average of closing prices when the RSI is between 45% and 55%, providing a balanced perspective for trend-following strategies.
• RSI_70 Range (65%-75%): The moving average of closing prices when the RSI is between 65% and 75%, representing potential overbought conditions.
This indicator offers flexibility, as users can adjust key parameters such as RSI ranges, periods, and time frames to fine-tune the signals for their trading strategies.
How it Works:
Like traditional moving averages, the RSI 30-50-70 Moving Averages can highlight dynamic levels of support and resistance. They offer additional insight by focusing on specific RSI ranges, providing early signals for trend reversals or continuation. The default settings can be used across various assets but should be optimized via backtesting.
Default Settings:
• RSI_30: 25% to 35% (Oversold Zone, yellow line)
• RSI_50: 45% to 55% (Neutral/Trend Zone, green line)
• RSI_70: 65% to 75% (Overbought Zone, red line)
• RSI Period: 14
Buy Conditions:
• Use the 5- or 15-minute time frame.
• Wait for the price to move below the RSI_30 line, indicating potential oversold conditions.
• Enter a buy order when the price closes above the RSI_30 line, signaling a recovery from the oversold zone.
• For a more conservative approach, use the RSI_50 line as the buy signal to confirm a trend reversal.
• Important: Before entering, ensure that the RSI_30 moving average has flattened or started to level off, signaling that the oversold momentum has slowed.
Sell Conditions:
• Use the 5- or 15-minute time frame.
• Wait for the price to close above the RSI_70 line, indicating potential overbought conditions.
• Enter a sell order when the price closes below the RSI_70 line, signaling a decline from the overbought zone.
• Important: Similar to buying, wait for the RSI_70 moving average to flatten or level off before selling, indicating the overbought conditions are stalling.
Key Features:
1. Dynamic Range Customization: The indicator allows users to modify the RSI ranges and periods, tailoring the moving averages to fit different market conditions or asset classes.
2. Trend-Following and Reversal Signals: The RSI 30-50-70 moving averages provide both reversal and trend-following signals, making it a versatile tool for short-term traders.
3. Visual Representation of Market Strength: By plotting moving averages based on RSI levels, traders can visually interpret the market’s strength and potential turning points.
4. Risk Management: The built-in flexibility allows traders to choose lower-risk entries by adjusting which RSI level (e.g., RSI_30 vs. RSI_50) they rely on for signals.
Practical Use:
Different assets respond uniquely to RSI-based moving averages, so it's recommended to backtest and adjust ranges for specific instruments. For example, volatile assets may require wider RSI ranges, while more stable assets could benefit from tighter ranges.
Checking for Buy conditions:
1st: Wait for current price to go below the RSI_30 (yellow line)
2nd: Wait and observe for bullish divergence
3rd: RSI_30 has flattened indicating potential gain of momentum after a bullish divergence.
4th: Enter a buy order when the price closed above the RSI_30, preferably when a green candle appeared.

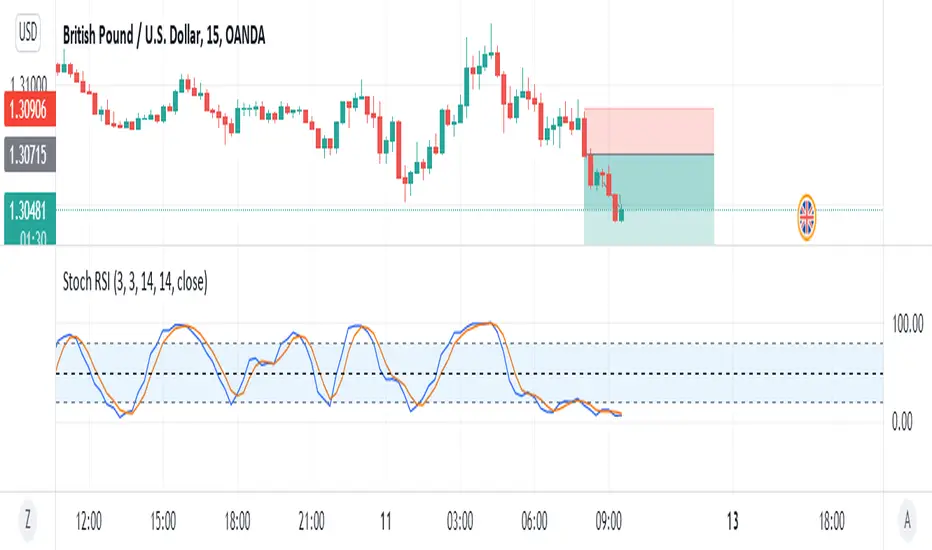
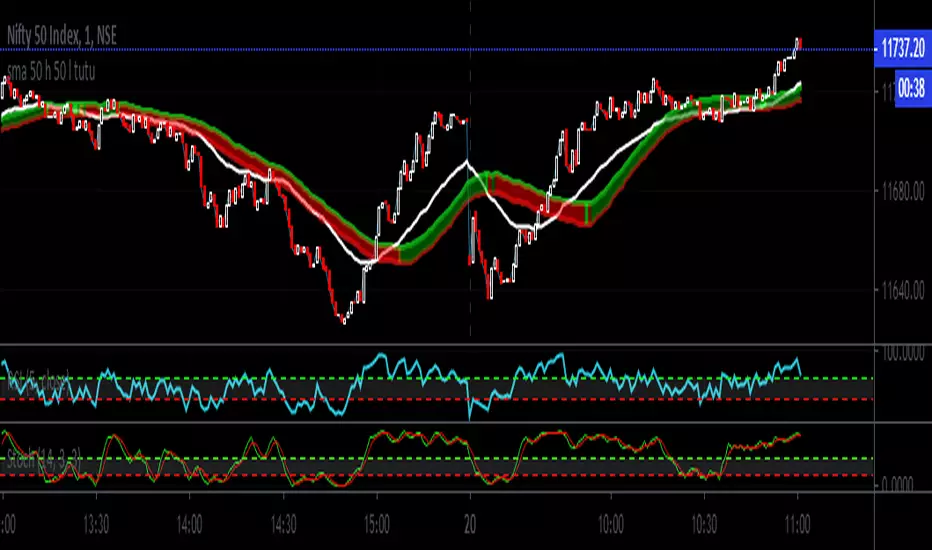
Stochastic RSI (50 Line)This Stoch RSI has a 50 line to help determine if the momentum is going up or down. Under 50, down and above 50 is up.
MultipSMMA 5-9-13-21-35-50-100 @trueenight //@version=4
study("MultipSMMA 5-9-13-21-35-50-100", overlay = true)
getSma(src, len) =>
float smma = 0.0000000
// len = input(7, minval=1, title="Length")
// src = input(close, title="Source")
smma := na(smma ) ? sma(src, len) : (smma * (len - 1) + src) / len
//plot(smma, color=color.red)
smma
plot(getSma(close, input(5, "Sma 5 ")),"sma5", color=#ff0000)
plot(getSma(close, input(9, "Sma 9 ")),"sma9", color=#ff4d00)
plot(getSma(close, input(13, "Sma 13 ")),"sma13", color=#ff9800)
// plot(sma18,"sma18", color=color.green)
plot(getSma(close, input(21, "Sma 21 ")),"sma21", color=#c27ba0, linewidth=3)
plot(getSma(close, input(35, "Sma 35 ")),"sma35", color=#00ffff)
plot(getSma(close, input(50, "Sma 50 ")),"sma50", color=#ff00ff, linewidth=3)
plot(getSma(close, input(100, "Sma 100 ")),"sma100", color=color.yellow, linewidth=3)
Simple Moving Average 20,50,100This SMA Script is modified and is based on 3 bands which are of 20 days, 50 days, 100 days average line.
This is a very appropriate for Indian Markets.
**How to Use :**
***BUY***
When the chart pattern is as follows :-
- SMA 200 (Black)
- SMA 50 (Red)
- SMA 20 (Green)
- "Last Traded Price"
***SELL***
When the chart pattern is as follows :-
- "Last Traded Price"
- SMA 20 (Green)
- SMA 50 (Red)
- SMA 200 (Black)
And Book Good Profits!!!

EMA 5/10/21 SMA 50/100/200The Script is mixture of both EMAs and SMAs. EMA 5/10/21 are powerful indicators for short term providing more weightage to the recent prices. SMA 50/100/200 provide the long term view.
5 Day EMA: This is a sign of strong momentum. It tracks the trend in the short term time frame. This is support in the strongest up trends. This line can only be used in low volatility trends with strong momentum. A break back above this line is a sign for me that an uptrend may be resuming. I primarily use it as an end of day trailing stop. It is rare that this line does not break intraday, even in the strongest trending markets.
• 10 day EMA: The 10 day EMA is a great moving average to use to keep you on the right side of the major market trend. It is usually the first line to be lost before any real trouble begins. It can be used as a standalone signal in some stocks and markets that tend to trend strongly in one direction for long periods.
• 21 day EMA: This is the intermediate term moving average. It is generally the last line of support in a volatile uptrend. To me, it is the inevitable reversion to the mean in a market when it finally pulls back after an extended trend.
• 50 day SMA: This is the line that strong leading stocks typically pull back to. This is usually the support level for strong uptrends. It is normal for uptrending markets to pull back to this line and find support. Most bull markets and uptrends will pull back to this level. It is generally a great “Buy the dip” level.
• 100 day SMA: This is the line that provides the support between the 50 day and the 200 day. If it does not hold as support, there is a high probability that the 200 day SMA is the next stop. This is the deeper pullback level in bull markets and uptrends. It usually presents a great risk/reward ratio in bull markets.
• 200 day SMA: Bulls like to buy dips when markets are trading above the 200 day moving average, while bears sell rallies short below it. Bears usually win below this line, as the 200 day becomes longer term resistance, and bulls buy pullbacks to the 200 day as long as the price stays above it. This line is one of the biggest signals in the market telling you which side to be on. Bull above, Bear below. Bad things happen to stocks and markets when this line is lost.

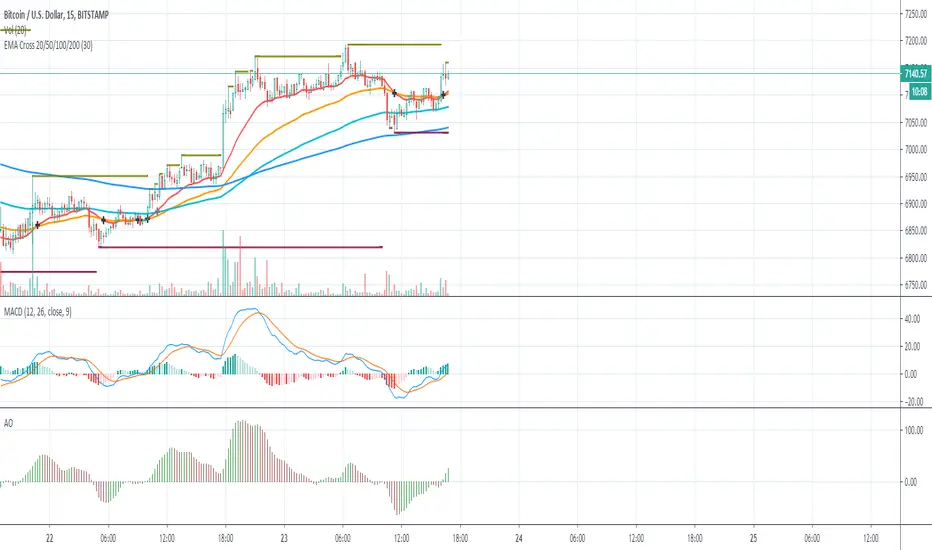
EMA Cross 20/50/100/200EMA Cross 20 50 100 200
Easy identify cross between 20 and 50
Easy identify cross between 20 and 100
Cross between 20 and 50 is good signal for buy and sell.
Cross between 20 and 100 is confirmation signal for buy and sell.
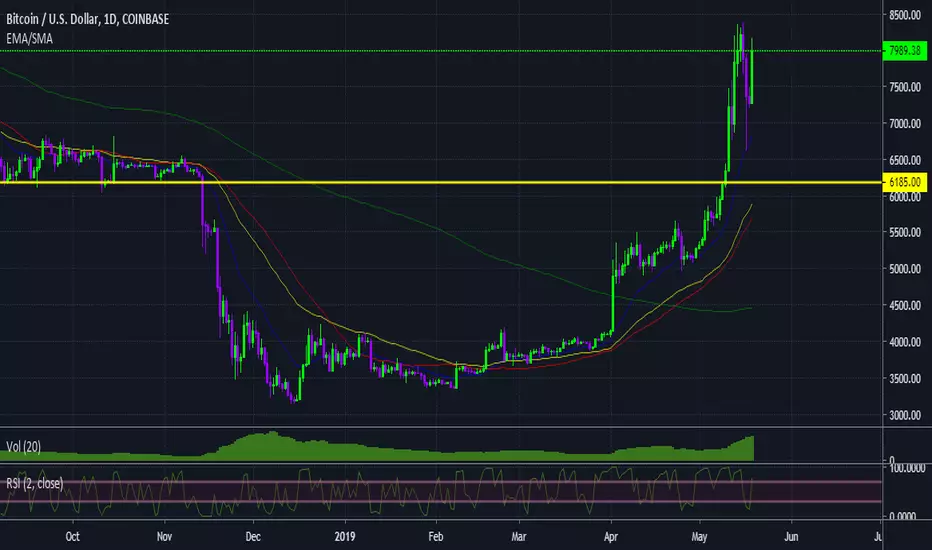
boot2thrill - EMA 20/50 & SMA 50/200//Notes:
//Version by boot2thrill on 05-20-2019.
//Version includes combined Exponential Moving Averages EMA 20/50 and Simple Moving Averages SMA 50/200.
//***Recommended use on BTCUSD 1h/4h/1d chart.***

boot2thrill - EMA 20/50 & SMA 50/200//Notes:
//Version by boot2thrill on 05-20-2019.
//Version includes combined Exponential Moving Averages (EMA) for 20/50 periods and Simple Moving Averages (SMA) for 50/200 periods.
//***Recommended use on BTCUSD 1h/4h/1d chart.***
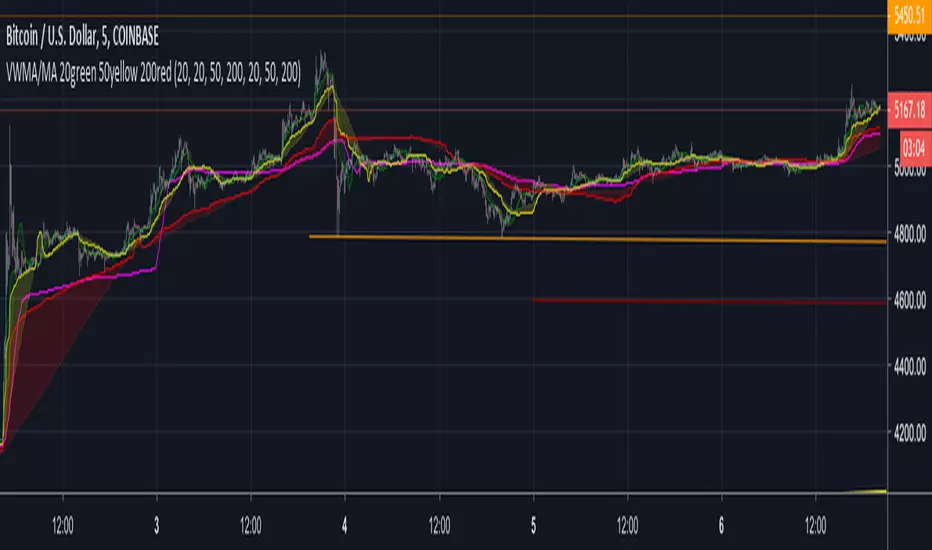
VWMA : 20 50 200Plots 20, 50 and 200 tick Volume Weighted MA and Simple MA.
The Volume Weighted MA tends to move before the SMA. I am seeing significant price movements on crypto charts near 50 VWMA crosses. As well, the 20-50 VWMA crosses. When the thicker lines ( VWMA ) are above or below the same color SMA, this divergence can also signal changes in trends.
This is my first script and likely be updated. Feedback is welcome.
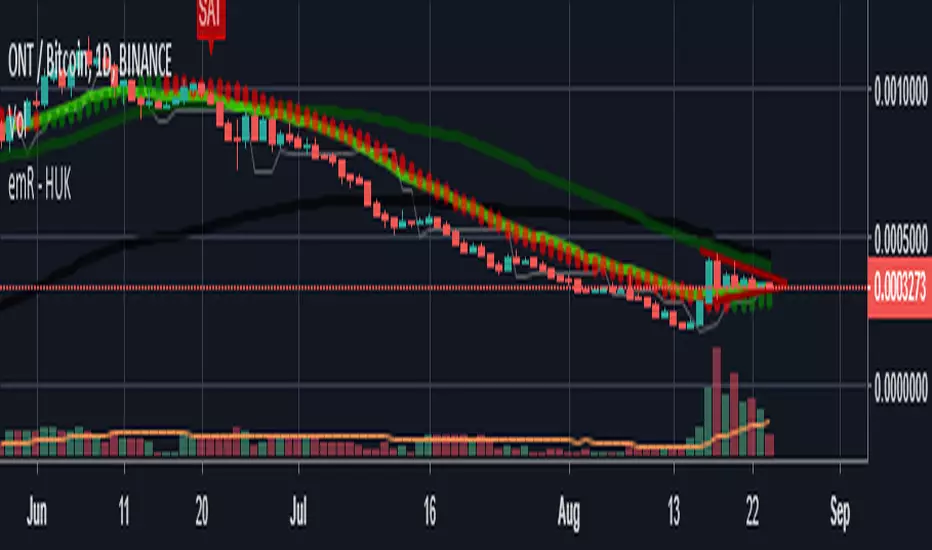
HUK ElasticVolume/50 MOVING AVERAGE e 50/200/20 Coral TrendElastic Volume Default Settings : 50 lenght!
Moving Average Default Settings:50 / 200
EMA Default Settings :20
Coral Trend Default Settings :21/0,4
Thank you ! emR Huk ..
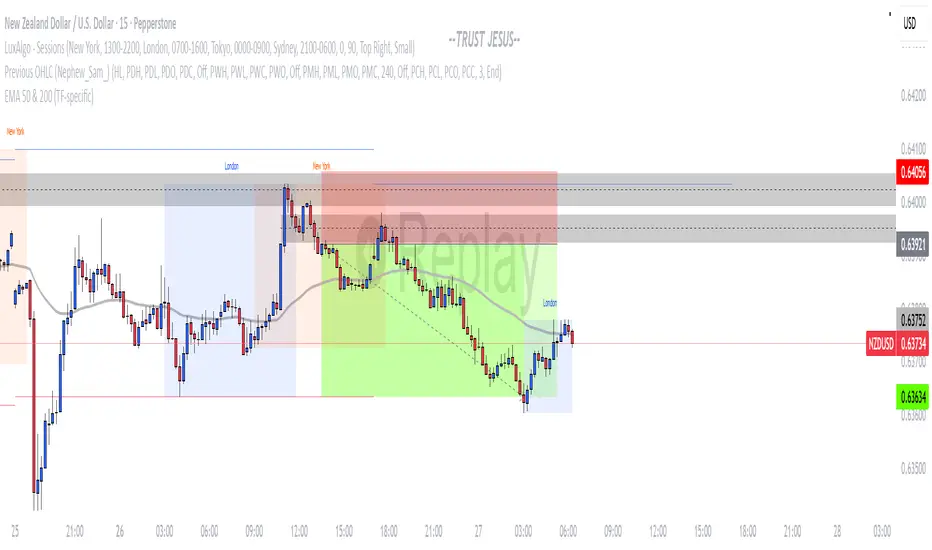
EMA 50 & 200 (TF-specific)This script plots EMA 50 and EMA 200 only on the timeframes where they matter most:
EMA 50 (gray): visible on 1H, 4H, and 12H charts – often used by intraday traders.
EMA 200 (black): visible on Daily and Weekly charts – a classic long-term trend indicator.
🔹 Why use it?
Avoids clutter by showing each EMA only on the relevant timeframe.
Helps align intraday trading with higher timeframe trends.
Simple, clean, and effective for both swing and day trading.
Session Pivots + EMA20/50 + Bollinger BandsMulti-tool indicator combining session pivots, EMA trend filters, Bollinger Bands, and alerts for intraday trading.
📌 Description
One of the biggest advantages of this indicator is that it supports TradingView’s ALERT system, so traders can be notified the moment price crosses the daily/session pivot level. This allows faster decision-making without constant chart watching.
This script combines three powerful tools into a single indicator:
Session Pivot Levels (with Support/Resistance): Automatically calculates pivot, R1–R3 and S1–S3 levels based on the previous trading session (London, New York, Asia, or custom). Levels are plotted with clean labels and connector lines so you always see the exact price values ahead of time.
EMA Trend Filters (20 & 50): Tracks short- and medium-term market direction with two popular exponential moving averages, helping confirm entries and exits.
Bollinger Bands (fully customizable): Adds volatility bands with choice of SMA, EMA, SMMA, WMA, or VWMA for the middle line, plus adjustable standard deviation and offset.
✅ Key Features
Auto-detects London, New York, and Asian sessions or set your own custom session.
Displays up to 3 levels of support and resistance from the previous session.
Clean label display with customizable theme options (Dark, Light, Custom).
Alerts included: Get notified instantly when price crosses above or below the Pivot.
EMA20/50 trend confirmation built-in.
Bollinger Bands with multiple moving average types and volatility settings.
Works for Forex, Crypto, Indices, Commodities — optimized for intraday & scalping.
This makes it a complete intraday toolkit, reducing the need to load multiple separate indicators.
📄 Full documentation available here: [ link ]

Triple EMA with Alert | 21, 50, 200 EMA Strategy + Crossover🚀 Boost your trading edge with the Triple EMA with Alert — a professional-grade indicator designed for traders who want precise, real-time trend confirmation across short, medium, and long-term market movements.
🔹 What Makes This Indicator Powerful?
Three Adjustable EMAs — Default: 21, 50, 200 periods (fully customizable 1–200).
Toggle Visibility — Show only the EMAs you need for your strategy.
Real-Time Alerts — Get notified instantly when:
EMA 1 crosses EMA 2 → short-term trend change.
EMA 2 crosses EMA 3 → medium-term trend alignment.
Works on All Markets & Timeframes — Forex, crypto, stocks, indices, and commodities.
🔹 Why Traders Love It
📊 Multi-Timeframe Trend Confirmation — Filter out noise and trade with market momentum.
🎯 Accurate Crossover Signals — Identify bullish and bearish momentum shifts.
🔔 Hands-Free Monitoring — Alerts keep you informed even when you’re away from the chart.
💡 Versatile for Any Strategy — Perfect for scalping, swing trading, or long-term investing.
🔹 How to Use It
Bullish Signal — EMA 1 crossing above EMA 2 or EMA 2 crossing above EMA 3.
Bearish Signal — EMA 1 crossing below EMA 2 or EMA 2 crossing below EMA 3.
Combine with support/resistance zones, RSI, or volume for higher probability trades.
📌 Pro Tip:
Use EMA 21 & EMA 50 for momentum confirmation.
Use EMA 200 to spot the overall market direction.
If you’re serious about trend trading with precision, the Triple EMA with Alert will keep you one step ahead of market moves — no more missed entries or exits.

EMA 8/21/50 + VWAP Crossover Alert IndicatorOverview of the Indicator
This is a custom Pine Script v5 indicator for TradingView titled "EMA 8/21/50 + VWAP Crossover Alert Indicator" (short title: "EMA+VWAP Cross Alert"). It's designed as an overlay indicator, meaning it plots directly on your price chart rather than in a separate pane. The primary purpose is to detect and alert on crossovers between the 8-period Exponential Moving Average (EMA) and the 21-period EMA, which can signal potential bullish or bearish momentum shifts. These are classic short-term trend reversal or continuation signals often used in trading strategies like momentum or swing trading.
To enhance analysis, it also includes:
A 50-period EMA for medium-term trend context (e.g., to confirm if the overall trend aligns with the crossover).
A Volume Weighted Average Price (VWAP) line, which provides a benchmark for the average price weighted by volume, useful for identifying intraday value areas or fair price levels.
The indicator works across all timeframes (e.g., Daily, 4H, 1H, 15M, 5M, 3M) because the calculations are based on the chart's current bars and adapt to volatility and data resolution. It's not a trading strategy (no entry/exit logic or backtesting), but an alert tool—signals are visual and can trigger notifications in TradingView. Always combine it with risk management, as crossovers can produce false signals in ranging or choppy markets.

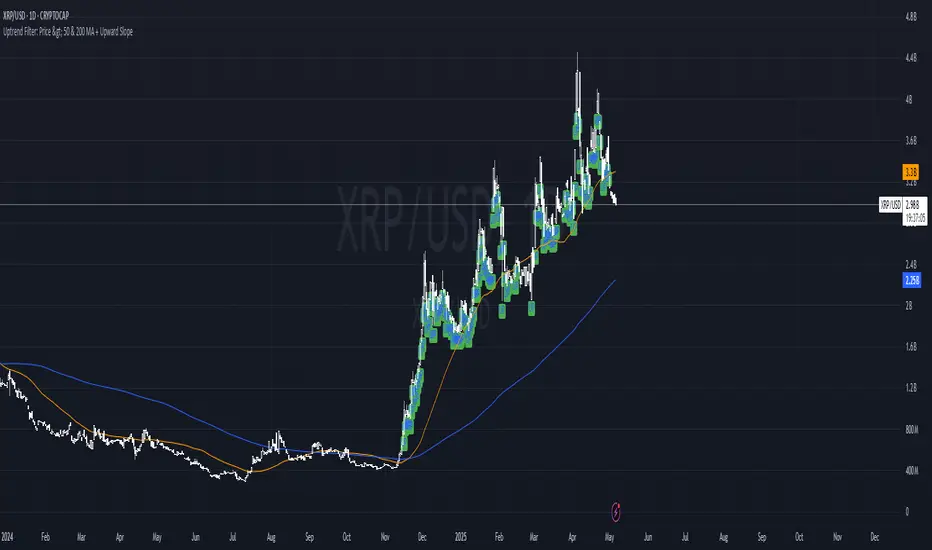
Uptrend Filter: Price > 50 & 200 MA + Upward SlopeThis indicator is designed to help traders instantly identify strong uptrend conditions based on two simple yet powerful criteria:
Price is above both the 50-day and 200-day moving averages
Both moving averages are sloping upward (positive momentum)
When both conditions are met, the indicator plots a green “UP” label below the candle, signaling a valid uptrend setup. This filter is ideal for asset selection in strategy-building, portfolio rotation, or trend-following systems.
🧠 Why it works:
The 50-day MA reflects medium-term momentum.
The 200-day MA represents the long-term trend.
When both are aligned and sloping upward, it confirms strong market structure and trend health.
🧰 Best used for:
Token screening (e.g., filtering altcoins)
Momentum-based entries
Trend confirmation
Risk filtering in strategy backtesting
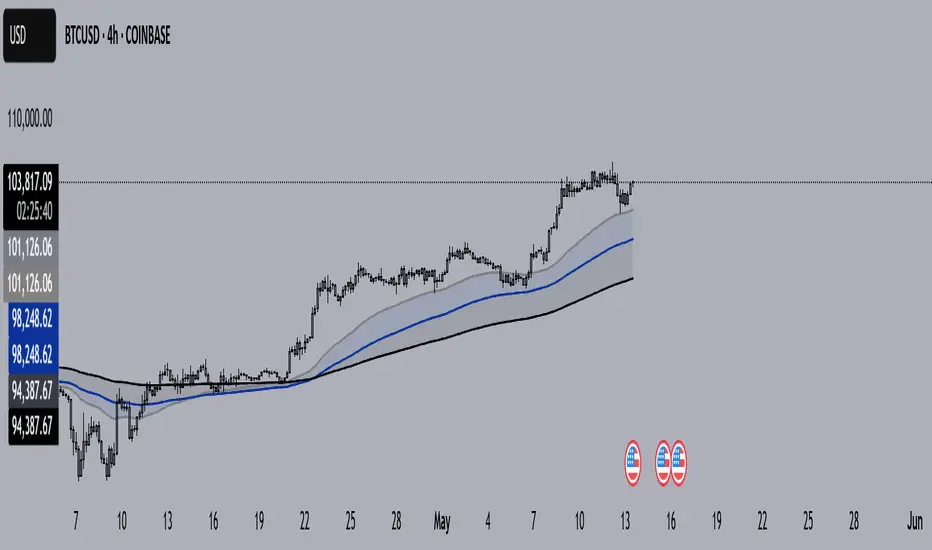
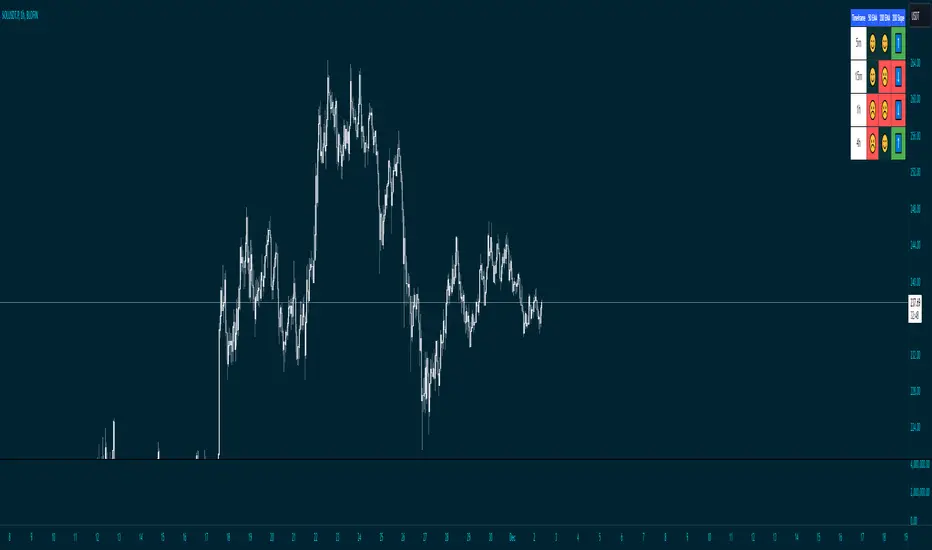
Price Above 50 and 200 EMA with Smiley faces and 200 ema slope
Overview
This advanced indicator provides a comprehensive multi-timeframe analysis of price positioning relative to 50 and 200 Exponential Moving Averages (EMAs), offering traders a quick and intuitive view of market trends across different timeframes.
Key Features
Multi-Timeframe Analysis: Simultaneously evaluates price behavior across 5m, 15m, and other selected timeframes
EMA Trend Visualization: Instantly shows whether price is above or below 50 and 200 EMAs
Slope Direction Indicator: Tracks the directional momentum of the 200 EMA
Customizable Distance Metrics: Option to display distances as absolute values or percentages
Emoji-Based Indicators: Quick visual representation of price positioning
Functionality
The indicator uses color-coded and emoji-based signals to represent:
😊 (Blue): Price is above the EMA
☹️ (Red): Price is below the EMA
⬆️ (Blue): EMA slope is positive
⬇️ (Red): EMA slope is negative
Customization Options
Adjustable EMA periods
Togglable distance display
Distance representation (percentage or absolute value)
Best Used For
Trend identification
Multi-timeframe analysis
Quick market sentiment assessment
Supplementing other technical analysis tools
Recommended Timeframes
Intraday trading
Swing trading
Trend following strategies
Risk Disclaimer
This indicator is a tool for analysis and should not be used in isolation for trading decisions. Always combine with other technical and fundamental analysis, and proper risk management.
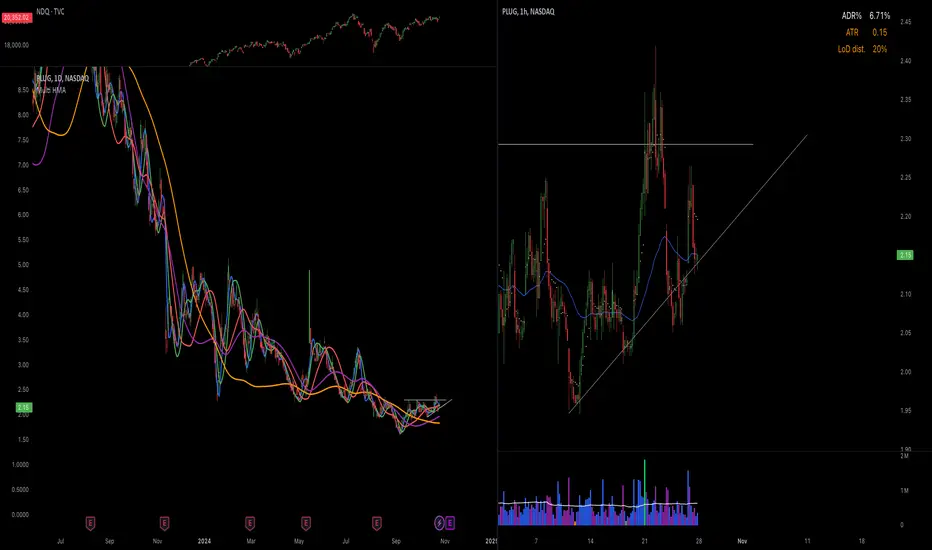
Hull Moving Averages 10, 20, 50, 100, 200This script generates multiple Hull Moving Averages (HMAs) on a trading chart, allowing for comprehensive trend analysis across different timeframes. Five HMAs with lengths of 10, 20, 50, 100, and 200 periods are plotted on the chart, providing insights into short, medium, and long-term market trends.
Each HMA can be customized with individual colors to easily distinguish between the different timeframes, helping traders visually track momentum changes and trend strength across these intervals. The Hull Moving Average is known for reducing lag compared to other moving averages, which makes it particularly useful for identifying turning points more accurately.
With this script:
You can adjust the colors of each HMA line individually, ensuring optimal visual differentiation.
You can analyze short-term trends with HMA 10 and HMA 20, medium-term trends with HMA 50, and long-term trends with HMA 100 and HMA 200.
The chart provides an at-a-glance view of multi-timeframe trends, making it useful for trading strategies that rely on crossovers or divergence patterns.
This tool is ideal for traders who want to identify trend direction, strength, and possible reversal points with minimal lag.
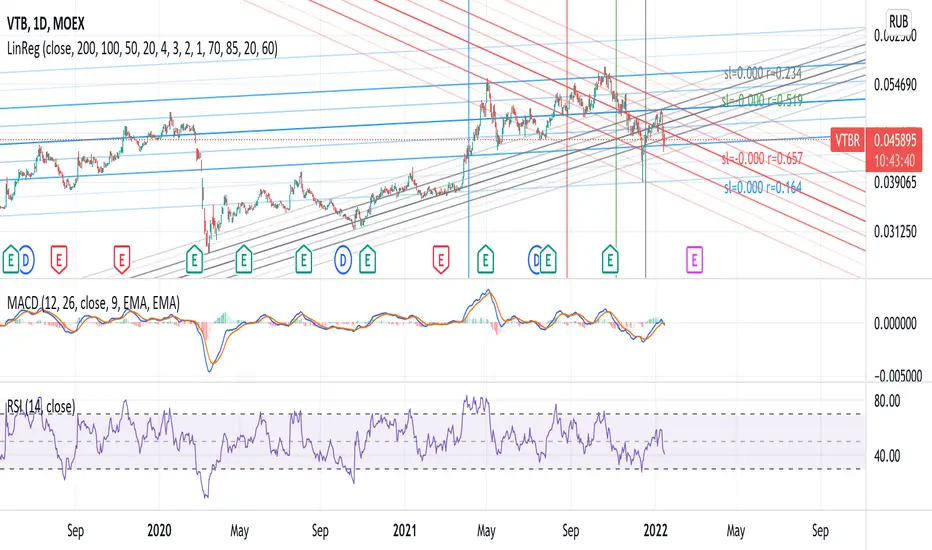
Linear Regression 200/100/50/20Four time frames in one indicator in different colors, showing current price trend in different scopes.
If the slope of the smaller time frame is in a (0,75;1,25) interval of some of the bigger ones the smaller one is omitted (different signs near zero are not coalesced in that way though).
Every time frame has four deltas of range in trend lines of different grade of transparency (2-1-4-3), as well as a vertical line denoting regression date range start, also bearing the same color (blue-red-green-gray for 200/100/50/20).
On the right of the latest bar are Pearson coefficients and slopes of the regressions, 200/100/50/20 bottom-up, also appropriately colored.
McClellan Oscillator for nifty 50This is a indicator which indicates breath of the market.
If found relevant do let me know!!
Only handpicked relevant 20 stocks (20 +ve indicator+ 20 -ve indicator) from different sector .
As there is the limit of 40 script allowed only.
Further modifications might be there if the limit is increased to 100 (50 +50 indicator) .

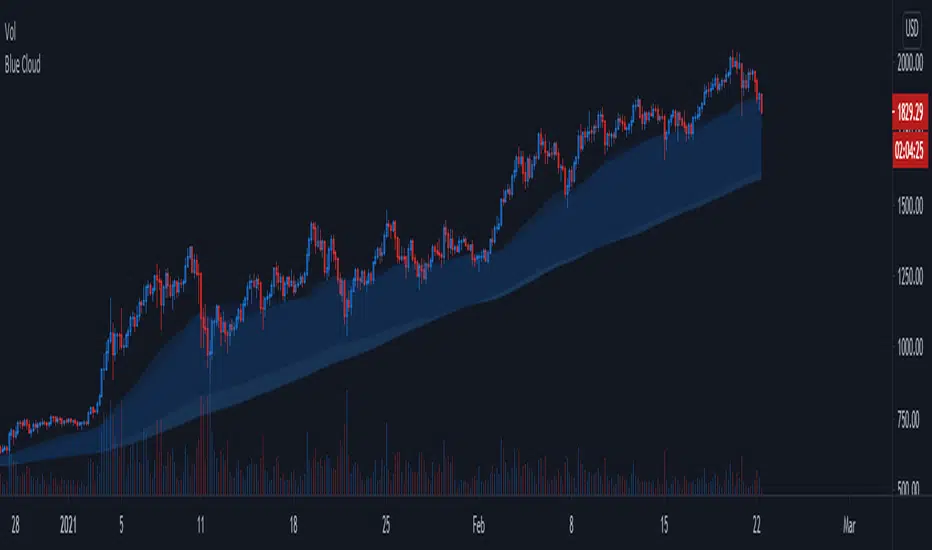
Blue CloudTrend Indicator
- Based on 4h 50/200 ma/ema
- Static, same accross all timeframes
- Works best with trending assets (espacially altcoins)
- 4h 50/200 ma/ema 's are transparent by default but can be enabled to improve visibility
Blue Cloud = Bullish, cloud often acts as support
Red Cloud = Bearish, cloud often acts as resistance