ORB Breakout Traffic Signal (5/15/30)ORB Breakout Traffic Signal (5/15/30)
This indicator visualizes Opening Range Breakouts (ORB) for the first 5, 15, and 30 minutes of the US regular trading session (09:30–16:00 ET).
It provides a compact, easy-to-read traffic signal table on your chart to show whether price is breaking out, breaking down, or consolidating inside the range.
🔑 Features
Auto-anchors at 09:30 ET (converted to your local time automatically).
Tracks ORB High/Low for:
5-minute window (09:30–09:34)
15-minute window (09:30–09:44)
30-minute window (09:30–09:59)
Displays results in a compact table:
↑ (green) → price has broken above the ORB high
↓ (red) → price has broken below the ORB low
• (gray) → price remains inside the ORB range (optional; can be disabled)
Customizable:
Toggle which ORBs to show (5m, 15m, 30m)
Choose table position (top/bottom left/right)
Adjustable text size
Option to plot the ORB High/Low lines on your chart
📌 Usage
Designed for intraday traders watching US equities/ETFs/futures.
Works best on 1-minute or 5-minute charts with Extended Hours turned OFF (so the session starts exactly at 09:30 ET).
Helps you quickly spot early breakouts (5m), mid-session trends (15m), or confirmed directional moves (30m).
⚠️ Notes
Signals only update during the RTH session
Outside market hours, the last locked ORB and signal remain displayed until the next open.
This tool is for analysis/visualization only; not a buy/sell signal. Always combine with your own trading strategy and risk management.
👉 Perfect for traders who want a quick visual confirmation of whether price is breaking out of the opening range or stuck inside it.
Cari dalam skrip untuk "股票开盘前15分钟交易规则"

Correlation MA – 15 Assets + Average (Optional)This indicator calculates the moving average of the correlation coefficient between your charted asset and up to 15 user-selected symbols. It helps identify uncorrelated or inversely correlated assets for diversification, pair trading, or hedging.
Features:
✅ Compare your current chart against up to 15 assets
✅ Toggle assets on/off individually
✅ Custom correlation and MA lengths
✅ Real-time average correlation line across enabled assets
✅ Horizontal lines at +1, 0, and -1 for easy visual reference
Ideal for:
Portfolio diversification analysis
Finding low-correlation stocks
Mean-reversion & pair trading setups
Crypto, equities, ETFs
To use: set the benchmark chart (e.g. TSLA), choose up to 15 assets, and adjust settings as needed. Look for assets with correlation near 0 or negative values for uncorrelated performance.

Rawstocks 15 Minute ModelRawstocks 15-Minute Model
The Rawstocks 15-Minute Model is a precision intraday trading strategy designed for the US stock market (9:30 AM - 4:00 PM ET), optimized for the 15-minute timeframe. It combines institutional order flow concepts with Fibonacci retracements to identify high-probability reversal setups while enforcing strict risk management and session-based rules.
Key Features
Time-Based Execution
Trading Hours: 9:30 AM - 4:00 PM ET (no new entries after 4:00 PM)
Force Close: All positions auto-exit at 4:30 PM ET (prevents overnight risk)
Entry Logic
Order Block + Fib Confluence:
Identifies institutional order blocks (previous swing highs/lows)
Requires price pullback to 61.8% or 79% Fibonacci level
Liquidity Confirmation:
Waits for stop runs (liquidity sweeps) before reversal entries
Exit Rules
Stop Loss: 1x ATR (14) from entry
Take Profit: 2:1 Risk-Reward (adjustable)
Visual Signals
Green Triangle: Valid long setup (pullback to bullish OB + Fib)
Red Triangle: Valid short setup (pullback to bearish OB + Fib)
Blue/Purple Background: Highlights active trading vs. close period
How It Works
Identify the Setup
Wait for a strong impulse move (break of structure)
Mark the order block (institutional zone)
Confirm Pullback
Price must retrace to 61.8% or 79% Fib level
Must occur within trading hours (9:30 AM - 4:00 PM)
Enter on Confirmation
Long: Break of pullback candle high (stop below recent swing low)
Short: Break of pullback candle low (stop above recent swing high)
Manage the Trade
Trail stop or exit at 2R (risk-to-reward)
All positions close at 4:30 PM sharp

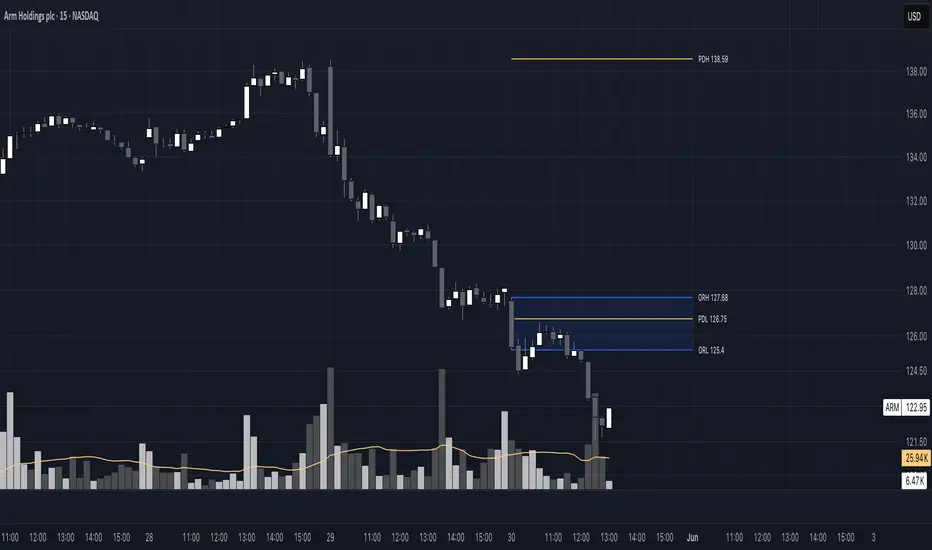
Previous Day Max 15-Mins Move High/LowIntroduction
This TradingView script is designed to help traders quickly identify significant price movement levels from the previous trading day based on the 15-minute time frame. It finds the largest high-to-low range of any 15-minute candle from the prior day and draws horizontal lines at those levels. These levels can help traders set potential support and resistance zones, aiding in intraday trading decisions and market analysis.
In many trading strategies, significant levels from previous sessions are crucial for determining potential support and resistance points. By identifying the largest price move from the prior day’s 15-minute candles, this script can highlight areas of market interest where volatility was at its highest. Traders can use these levels to:
Anticipate potential reversal points.
Plan entries and exits based on key support and resistance.
Gauge market sentiment by observing how the price reacts to these levels during the current session.
This can be especially valuable in fast-paced trading environments or when analyzing shorter time frames. The lines extend across all time frames, so you can use this script on higher time frames as well to see previous-day levels while zooming out.

ORB 15 Min By EquityDurai#Let the index/stock trade for the first fifteen minutes and then use the high and low of this "fifteen minute range" as support and resistance levels.
#A buy signal is given when price exceeds the high of the 15 minute range after an up gap.
#A sell signal is given when price moves below the low of the 15 minute range after a down gap.
#It's a simple technique that works like a charm in many cases.
>If you use this technique, though, a few caveats are in order to avoid whipsaws and other market traps.
>The most common whipsaw is a trading range that lasts longer than 15 minutes.
>If an obvious range builds in 20, 25 or even 30 minutes , use those to define your support and resistance levels.
>Also consider the higher noise level in the morning.
>A breakout that extends only a tick or two can be easily reversed and trap you in a sudden loss.
>So let others take the bait at these levels, while you find pullbacks and narrow range bars for trade execution.

[naoligo] 12x MA DT (5, 15, 30 & 60)This indicator is based on "Generic 8x MA Plotter", by @LazyBear.
It is also based on my own indicator "10x MA (H, D, W, M)", which is good for Swing Trading and/or Position.
This one is focused in daytrade and it will plot three Moving Averages based on current time interval (under 5 minutes) and nine based on chosen periods by 5, 15, 30 and 60 minutes. You will be able to see where is, for example, a 50 period's SMA of 15 minutes when using a 2 minutes time interval chart. I find it very useful to analyze, in a snap, possible price ranges and enter/exit points. All reference values are from setups known and used by daytraders.
you can choose between EMA or SMA (default: SMA) for each time interval, that are distributed in:
3x MA current time interval;
3x MA 5 minutes;
2x MA 15 minutes;
2x MA 30 minutes;
2x MA 60 minutes.
I've tried to keep the code as simple as possible, so you can increase the number of MA or modify the type for each time interval.
Cons: Use it wisely, because if you choose to plot all the 12 Moving Averages, it will may consume a lot of your navigator resources.
Enjoy!

Opening Range Breakout (15 mins Range)Take the guesswork out of your trading with the Opening Range Breakout Pro script. This tool automatically marks the high and low of the first 15 minutes of the NYSE session, then highlights the first candle to break out above or below this range—removing ambiguity from your trade entries.
The opening range is one of the most powerful concepts in day trading. By identifying the price range set during the market’s first minutes, you gain a clear framework for your trades. When price breaks out above the range, it often signals a strong bullish move; a break below signals bearish momentum. This script visually marks these moments, so you can react quickly and confidently.
Why use Opening Range Breakout Pro?
• Defined Entry and Exit Points: The script gives you clear, objective breakout levels—no more guessing when to enter a trade.
• Removes Emotional Trading: With visual cues for breakouts, you can follow a systematic approach and avoid hesitation or FOMO.
• Backtested, Time-Tested Strategy: The opening range breakout has been used by professional traders for decades to capture early trends and maximize profit potential.
• High Reward Potential: By capitalizing on the volatility and momentum of the opening session, traders often catch the best moves of the day.
• Easy to Use: Just add to your chart—no configuration needed. The script works on any NYSE stock, on a 5-minute chart.
How it works:
• Draws the opening 15-minute high and low as orange lines.
• Labels the range prices for quick reference.
• Marks the first candle to close above the range with an orange ▲, and the first to close below with an orange ▼.
Take control of your trading day, remove uncertainty, and trade with confidence—just like the pros.

Gold ORB Strategy (15-min Range, 5-min Entry)The Gold ORB (Opening Range Breakout) Strategy is designed for day traders looking to capitalize on the price action in the early part of the trading day, specifically using a 15-minute range for identifying the opening range and a 5-minute timeframe for breakout entries. The strategy trades the Gold market (XAU/USD) during the New York session.
Opening Range: The strategy defines the Opening Range (ORB) between 9:30 AM EST and 9:45 AM EST using the highest and lowest points during this 15-minute window.
Breakout Entries: The strategy enters trades when the price breaks above the ORB high for a long position or below the ORB low for a short position. It waits for a 5-minute candle close outside the range before entering a trade.
Stop Loss and Take Profit: The stop loss is placed at 50% of the ORB range, and the take profit is set at twice the ORB range (1:2 risk-reward ratio).
Time Window: The strategy only executes trades before 12:00 PM EST, avoiding late-day market fluctuations and consolidations.

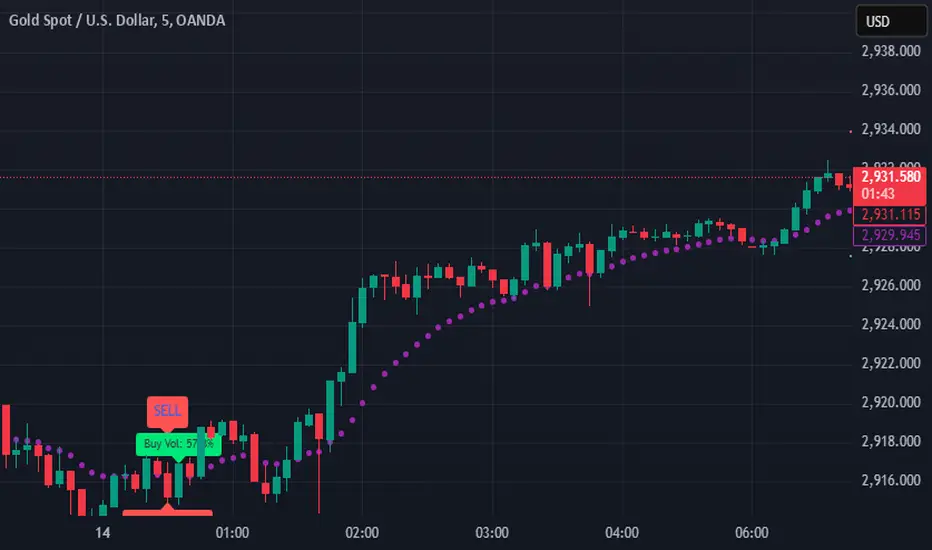
SIOVERSE EMA 15 with Buy/Sell Signals, Support & ResistanceThis Pine Script indicator is designed for TradingView and combines Exponential Moving Averages (EMAs), support and resistance levels, buy/sell signals, and volume percentage labels filtered by buy/sell conditions. It is a comprehensive tool for traders who want to analyze price trends, identify key levels, and make informed decisions based on volume and EMA crossovers.
Key Features of the Indicator
EMA 15 (Purple Dashed Line):
A 15-period Exponential Moving Average (EMA) is plotted on the chart as a dashed purple line.
This EMA helps traders identify short-term trends and potential entry/exit points.
Hidden EMA 21 and EMA 34:
The 21-period and 34-period EMAs are calculated but not displayed on the chart.
These EMAs are used to generate buy and sell signals based on crossovers.
Buy/Sell Signals:
Buy Signal: Occurs when the EMA 21 crosses above the EMA 34. A green "BUY" label is displayed below the candle.
Sell Signal: Occurs when the EMA 21 crosses below the EMA 34. A red "SELL" label is displayed above the candle.
These signals help traders identify potential trend reversals or continuations.
Support and Resistance Levels:
Support: The lowest price level over the last lookback_period candles, plotted as a green dashed horizontal line.
Resistance: The highest price level over the last lookback_period candles, plotted as a red dashed horizontal line.
These levels help traders identify key price zones for potential breakouts or reversals.
Volume Percentage Labels (Filtered by Buy/Sell Signals):
The volume percentage is calculated relative to the average volume over the last volume_lookback candles.
Buy Volume Label: When a buy signal occurs, a green label is displayed above the candle with the text "Buy Vol: X.XX%", where X.XX is the volume percentage.
Sell Volume Label: When a sell signal occurs, a red label is displayed below the candle with the text "Sell Vol: X.XX%", where X.XX is the volume percentage.
These labels help traders assess the strength of the buy/sell signals based on volume.
Alerts:
Alerts are triggered when buy or sell signals occur, notifying traders of potential trading opportunities.
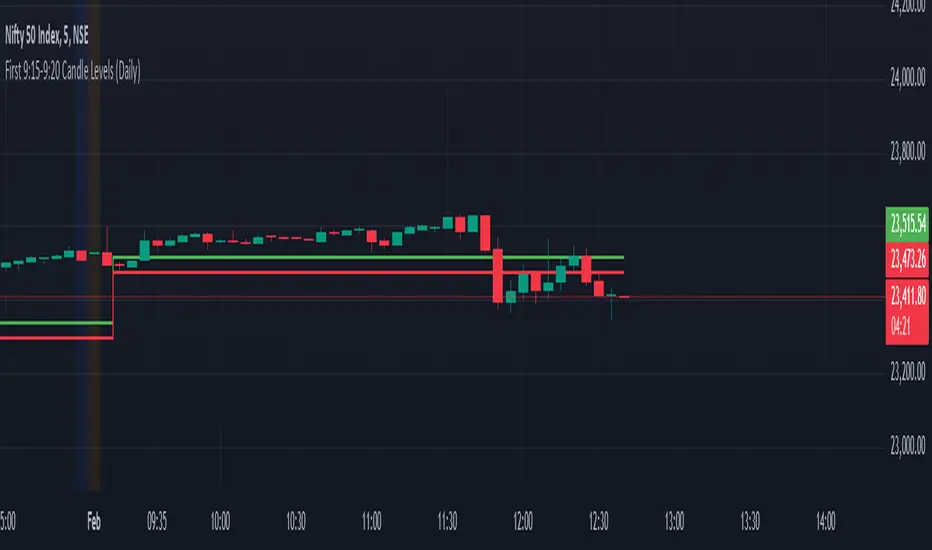
First 9:15-9:20 Candle Levels (Daily)This indicator captures the closing price of the first 5-minute candle (9:15 - 9:20 AM) every trading day. It then calculates 0.09% above and below this closing price and plots horizontal lines. The indicator resets daily at 9:15 AM, ensuring it always tracks the latest market open. After 9:20 AM, the calculated levels remain visible throughout the day. The upper level is displayed in green, while the lower level is in red. This tool helps traders identify key price levels early in the session, useful for setting stop-losses, take-profit zones, or identifying potential breakout points.
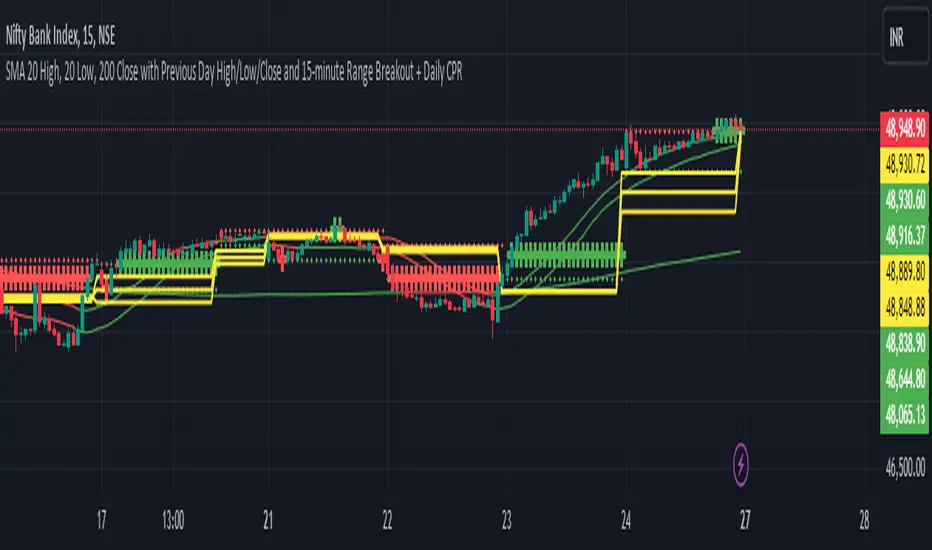
20,200SMA,PDHL,15 minute ORBSimple Moving Averages (SMAs):
The script calculates three SMAs: SMA 20 High, SMA 20 Low, and SMA 200 Close. These moving averages are widely used in technical analysis to smooth out price data and identify trends.
The SMA for the high price (SMA 20 High) is calculated based on the 20-period moving average of the high prices.
Similarly, the SMA for the low price (SMA 20 Low) is calculated based on the 20-period moving average of the low prices.
The SMA for the close price (SMA 200 Close) is calculated based on the 200-period moving average of the closing prices.
Each SMA is plotted on the chart, and their colors are determined based on whether the current close price is above or below each respective SMA.
Conditional Coloring:
The script employs conditional coloring to visually highlight whether the close price is above or below each SMA.
If the close price is below the SMA 20 High, it's plotted in red; otherwise, it's plotted in green.
Similarly, the SMA 20 Low and SMA 200 Close are plotted with conditional colors based on the relationship between the close price and each respective SMA.
Previous Day's Data:
The script retrieves and plots the high, low, and close prices of the previous trading day.
This provides traders with valuable information about the previous day's market behavior, which can influence trading decisions.
Opening 15-minute Range Breakout:
The script calculates the high and low prices during the first 15 minutes of each trading day.
These prices represent the opening range for the day.
It then determines whether the current close price is above or below this opening range and plots it accordingly.
This breakout strategy helps traders identify potential trading opportunities based on early price movements.
By integrating these components, the script offers traders a comprehensive analysis of market trends, previous day's performance, and potential breakout opportunities. Its originality lies in the combination of these features into a single, easy-to-use indicator, providing valuable insights for trading decisions.
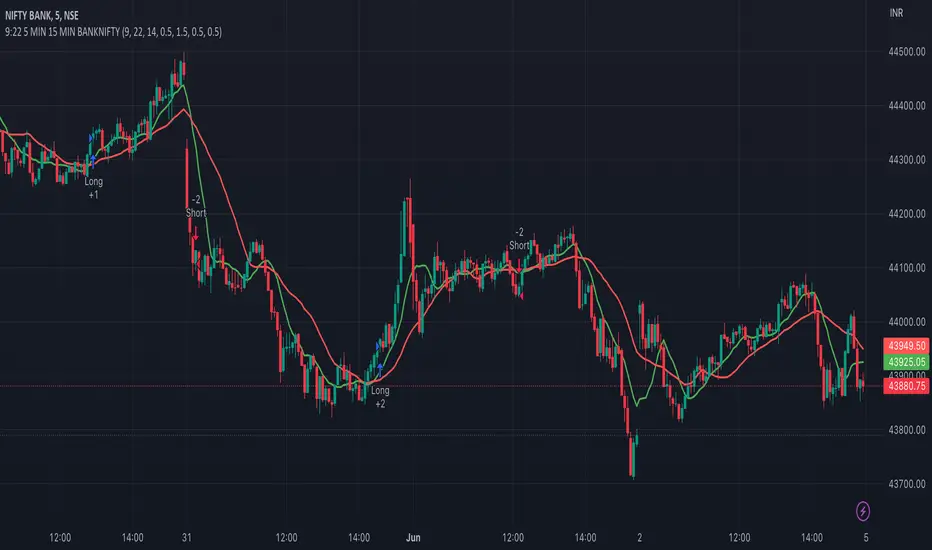
9:22 5 MIN 15 MIN BANKNIFTY9:22 5 MIN 15 MIN BANKNIFTY Strategy with Additional Filters
The 9:22 5 MIN 15 MIN BANKNIFTY Strategy with Additional Filters is a trend-following strategy designed for trading the BANKNIFTY instrument on a 5-minute chart. It aims to capture potential price movements by generating buy and sell signals based on moving average crossovers, breakout confirmations, and additional filters.
Key Features:
Fast MA Length: 9
Slow MA Length: 22
ATR Length: 14
ATR Filter: 0.5
Trailing Stop Percentage: 1.5%
Pullback Threshold: 0.5
Minimum Candle Body Percentage: 0.5
Use Breakout Confirmation: Enabled
Additional Filters:
Volume Threshold: Set a minimum volume requirement for trades.
Trend Filter: Optionally enable a trend filter based on a higher timeframe moving average.
Momentum Filter: Optionally enable a momentum filter using the RSI indicator.
Support/Resistance Filter: Optionally enable a filter based on predefined support and resistance levels.
Buy and Sell Signals:
Buy Signal: A buy signal is generated when the fast moving average crosses above the slow moving average, with additional confirmation from breakout and volume criteria, along with optional trend, momentum, and support/resistance filters.
Sell Signal: A sell signal is generated when the fast moving average crosses below the slow moving average, with similar confirmation and filtering criteria as the buy signal.
Exit Strategy:
The strategy employs a trailing stop-loss mechanism based on a percentage of the average entry price. The stop-loss is dynamically adjusted to protect profits while allowing for potential upside.
Please note that this strategy should be thoroughly backtested and evaluated in different market conditions before applying it to live trading. It is also recommended to adjust the parameters and filters according to individual preferences and risk tolerance.
Feel free to customise and adapt the description as needed to suit your preferences and the specific details of your strategy.
(IK) Stoch-60-15This strategy uses 60 minute and 15 minute stochastic data to determine entry and exit; it only executes long trades. I've only used this on BTC/USD, but I imagine the concepts employed should hold for any ticker
The script builds a simple Stochastic indicator for the current timeframe, and it also plots a single stochastic line for a higher resolution time frame. I've found good results trading on 15 minutes with a 60 minute higher resolution.
We enter a trade if the higher resolution stochastic is in an uptrend, if the current resolution stochastic is in an uptrend, and if the current stochastic value is less than 50.
We exit a trade when the current stochastic value crosses below 80 or the trailing stop loss is hit.
Stop loss is calculated with the input value, Stop Loss Percent. This value represents the percent of capital you're willing to lose before exiting a trade. A stop loss percent of 0.050 means your trade will exit if it falls 5% from the highest high since entering a trade. You will have at least 95% of your original capital left. There is no option to change a trailing stop loss to a set stop loss (in order to keep the code as simple as possible), however, you can turn it off by setting Stop Loss Percent to 1.
I tried to keep the script itself lightweight and very easy to understand, so it's not very customizable in regards to input options. You can change stochastic data, as well as the trailing stop percentage. The script can be adjusted to other timeframes, however this requires a small change in the code (details in script comments). Changing just the "Higher Resolution" input will not produce expected results
My hope is that by keeping it lightweight and simple, it will be easier for you to adjust to your specific needs, or work into a larger strategy.

Booming Bull 15 Min StrategyBooming Bull 15 Min strategy
Conditions
First 15 min candle high-low must be less than .75%
Next candle is crossing either high or low

Gap driven intraday trade (better in 15 Min chart)// Based on yesterday's High, Low, today's open, and Bollinger Band (20) in current minute chart,
// Defined intraday Trading opportunity: Stop, Entry, T0, Target (S.E.T.T)
// Back test in 60, 30, 15, 5 Min charts with SPY, QQQ, XOP, AAPL, TSLA, NVDA, UAL
// In 60 and 30 min chart, the stop and target are too big. 5 min is too small.
// 15 min Chart is the best time frame for this strategy;
// -------------------------------------------------------------------------------
// There will be Four lines in this study:
// 1. Entry Line,
// 1.1 Green Color line to Buy, If today's open price above Yesterday's High, and current price below BB upper line.
// 1.2 Red Color line to Short, if today's open price below Yesterday's Low, and current above BB Lower line.
//
// 2. Black line to show initial stop, one ATR in current min chart;
//
// 3. Blue Line (T0) to show where trader can move stop to make even, one ATR in current min chart;
//
// 4. Orange Line to show initial target, Three ATR in current min chart;
//
// Trading opportunity:
// If Entry line is green color, Set stop buy order at today's Open;
// Whenever price is below the green line, Prepare to buy;
//
// If Entry line is Red color, Set Stop short at today's Open;
// Whenever price is above the red line, Prepare to short;
//
// Initial Stop: One ATR in min chart;
// Initial T0: One ATR in min chart;
// Initial Target: Three ATR in min chart;
// Initial RRR: Reward Risk Ratio = 3:1;
//
// Maintain: Once the position moves to T0, Move stop to "Make even + Lunch (such as, Entry + $0.10)";
// Allow to move target bigger, such as, next demand/supply zone;
// When near target or demand/supply zone or near Market close, move stop tightly;
//
// Close position: Limit order filled, or near Market Close, or trendline break;
//
// Key Step: Move stop to "Make even" after T0, Do not turn winner to loser;
// Willing to "in and out" many times in one day, and trade the same direction, same price again and again.
//
// Basic trading platform requests:
// To use this strategy, user needs to:
// 1. Scan Stocks Before market open:
// Prepare a watch list for top 10 ETF and Top 90 stocks which are most actively traded.
// Stock might be limited by price range, Beta, optionable, ...
// Before market open, Run a scan for these stocks, find which has GAP and inside BB;
// create watch list for that day.
//
// 2. Attach OSO and OCO orders:
// User needs to Send Entry, Stop (loss), and limit (target) orders at one time;
// Order Send order ( OSO ): Entry order sends Stop order and limit order;
// Order Cancel order ( OCO ): Stop order and limit order, when one is filled, it will cancel the other instantly;

NY Open 15-Minute Range - Current Day OnlyV1.0
This script shows the NY opening range for the first 15 min overlayed on the chart. This is only for the current day.

Moving Averages 7 & 15 & 50 & 100 & 200 & 400we can use 7 moving averages for one indicator.
base moving averages are 7, 15, 50, 100, 200 and 400.
it can be used for determining of trend
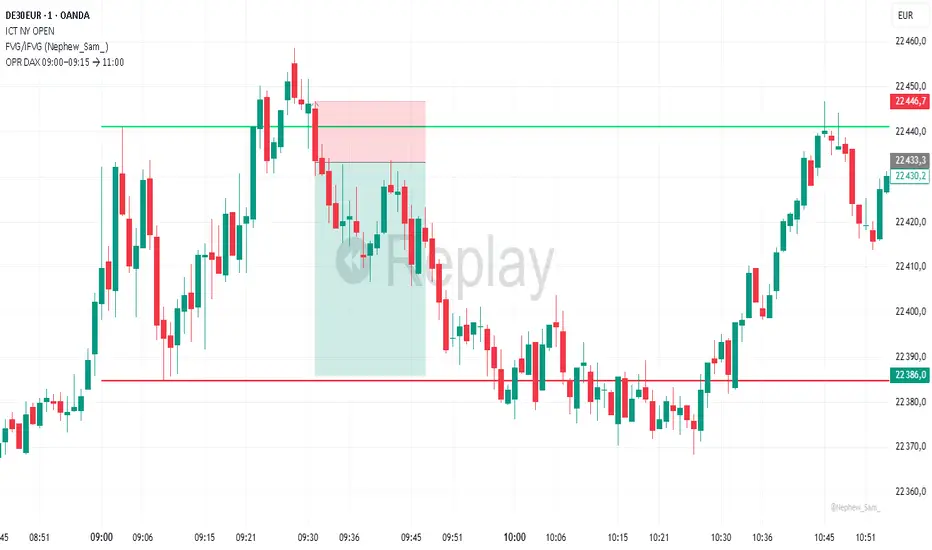
OPR DAX 09:00–09:15 → 11:00 Nico VThis indicator plots on the DAX each day:
The high (green) and low (red) of the 09:00 → 09:15 Berlin time range.
These levels are extended horizontally until 11:00.
Optionally, it displays the midpoint as a white dashed line.
Purpose: to quickly identify the morning opening range (OPR) and observe how price reacts to these levels during the rest of the morning.
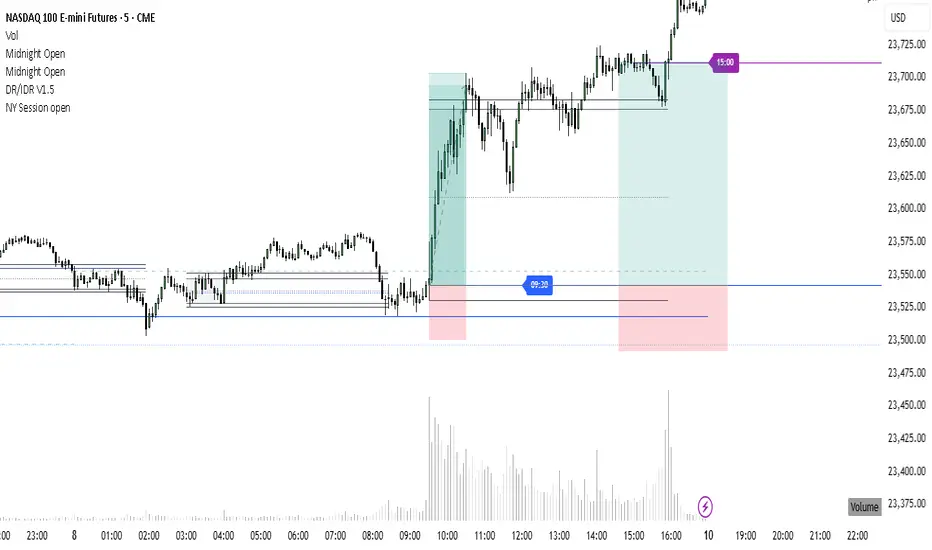
NY Session open 9:30 and bond market close at 15:00NY Session open 9.30 and bond market close at 15:00
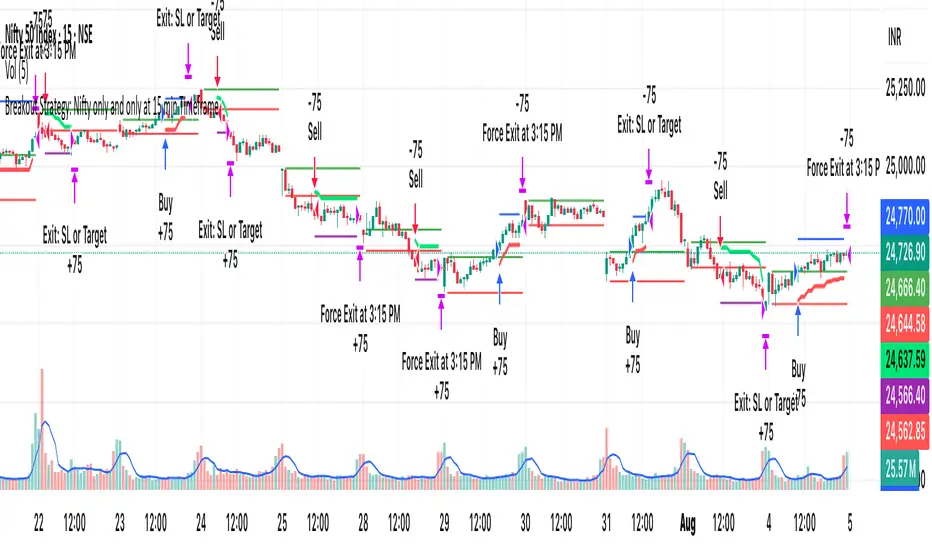
[PS]Breakout Strategy: Nifty/BN only at 15 min TimeframeIt only works on 15 min timeframe for nifty and Bank nifty.
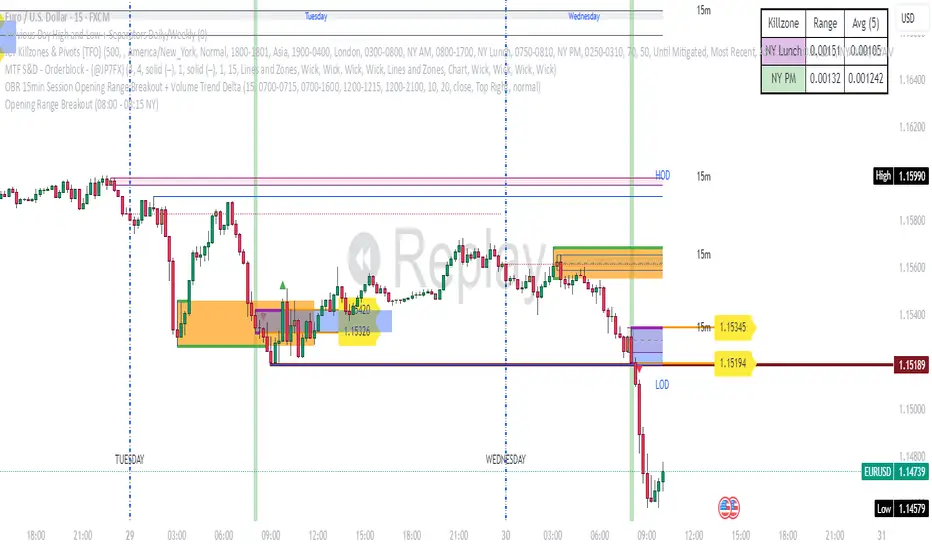
Opening Range Breakout (08:00 - 08:15 NY) - AAPNIndicador que marca la apertura de Forex en NY a 15 minitos, la primera vela
Opening Range 15 minThis indicator highlights the Opening Range (OR) for the first 15 minutes (9:30–9:45 AM EST). It visually plots high/low lines and a shaded box to define this range, helping traders identify key intraday levels for potential breakout or rejection scenarios. The script also provides optional overlays for the Previous Day’s High/Low and the Extended Hours High/Low, offering a complete context for day trading setups.
Main Features:
Opening Range Detection – Automatically calculates and draws the high/low of the 9:30–9:45 AM session.
Visual Enhancements – Includes customizable lines, shaded boxes, and labels to mark the OR high (ORH) and low (ORL) levels.
Previous Day High/Low (Optional) – Plots and labels the previous day's high and low for reference during current day trading.
Extended Hours High/Low (Optional, when ETH enabled) – Displays overnight session levels for added insight into early volatility (4:00 AM to 9:30 AM EST).
User Customization – Easily adjust colors, label styles, and visibility for all plotted levels and regions.