Candle Wick Shadows [UkutaLabs]█ OVERVIEW
The Candle Wick Shadows Indicator identifies untested wicks in real time that occur when there is an imbalance in the number of buyers and sellers at a price-level. This imbalance occurs when a market exchange receives too many of one kind of order, and not enough of its counterpoint.
Candle Wick Shadows is a powerful trading indicator that will automatically identify and label strong ranges on traders’ charts that can be incorporated into a wide variety of different trading strategies.
█ USAGE
The script automatically identifies and measures real-time ranges of imbalance between buying and selling pressure in the market using real-time price-action information. These levels indicate potential Supply and Demand zones which serve to help the trader identify areas where price has changed direction in the past due to an imbalance of buyers and sellers.
The script also allows users to mirror higher time frame Candle Wick Shadows onto lower time frame charts to gain a stronger understanding of key levels on another scale.
█ SETTINGS
Configuration
- Show Labels: Determines whether or not identification labels are drawn on the chart.
- Max CWS Display: Determines the number of Candle Wick Shadows that will be drawn on the chart. This is for each higher timeframe option that is toggled, not the total.
Current Time Frame
-Wick Shadow (On/Off): Determines whether or not wick shadows are drawn from the current time frame chart.
- Bullish Color: Determines the color of bullish wick shadows from the current time frame.
- Bearish Color: Determines the color of bearish wick shadows from the current time frame.
5 Minute (Higher Timeframe)
-Wick Shadow (On/Off): Determines whether or not wick shadows are drawn from the 5 minute time frame chart.
- Bullish Color: Determines the color of bullish wick shadows from the 5 minute time frame.
- Bearish Color: Determines the color of bearish wick shadows from the 5 minute time frame.
15 Minute (Higher Timeframe)
-Wick Shadow (On/Off): Determines whether or not wick shadows are drawn from the 15 minute time frame chart.
- Bullish Color: Determines the color of bullish wick shadows from the 15 minute time frame.
- Bearish Color: Determines the color of bearish wick shadows from the 15 minute time frame.
30 Minute (Higher Timeframe)
-Wick Shadow (On/Off): Determines whether or not wick shadows are drawn from the 30 minute time frame chart.
- Bullish Color: Determines the color of bullish wick shadows from the 30 minute time frame.
- Bearish Color: Determines the color of bearish wick shadows from the 30 minute time frame.
60 Minute (Higher Timeframe)
-Wick Shadow (On/Off): Determines whether or not wick shadows are drawn from the 60 minute time frame chart.
- Bullish Color: Determines the color of bullish wick shadows from the 60 minute time frame.
- Bearish Color: Determines the color of bearish wick shadows from the 60 minute time frame.
240 Minute (Higher Timeframe)
-Wick Shadow (On/Off): Determines whether or not wick shadows are drawn from the 240 minute time frame chart.
- Bullish Color: Determines the color of bullish wick shadows from the 240 minute time frame.
- Bearish Color: Determines the color of bearish wick shadows from the 240 minute time frame.
Daily (Higher Timeframe)
-Wick Shadow (On/Off): Determines whether or not wick shadows are drawn from the daily time frame chart.
- Bullish Color: Determines the color of bullish wick shadows from the daily time frame.
- Bearish Color: Determines the color of bearish wick shadows from the daily time frame.
Cari dalam skrip untuk "股票开盘前15分钟交易规则"

Candle Wick Retest [UkutaLabs]█ OVERVIEW
The Candle Wick Retest Indicator identifies untested wicks in real time that occur when there is an imbalance in the number of buyers and sellers at a price-level. This imbalance occurs when a market exchange receives too many of one kind of order, and not enough of its counterpoint.
Candle Wick Retest is a powerful trading indicator that will automatically identify and label strong ranges on traders’ charts that can be incorporated into a wide variety of different trading strategies.
█ USAGE
The script automatically identifies and measures real-time ranges of imbalance between buying and selling pressure in the market using real-time price-action information. These levels indicate potential Supply and Demand zones which serve to help the trader identify areas where price has changed direction in the past due to an imbalance of buyers and sellers.
The script also allows users to mirror higher time frame Candle Wick Retests onto lower time frame charts to gain a stronger understanding of key levels on another scale.
█ SETTINGS
Configuration
- Show Labels: Determines whether or not identification labels are drawn on the chart.
- Max CW Display: Determines the number of Candle Wick Retests that will be drawn on the chart. This is for each higher timeframe option that is toggled, not the total.
Current Time Frame
- Wick Retest (On/Off): Determines whether wick retests will be drawn from the current time frame chart.
- Wick Retest Bullish Color: Determines the color of bullish wick retests from the current time frame.
- Wick Retest Bearish Color: Determines the color of bearish wick retests from the current time frame.
5 Minute (Higher Timeframe)
- Wick Retest (On/Off): Determines whether wick retests will be drawn from the 5 minute chart.
- Wick Retest Bullish Color: Determines the color of bullish wick retests from the 5 minute time frame.
- Wick Retest Bearish Color: Determines the color of bearish wick retests from the 5 minute time frame.
15 Minute (Higher Timeframe)
- Wick Retest (On/Off): Determines whether wick retests will be drawn from the 15 minute time frame chart.
- Wick Retest Bullish Color: Determines the color of bullish wick retests from the 15 minute time frame.
- Wick Retest Bearish Color: Determines the color of bearish wick retests from the 15 minute time frame.
30 Minute (Higher Timeframe)
- Wick Retest (On/Off): Determines whether wick retests will be drawn from the 30 minute time frame chart.
- Wick Retest Bullish Color: Determines the color of bullish wick retests from the 30 minute time frame.
- Wick Retest Bearish Color: Determines the color of bearish wick retests from the 30 minute time frame.
60 Minute (Higher Timeframe)
- Wick Retest (On/Off): Determines whether wick retests will be drawn from the 60 minute time frame chart.
- Wick Retest Bullish Color: Determines the color of bullish wick retests from the 60 minute time frame.
- Wick Retest Bearish Color: Determines the color of bearish wick retests from the 60 minute time frame.
240 Minute (Higher Timeframe)
- Wick Retest (On/Off): Determines whether wick retests will be drawn from the 240 minute time frame chart.
- Wick Retest Bullish Color: Determines the color of bullish wick retests from the 240 minute time frame.
- Wick Retest Bearish Color: Determines the color of bearish wick retests from the 240 minute time frame.
Daily (Higher Timeframe)
- Wick Retest (On/Off): Determines whether wick retests will be drawn from the daily time frame chart.
- Wick Retest Bullish Color: Determines the color of bullish wick retests from the daily time frame.
- Wick Retest Bearish Color: Determines the color of bearish wick retests from the daily time frame.
Power Trends [UkutaLabs]█ OVERVIEW
The Power Trends Indicator is a versatile trading toolkit that offers unique insight into key price levels in the market. This script uses currently relevant price-action information to automatically detect pivot levels and use them to create powerful trendlines.
The aim of this script is to improve the trading experience of users by offering a versatile toolkit that can be used in a wide variety of trading strategies to help simplify the complexities of the market.
█ USAGE
The Power Trends Indicator will automatically identify pivot points in real-time using recent price-action information to ensure that all points being identified are relevant. Using these pivot points, the script then draws powerful trend lines that can be used as levels of resistance and support.
To ensure that only the most relevant information is being presented, only the most recent trend lines will be displayed on the user’s charts. As new trend lines are being drawn, older trend lines will become thinner so that traders can identify the most relevant lines at a glance.
The price of the most recent high and low pivot points will also be displayed on the chart and can be used as further levels of resistance and support.
When a recent pivot level is broken, it will be identified as a Break of Structure. This signifies that there may have been a change in market strength.
The Power Trends Indicator also supports multiple time frame mapping, allowing you to mirror the trend lines that would be drawn on higher time frame charts onto lower time frame charts. This feature allows traders to be aware of the market structure of multiple charts at a glance from a single chart.
When mirroring some higher time frame trend lines, lines may appear to not align properly with current time frame bars. This is done intentionally to ensure lines are being drawn accurately to their position on the higher time frame charts.
█ SETTINGS
Current Time Frame
• Display (On/Off): Determines whether or not trend lines are drawn from the current time frame.
• High Color: Determines the color of trend lines drawn on high pivots.
• Low Color: Determines the color of trend lines drawn on low pivots.
5 Minute (Higher Time Frame)
• Display (On/Off): Determines whether or not trend lines are drawn from the 5 minute higher time frame.
• High Color: Determines the color of trend lines drawn on high pivots from the 5 minute higher time frame.
• Low Color: Determines the color of trend lines drawn on low pivots from the 5 minute higher time frame.
15 Minute (Higher Time Frame)
• Display (On/Off): Determines whether or not trend lines are drawn from the 15 minute higher time frame.
• High Color: Determines the color of trend lines drawn on high pivots from the 15 minute higher time frame.
• Low Color: Determines the color of trend lines drawn on low pivots from the 15 minute higher time frame.
30 Minute (Higher Time Frame)
• Display (On/Off): Determines whether or not trend lines are drawn from the 30 minute higher time frame.
• High Color: Determines the color of trend lines drawn on high pivots from the 30 minute higher time frame.
• Low Color: Determines the color of trend lines drawn on low pivots from the 30 minute higher time frame.
60 Minute (Higher Time Frame)
• Display (On/Off): Determines whether or not trend lines are drawn from the 60 minute higher time frame.
• High Color: Determines the color of trend lines drawn on high pivots from the 60 minute higher time frame.
• Low Color: Determines the color of trend lines drawn on low pivots from the 60 minute higher time frame.
240 Minute (Higher Time Frame)
• Display (On/Off): Determines whether or not trend lines are drawn from the 240 minute higher time frame.
• High Color: Determines the color of trend lines drawn on high pivots from the 240 minute higher time frame.
• Low Color: Determines the color of trend lines drawn on low pivots from the 240 minute higher time frame.
Daily (Higher Time Frame)
• Display (On/Off): Determines whether or not trend lines are drawn from the daily time frame.
• High Color: Determines the color of trend lines drawn on high pivots from the daily higher time frame.
• Low Color: Determines the color of trend lines drawn on low pivots from the daily higher time frame.

Fair Value Gap [UkutaLabs]█ OVERVIEW
Fair Value Gaps are price jumps caused by the imbalance buying and selling pressures in trading and are most commonly used amongst price action traders. Fair Value Gaps are formed via a three-candle sequence in which a large candle’s neighbouring candles’ upper and lower wicks do not fully overlap the large candle.
The Fair Value Gaps Indicator also supports Multi Time Frame Plotting, allowing you to plot the Fair Value Gaps from higher time frames onto lower time frame charts.
The Fair Value Gaps Indicator is a powerful trading toolkit that provides users with more information than they would typically have available to them by allowing them to configure several charts worth of information onto one single chart.
█ USAGE
The script automatically identifies imbalances between buying and selling pressure in the market in real time, offering traders valuable insight into current market sentiment. These gaps are considered to be levels where the supply and demand of a commodity are imbalanced, and the price tends to return to fill these gaps (But are not guaranteed to).
The Fair Value Gaps Indicator also allows gaps from higher time frames to be drawn on lower time frame charts, providing traders with more information than they would typically have access to to further simplify the decision making process.
█ SETTINGS
Configuration
• Show Labels: Determines whether labels that identify which time frame a FVG is calculated from.
• Max FVG Display: Determines the limit to the number of FVGs that can be drawn from all time frames. Set this value to 0 to remove this limit.
Current Time Frame
• Display: Determines whether or not FVGs from the current time frame will be drawn on the chart.
• Bullish Color: Determines the color of Bullish FVGs calculated from the current time frame.
• Bearish Color: Determines the color of Bearish FVGs calculated from the current time frame.
5 Minute (Higher Time Frame)
• Display: Determines whether or not FVGs from the 5 minute time frame will be drawn on the chart.
• Bullish Color: Determines the color of Bullish FVGs calculated from the 5 minute time frame.
• Bearish Color: Determines the color of Bearish FVGs calculated from the 5 minute time frame.
15 Minute (Higher Time Frame)
• Display: Determines whether or not FVGs from the 15 minute time frame will be drawn on the chart.
• Bullish Color: Determines the color of Bullish FVGs calculated from the 15 minute time frame.
• Bearish Color: Determines the color of Bearish FVGs calculated from the 15 minute time frame.
30 Minute (Higher Time Frame)
• Display: Determines whether or not FVGs from the 30 minute time frame will be drawn on the chart.
• Bullish Color: Determines the color of Bullish FVGs calculated from the 30 minute time frame.
• Bearish Color: Determines the color of Bearish FVGs calculated from the 30 minute time frame.
60 Minute (Higher Time Frame)
• Display: Determines whether or not FVGs from the 60 minute time frame will be drawn on the chart.
• Bullish Color: Determines the color of Bullish FVGs calculated from the 60 minute time frame.
• Bearish Color: Determines the color of Bearish FVGs calculated from the 60 minute time frame.
240 Minute (Higher Time Frame)
• Display: Determines whether or not FVGs from the 240 minute time frame will be drawn on the chart.
• Bullish Color: Determines the color of Bullish FVGs calculated from the 240 minute time frame.
• Bearish Color: Determines the color of Bearish FVGs calculated from the 240 minute time frame.
Daily (Higher Time Frame)
• Display: Determines whether or not FVGs from the daily time frame will be drawn on the chart.
• Bullish Color: Determines the color of Bullish FVGs calculated from the daily time frame.
• Bearish Color: Determines the color of Bearish FVGs calculated from the daily time frame.
[r380]Bear & Bull Pivot Signal Indicator_(Lite))Bear & Bull Pivot Signal Indicator
Overview:
The Bear & Bull Multi Pivot Signal Indicator is a comprehensive trading tool designed to identify potential market reversal points and trend changes. This indicator combines multiple technical analysis strategies such as RSI, MACD, and pivot points to generate reliable signals. By overlapping these signals, the indicator increases the possibility of accurate trend predictions, providing traders with valuable insights for informed decision-making.
"This indicator is primarily optimized for Bitcoin on a 15-minute timeframe and is recommended for short-term trading. Reliability on other timeframes is not guaranteed."
Key Features:
Bear and Bull Signals: Clearly indicate potential market reversal points using bear and bull emojis.
Support and Resistance Signals: Indicated with sun and snowflake emojis to show critical price levels.
Overheat Cooldown Pivot: Detects market exhaustion points to signal potential reversals.
Settings:
RSI Settings: Adjust the RSI period and thresholds to match your trading strategy. Default values are optimized for short-term trading.
MACD Settings: The MACD settings are pre-configured but can be customized if needed.
Visual Settings: If excessive signals cause visual discomfort, you can selectively enable or disable features in the visual settings.
Signal Descriptions:
🐻 Bear Signal: Indicates a potential high point where the market may reverse downwards. Combines RSI and MACD conditions to provide a reliable overbought signal. When accompanied by high volume, it can indicate a strong resistance level.
🐮 Bull Signal: Indicates a potential low point where the market may reverse upwards. Uses both RSI and MACD conditions to highlight oversold situations. When accompanied by high volume, it can indicate a strong support level.
❄️ Resistance Signal: Shows a resistance level where the price has difficulty moving higher. When the price crosses below this level, it signals a potential downward movement. Combined with high volume, it can signify robust resistance.
☀️ Support Signal: Shows a support level where the price has difficulty moving lower. When the price crosses above this level, it signals a potential upward movement. Combined with high volume, it can signify strong support.
Detailed Explanation:
This indicator is not simply a combination of multiple indicators but is designed to increase the probability of detecting potential trend reversal signals by using multiple signals. If signals only appear when multiple conditions are met, how many trades can we make in a year? Because there is no 100% certainty in any situation, we need to use various signals to construct our strategy and proceed with trading. For example, if only one signal appears, the reliability of the trend reversal signal is somewhat weak, so we can strategize by betting only a portion of the capital. If multiple signals appear simultaneously, we can consider it a highly reliable trend reversal signal and increase the betting amount and stop loss accordingly. The essence of this indicator, in my view, is not to blindly trade based on signals but to use it as an auxiliary tool for strategic decision-making.
RSI (Relative Strength Index), MACD, and Stochastic RSI: By using various indicators to confirm trend reversal signals, bear and bull emojis are included. If the RSI reaches an oversold zone and then drops by a certain amount, while the MACD turns negative and the Stochastic RSI makes a gold or dead cross, the bear and bull signals are activated.
Pivot Points: Calculated based on the high, low, and close prices over a specific lookback period. These points are used to determine support and resistance levels. Pivot points provide a framework for assessing market sentiment and potential reversal zones. The values calculated this way activate the sun and snowflake signals.
The Overheat Cooldown Pivot: captures moments when the market shows signs of exhaustion, particularly when overbought or oversold conditions are accompanied by a drop in volume. This helps traders anticipate market turning points more effectively. These signals appear as red or green triangles indicating potential reversals. Although similar to the bear and bull signals in detecting market cool-off points, these signals rely on volume and may have slightly lower reliability.
Practical Application:
By using this indicator, traders can strategically adjust their bet sizes based on the reliability of the signals. When multiple signals coincide, it indicates a higher probability of a trend reversal, allowing for larger position sizes. Conversely, when signals occur independently, it suggests a lower probability, warranting smaller position sizes. This approach enables traders to manage their risk effectively and capitalize on high-probability trading opportunities without excessively reducing trading frequency.
Trading Method:
The basic setup is for Bitcoin on a 15-minute timeframe, and short-term trading is recommended by the creator. Upon signal activation, if only one signal appears, verify the volume and support/resistance lines, calculate the risk-reward ratio, and enter a position with a low betting ratio. If three signals activate simultaneously, enter a position with a higher betting ratio.
Reliability Order:
🐻🐮 > ❄️☀️ > 🔻🔺 (replacing green triangle emojis)
This indicator provides a powerful method for detecting multiple potential market reversals and trend continuations.
Note: Have realistic expectations and understand the limitations of technical analysis tools. This indicator is a tool to assist in your trading decisions and not a guaranteed prediction of market movements.
Warning! Do not trade solely based on this indicator.
Additionally, if you find the settings lacking, feel free to adjust them yourself! Thank you!
Korean Version
곰돌이와 송아지 멀티 피봇 시그널 인디케이터
개요:
곰돌이와 송아지 멀티 피봇 시그널 인디케이터는 잠재적 시장 반전 지점과 추세 변화를 식별하기 위해 설계된 종합 거래 도구입니다. 이 인디케이터는 RSI, MACD, 피봇 포인트 등의 여러 기술 분석 전략을 결합하여 신뢰할 수 있는 신호를 생성합니다. 이러한 신호들을 중첩함으로써 정확한 추세 예측의 가능성을 높여, 트레이더가 정보를 기반으로 결정을 내리는 데 유용한 통찰력을 제공합니다.
기본적으로 비트코인 15분봉을 기준으로 하며 매매 방법은 단타를 권장합니다. 다른 타임프레임에서의 신뢰는 보장 하지 않습니다.
주요 기능:
곰돌이와 송아지 신호: 시장의 잠재적 반전 지점을 곰돌이와 송아지 이모지로 명확하게 표시합니다.
지지 및 저항 신호: 중요한 가격 수준을 나타내기 위해 태양과 눈송이 이모지로 표시합니다.
오버히트 쿨다운 피봇: 시장 피로 지점을 감지하여 잠재적 반전 신호를 제공합니다.
세팅방법:
RSI 설정: RSI 기간과 임계값을 조정하여 자신의 거래 전략에 맞춥니다. 기본값은 단기 거래에 최적화되어 있습니다.
MACD 설정: MACD 설정은 미리 구성되어 있으며, 필요에 따라 사용자 정의가 가능합니다.
비쥬얼 세팅: 과도한 시그널 때문에 눈이 아프시다면 비쥬얼세팅에서 선택적으로 기능들을 켜거나 끌 수 있으니 참고하세요.
신호 설명:
🐻 곰돌이 신호: 시장이 하락할 가능성이 있는 고점을 나타냅니다. RSI와 MACD 조건을 결합하여 신뢰할 수 있는 과매수 신호를 제공합니다. 높은 거래량과 함께 나타나면 강한 저항 수준을 나타낼 수 있습니다.
🐮 송아지 신호: 시장이 상승할 가능성이 있는 저점을 나타냅니다. RSI와 MACD 조건을 사용하여 과매도 상황을 강조합니다. 높은 거래량과 함께 나타나면 강한 지지 수준을 나타낼 수 있습니다.
❄️ 저항 신호: 가격이 더 이상 상승하기 어려운 저항 수준을 나타냅니다. 가격이 이 수준 아래로 하락하면 잠재적 하락 움직임을 신호합니다. 높은 거래량과 함께 나타나면 강력한 저항을 의미할 수 있습니다.
☀️ 지지 신호: 가격이 더 이상 하락하기 어려운 지지 수준을 나타냅니다. 가격이 이 수준 위로 상승하면 잠재적 상승 움직임을 신호합니다. 높은 거래량과 함께 나타나면 강한 지지를 의미할 수 있습니다.
상세 설명:
이 인디케이터는 여러 인디케이터를 단순히 결합한 것이 아니라, 여러가지 시그널들을 사용해서 잠재적 추세전환 신호 감지 확률을 높이는 것에 목적이 있습니다. 단순히 여러가지 조건들이 중첩되었을때만 신호가 뜬다면 우리는 1년에 몇번이나 매매를 할 수 있을까요. 모든경우에 100% 라는 경우가 없기때문에 우리는 다양한 신호들을 활용하여 전략을 구성하고 매매를 진행 해야합니다. 예를들어 1개의 시그널만 뜬다면 추세전환 신호의 신뢰도가 다소 약하기 때문에 시드의 일부 금액만 배팅 하는 식으로 전략을 구성 할 수도 있고, 만약 여러가지 시그널들이 충접적으로 뜬다면 신뢰도 높은 추세전환의 신호로 인식하여 배팅금액을 높이고 스탑로스를 높게 잡는 방향으로 전략을 구성 할 수 있습니다. 단순히 맹목적으로 시그널이 떳다고 매매하는것이 아닌 보조 신호로써의 기능, 이것이 내가 생각하는 인디케이터의 역할이자 본질 이라고 생각합니다.
RSI (상대 강도 지수)와 MACD, 스토캐스틱 RSI: 여러가지 지표들을 기반으로 추세 반전의 신호를 확인 할 수 있는 곰돌이와 송아지를 넣었습니다. RSI 가 과매도 구간에 도달한 이후일정 수치 이상 하락하는 동시에 MACD가 음수로 변하고 스토캐스틱 RSI가 골드, 데드 크로스가 된다면 곰돌이와 송아지 신호가 활성화 됩니다.
피봇 포인트: 특정 되돌아보기 기간 동안의 최고, 최저, 종가를 기반으로 계산됩니다. 이 포인트는 지지 및 저항 수준을 결정하는 데 사용됩니다. 피봇 포인트는 시장 심리와 잠재적 반전 영역을 평가하는 프레임워크를 제공합니다. 이렇게 계산된 값을 기반으로 눈송이와 해 신호가 활성화 됩니다.
오버히트 쿨다운 피봇: 는 과매수 또는 과매도 상태에서 거래량이 감소할 때 시장 피로 지점을 포착하여 잠재적 반전 지점을 신호합니다. 이러한 피로 지점을 식별함으로써 인디케이터는 트레이더가 시장의 전환점을 보다 효과적으로 예측할 수 있도록 돕습니다. 그렇게 추세 반전의 신호로 녹색 또는 붉은색 삼각형 시그널이 뜹니다. 과열된 시장이 냉각되는 포인트를 찾는점에서는 곰돌이 송아지 신호와 비슷하지만 거래량을 기반으로 하고 있기 때문에 명백히 다른 시그널이며 신뢰도는 약간 낮을 수도 있습니다
실용적 적용:
이 인디케이터를 사용함으로써, 트레이더는 신호의 신뢰도에 따라 베팅 크기를 전략적으로 조정할 수 있습니다. 여러 신호가 동시에 나타날 때, 이는 추세 반전의 가능성이 높음을 나타내며, 더 큰 포지션 크기를 허용합니다. 반대로, 신호가 독립적으로 발생할 때는 낮은 가능성을 나타내므로 작은 포지션 크기가 적합합니다. 이 접근 방식은 트레이더가 효과적으로 리스크를 관리하고 높은 확률의 거래 기회를 활용하면서 거래 빈도를 과도하게 줄이는 것을 방지할 수 있게 합니다.
매매방법:
기본적인 세팅은 비트코인 15분 타임프레임이며 제작자는 단타를 추천합니다. 포지션 진입시 시그널이 1개가 뜬다면 거래량과 지지와 저항라인을 확인하고 손익비를 계산후 낮은 배팅 비율로 포지션에 진입합니다. 만약에 3개의 시그널이 동시에 활성화 된다면 보다 높은 비율로 포지션에 진입합니다.
신뢰도 순서:
]🐻🐮 > ❄️☀️ > 🔻🔺(초록 삼각이모지가 없기때문에 이것으로 대체)
이 지표는 여러 잠재적인 시장 반전 및 추세 지속성을 감지하는 강력한 방법을 제공합니다.
참고: 현실적인 기대를 가지고 기술 분석 도구의 한계를 이해하십시오. 이 지표는 시장 움직임을 보장하는 예측이 아니라 거래 결정을 돕기 위한 도구입니다.
경고! 절대 이 지표만을 가지고 매매하지 마십쇼.
추가적으로 제작자는 지표 세팅에 허접이라 꼬우면 당신이 세팅하십쇼! 감사합니다!

Algoflow's Levels PlotterAlgoflow's Levels Plotter - Indicator
Release Date: Jan. 15, 2024
Release version: v3 r1
Release notes date: Jan. 15, 2024
Overview
Parses user's input of levels to be plotted and labeled on the chart for NQ & ES futures
Features
Quick plotting of predetermined price levels.
- Type or copy from another source of values in a predetermined output format.
Supports separate line plotting for Weekly, OVN and RTH values
- Plot only Weekly, OVN or RTH levels, or all
- Configure colors separately for Inflection Points, Weekly, OVN & RTH levels
- Shift/place price labels separately to easily identify levels
User Impacts of Changes
Requires users to remove previous version and re-add indicator "Algoflow's Levels Plotter", then re-add values. Colors and shift values will need to be re-entered and/or reconfigured
Support
Questions, feedbacks, and requests are welcomed. Please feel free to use Comments or direct private message via TradingView.
Quick usage notes:
The indicator allows you to enter data for both ES & NQ at the same time. This is useful in single chart window/layout situations, like viewing on the phone. When you switch between futures, the data is already there.
If you leave the entries blank, nothing will be plotted. This is useful if you want to have separate charts for ES & NQ. So you can just enter only the relevant data of either.
As an indicator, input values are saved within it, until it is removed from the chart. Input for one chart will not update other charts of the same ticker, even in the same layout.
The easiest and quickest way to share the inputs across all charts and layouts is to use the Indicator Templates feature.
- After input values are entered (for both ES & NQ futures) via the indicator's Settings, select ""Save as Default"".
- Click on ""Indicator Templates"" (4 squares icon), and click on ""Save Indicator template...""
- Remove the previous version of the indicator in other charts.
- Click on ""Indicator Templates"" icon, and select the newly created template. Repeat this for other charts of the same futures ticker
The labels can be disabled in settings > Style tab. Use the Inputs tab to configure orientation (left or right of current bar on chart), and how much spacing from the current (in distance of bars)
Format example:
Primary directional inflection point: 1234
For Bulls: 1244.25, 1254, 1264.50
For Bears: 1224, 1214, 1204
Changes
v3 r1 - Fixed erroneous default values in Weekly input sections. Added options to en/disable display of each set (session) of levels. Default label text size to normal, from small.
- Jan 15, 2024
v2 r9 - Added support for USTEC & US500.
- Dec. 10, 2023
v2 r8 - Added configuration features for users to modify the labels' text colors and size. Simplified code further by moving inputs processing modules into a single user function.
- Oct. 31, 2023
v2 r7 - Added support for the micro NQ & ES. Modified to ignore string case in inputs
- Oct 18, 2023
v2 r4 - Added support of weekly lines and labels features. Began the process of optimizing/simplifying code
- Oct. 15, 2023
v2 r3 - Made Inflection Point levels' colors configurable
- Oct. 04, 2023
v2 r2 - Removed comments & debug codes from development build revision #518
- Oct. 04, 2023
v2 r1 - Released from development revision #518. Major rewrite to fix previous and overlapping plots of lines and labels.
- Oct. 04, 2023
v1 r2 - First release of indicator
- Oct. 02, 2023

Multi VWAP for Wick HunterCredit: honeybadgermakesfunnymoney for this Open Source Script
Published:
This is a tool that will allow you to visualize Wick Hunter's calcation of VWAP. Wick Hunter uses this calcuation for its Liqudations Bots.
There are four settings that you need to be configured to visualize your VWAP Band:
Long VWAP - The distance from current VWAP price, in %, that price must be UNDER when a liquidation event occurs to meet your you VWAP condition. The higher the value, the more price must move below the current VWAP price for it to enter a LONG position.
Short VWAP - The distance from current VWAP price, in %, that price must be ABOVE when a liquidation event occurs to meet your you VWAP condition. The higher the value, the more price must move above the current VWAP price for it to enter a SHORT position.
VWAP Timeframe - Select the timeframe you want the VWAP to be measured on.
VWAP Periods: Input the time period over which you want the VWAP to be measured over. For example, if you use "5" for this and "15" for VWAP Timeframe. The VWAP will be calculated based on the last five 15 minute candles.
You can play around with these settings using the indicator provide above. The indicator will print a triangle when the conditon for VWAP is met for a long for short trade. Play around with these settings. A few good timeframes that are popular are 5 minute, 15 minute, and one hour (60 minute). As far as periods, the most common settings are between 5 periods and 15 periods. In general the lower the timeframe and periods and closer VWAP will follow price.

EquiVolume [LuxAlgo]EquiVolume is a charting method that aims to incorporate volume information to a candlestick chart. Volume is highlighted through the candle body width, with wider candles suggesting more significant volume.
Our script shows an EquiVolume chart for the visible chart range. Additionally regular volume can be plotted as a column plot with the column's width controlled by volume.
🔶 SETTINGS
🔹 Options
Chart: Shows candles with volume adjusted width.
Volume: Shows volume with volume adjusted width.
🔹 Intrabar Analysis
Enable/disable: When LTF is enabled, the script will calculate the % volume/candles in the same direction than current timeframe.
You can choose a LTF between 1 and 240 minutes.
Type %:
- Volume: sum of volume of all LTF candles, which are in the same direction.
- #bars: sum of all LTF candles, which are in the same direction.
🔹 Width Boxes (bars)
Minimum width: sets the minimum width of a box (candle/volume)
Maximum width: sets the maximum width of a box (candle/volume)
🔶 USAGE
This charting method makes it easier to spot large volume candles, against comparing candles to volume.
Another example:
Additionally, users can make the script perform an intrabar analysis on the chart candles, allowing to highlight bullish/bearish activity within a candle. The script can estimate bullish/bearish trading activity within a candle or simply use intrabar candle signs.
Example
- 15-minute candle is green
- 10 1-minute candles (LTF) IN that 15-minute candle are green -> 10/15 = 66,667%
-> The current 15-minute candle will be 66,667% filled with green color.
Note that the script will draw everything from last visible bar at the right to left, as such you can scroll backwards, and the script will show you the data of the visible chart.
Scrolling back will return the following result:
🔶 REMARKS
When the LTF is too far apart from current timeframe, you should get an error. To prevent this, the LTF will automatically rise, giving no error.
When this happens, the adjusted LTF will be displayed. Do note, due to a maximum available LTF data, sometimes boxes won't always be visible (since there is no LTF data anymore)
To solve this, just elevate your LTF:
When the set LTF is higher than current TF, you would normally get an error as well.
This script will automatically adjust the LTF to current TF, together with a visible warning (no error though).
Due to the inability to draw a line in the space between bars, sometimes a wick won't be placed exactly in the middle.
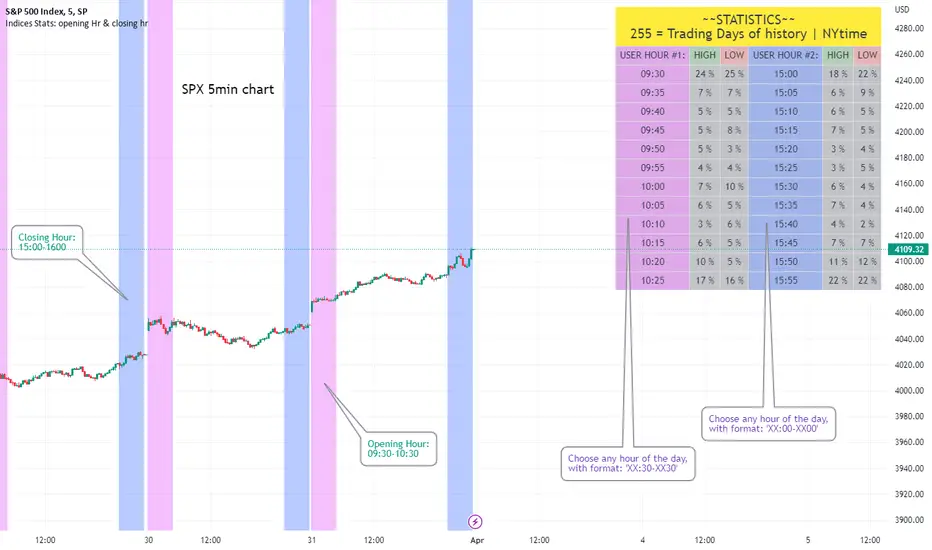
Statistics: High & Low timings of custom session; 1yr historyGet statistics of the Session High and Session Low timings for any custom session; based on around 1yr of data.
//Purpose:
-To get data on the 'time of day' tendencies of an asset.
-Narrow in on a custom defined session and get statistics on that session.
//Notes:
-Input times are always in New York time (but changing the timezone after setting WILL adust both table stats and background highlight correctly.
-For particularly long sessions, make sure text size is set to 'tiny' (very long vertical table), or adjust table to display horizontally.
-You'll notice most assets show higher readings around NY equities open (9:30am NY time). Other assets will have 'hot-spots' at other times too.
-Timings represent the beginning of a 15m candle. i.e. reading for 15:45 represents a high occurring between 15:45 and 1600.
-Premium users should get 20k bars => around 1year's worth of data on a 15minute chart. Days of history is displayed in the top left corner of the table.
//Limitations
-only designed and working on 15minute timeframe (to gather a full year of meaningful/comparable % stats, need 15minute 'buckets' of time.
-sessions cannot cross through midnight, or start at midnight (00:15 is ok). 00:15 >> 23:45 is the max session length. On BTC, same applies but 01:00 instead of midnight (all in NY time).
-if your session crosses through 'dead time' (e.g. 17:00-18:00 S&P NY time); table will correctly omit these non-existent candles, but it will add on the missing hour before the start time.
//Cautionary note:
-Since markets are not uncommonly in a trending state when your defined session starts or ends, the high/low timings % readings for start and end of session may be misleadingly high. Try to look for unusually high readings that are not at the start/end of your session.
Wheat (ZW1!) 15min chart; Table displayed vertically:
Nasdaq (NQ1!) 15m chart; Table displayed horizontally and with smaller text to view a very long custom session:

Opening Hour/Closing Hour Indices Statistics: high/low times; 5mVery specific indicator designed for 5min timeframe, to show the statistical timings of the highs and lows of Opening hour (9:30-10am) and Closing hour (3pm-4pm) NY time
~~Shown here on SPX 5min chart. Works all variants of the US indices. SPX and SPY typically show more days of history (non-extended session =>> more bars).
//Purpose:
-To get statistics on the timings of the high and low of the opening hour and the high & low of the closing hour.
//Design & Limitations:
- Designed for the 5minute chart ONLY . Need a sweet spot of 'bucket' size for the statistics: to allow meaningful comparison between times.
-Will also display on 1min chart but NOT the statistics panel, only the realtime data (today's opening hour/ closing hour timings).
-Can be slow to load depending on server load at the time. This is becasue of the multiple usage of looping array functions. Please be patient when loading or changing settings.
//User inputs:
-Standard formatting options: highlight color, table text color. Toggle on/off independently
-Decimal % percision (default = 0, i.e. 23%. If set to 1 => 22.8%)
-Show statistics: Show Opening hour statistics, Show Closing hour statistics
//Notes:
-Days of history shown at top of table; this is the size of the dataset. i.e. 254 here (254 trading days) =>> 254 opening hour highs, 254 closing hour lows etc.
--to illustrate with the above: 18% of those 254 closing hour highs occured on the 15:00 5min candle (i.e. between 15:00 and 15:05).
-SPY or SPX offer the largest history/dataset (circa 254 trading days).
-Note that the final timing in each hour is 10:25am and 15:55pm respectively: this is because the 10:25am 5min candle essentially ends at 10:30am =>> we properly captures the opening hour this way
-Pro+ users will get less data history than Premium users (half as much, due to 10k vs 20k bars history limit).
STD-Filtered, N-Pole Gaussian Filter [Loxx]This is a Gaussian Filter with Standard Deviation Filtering that works for orders (poles) higher than the usual 4 poles that was originally available in Ehlers Gaussian Filter formulas. Because of that, it is a sort of generalized Gaussian filter that can calculate arbitrary (order) pole Gaussian Filter and which makes it a sort of a unique indicator. For this implementation, the practical mathematical maximum is 15 poles after which the precision of calculation is useless--the coefficients for levels above 15 poles are so high that the precision loss actually means very little. Despite this maximal precision utility, I've left the upper bound of poles open-ended so you can try poles of order 15 and above yourself. The default is set to 5 poles which is 1 pole greater than the normal maximum of 4 poles.
The purpose of the standard deviation filter is to filter out noise by and by default it will filter 1 standard deviation. Adjust this number and the filter selections (price, both, GMA, none) to reduce the signal noise.
What is Ehlers Gaussian filter?
This filter can be used for smoothing. It rejects high frequencies (fast movements) better than an EMA and has lower lag. published by John F. Ehlers in "Rocket Science For Traders".
A Gaussian filter is one whose transfer response is described by the familiar Gaussian bell-shaped curve. In the case of low-pass filters, only the upper half of the curve describes the filter. The use of gaussian filters is a move toward achieving the dual goal of reducing lag and reducing the lag of high-frequency components relative to the lag of lower-frequency components.
A gaussian filter with...
One Pole: f = alpha*g + (1-alpha)f
Two Poles: f = alpha*2g + 2(1-alpha)f - (1-alpha)2f
Three Poles: f = alpha*3g + 3(1-alpha)f - 3(1-alpha)2f + (1-alpha)3f
Four Poles: f = alpha*4g + 4(1-alpha)f - 6(1-alpha)2f + 4(1-alpha)3f - (1-alpha)4f
and so on...
For an equivalent number of poles the lag of a Gaussian is about half the lag of a Butterworth filters: Lag = N*P / pi^2, where,
N is the number of poles, and
P is the critical period
Special initialization of filter stages ensures proper working in scans with as few bars as possible.
From Ehlers Book: "The first objective of using smoothers is to eliminate or reduce the undesired high-frequency components in the eprice data. Therefore these smoothers are called low-pass filters, and they all work by some form of averaging. Butterworth low-pass filters can do this job, but nothing comes for free. A higher degree of filtering is necessarily accompanied by a larger amount of lag. We have come to see that is a fact of life."
References John F. Ehlers: "Rocket Science For Traders, Digital Signal Processing Applications", Chapter 15: "Infinite Impulse Response Filters"
Included
Loxx's Expanded Source Types
Signals
Alerts
Bar coloring
Related indicators
STD-Filtered, Gaussian Moving Average (GMA)
STD-Filtered, Gaussian-Kernel-Weighted Moving Average
One-Sided Gaussian Filter w/ Channels
Fisher Transform w/ Dynamic Zones
R-sqrd Adapt. Fisher Transform w/ D. Zones & Divs .

Ultimate IndicatorThis is a combination of all the price chart indicators I frequently switch between. It contains my day time highlighter (for day trading), multi-timeframe long-term trend indicator for current commodity in the bottom right, customizable trend EMA which also has multi-timeframe drawing capabilities, VWAP, customizable indicators with separate settings from the trend indicator including: EMA, HL2 over time, Donchian Channels, Keltner Channels, Bollinger Bands, and Super Trend. The settings for these are right below the trend settings and can have their length and multiplier adjusted. All of those also have multi-timeframe capabilities separate from the trend multi-time settings.
The Day Trade Highlight option will draw faint yellow between 9:15-9:25, red between 9:25-9:45, yellow between 9:45-10:05. There will be one white background at 9:30am to show the opening of the market. while the market is open there will be a very faint blue background. For the end of the day there will be yellow between 15:45-15:50, red between 15:50-16:00, and yellow between 16:00-16:05. During the night hours, there is no coloring. The purpose of this highlight is to show the opening / closing times of the market and the hot times for large moves.
The indicators can also be colored in the following ways:
1. Simple = Makes all colors for the indicator Gray
2. Trend = Will use the Donchian Channels to get the short-trend direction and by default will color the short-term direction as Blue or Red. Unless using Super Trend, the Donchian Channel is used to find short-term trend direction.
3. Trend Adv = Will use the Donchian Channels to get the short-trend direction and by default will color the short-term direction as Blue or Red. Unless using Super Trend, the Donchian Channel is used to find short-term trend direction. If there is a short-term up-trend during a long-term down-trend, the Blue will become Navy. If short-term down-trend during long-term up-trend, the Red will be Brown.
4. Squeeze = Compares the Bollinger Bands width to the Keltner Channels width and will color based on relative squeeze of the market: Teal = no squeeze. Yellow = little squeeze. Red = decent squeeze. White = huge squeeze. if you do not understand this one, try drawing the Bollinger Bands while using the Squeeze color option and it should become more apparent how this works. I also recommend leaving the length and multiplier to the default 20 and 2 if using this setting and only changing the timeframe to get longer/shorter lengths as I've seen that changing the length or multiplier can more or less make it not work at all.
Along with the indicator settings are options to draw lines/labels/fills for the indicator. I enjoy having only fills for a cleaner look.
The Labels option will show Buy/Sell signals when the short-term trend flips to agree with the long-term trend.
The Trend Bars option will do the same as the Labels option but instead will color the bars white when a Buy/Sell option is given.
The Range Bars option shows will color a bar white when the Close of a candle is outside of a respective ranging indicator option (Bollinger or Keltner).
The Trend Bars will draw white candles no matter which indicator selection you make (even "Off"). However, Range Bars will only draw white when either Bollinger or Keltner are selected.
The Donchian Channels and Super Trend are trending indicators and should be used during trending markets. I like to use the MACD in conjunction with these indicators for possibly earlier entries.
The Bollinger Bands and Keltner Channel are ranging indicators and should be used during ranging markets. I like to use the RSI in conjunction with these indicators and will use 60/40 for overbought and oversold areas rather than 70/30. During a range, I wait for an overbought or oversold indication and will buy/sell when it crosses back into the middle area and close my position when it touches the opposite band.
I have a MACD/RSI combination indicator if you'd like that as well :D
As always, trade at your own risk. This is not some secret indicator that will 100% win. As always, the trades you see in the picture use a 1:1.5 or 1:2 risk to reward ratio, for today (August 8, 2022) it won 5/6 times with one trade still open at the end of the day. Manage your account correctly and you'll win in the long term. Hit me up with any questions or suggestions. Happy Trading!

CDC ActionZone BF for ETHUSD-1D © PRoSkYNeT-EE
Based on improvements from "Kitti-Playbook Action Zone V.4.2.0.3 for Stock Market"
Based on improvements from "CDC Action Zone V3 2020 by piriya33"
Based on Triple MACD crossover between 9/15, 21/28, 15/28 for filter error signal (noise) from CDC ActionZone V3
MACDs generated from the execution of millions of times in the "Brute Force Algorithm" to backtest data from the past 5 years. ( 2017-08-21 to 2022-08-01 )
Released 2022-08-01
***** The indicator is used in the ETHUSD 1 Day period ONLY *****
Recommended Stop Loss : -4 % (execute stop Loss after candlestick has been closed)
Backtest Result ( Start $100 )
Winrate 63 % (Win:12, Loss:7, Total:19)
Live Days 1,806 days
B : Buy
S : Sell
SL : Stop Loss
2022-07-19 07 - 1,542 : B 6.971 ETH
2022-04-13 07 - 3,118 : S 8.98 % $10,750 12,7,19 63 %
2022-03-20 07 - 2,861 : B 3.448 ETH
2021-12-03 07 - 4,216 : SL -8.94 % $9,864 11,7,18 61 %
2021-11-30 07 - 4,630 : B 2.340 ETH
2021-11-18 07 - 3,997 : S 13.71 % $10,832 11,6,17 65 %
2021-10-05 07 - 3,515 : B 2.710 ETH
2021-09-20 07 - 2,977 : S 29.38 % $9,526 10,6,16 63 %
2021-07-28 07 - 2,301 : B 3.200 ETH
2021-05-20 07 - 2,769 : S 50.49 % $7,363 9,6,15 60 %
2021-03-30 07 - 1,840 : B 2.659 ETH
2021-03-22 07 - 1,681 : SL -8.29 % $4,893 8,6,14 57 %
2021-03-08 07 - 1,833 : B 2.911 ETH
2021-02-26 07 - 1,445 : S 279.27 % $5,335 8,5,13 62 %
2020-10-13 07 - 381 : B 3.692 ETH
2020-09-05 07 - 335 : S 38.43 % $1,407 7,5,12 58 %
2020-07-06 07 - 242 : B 4.199 ETH
2020-06-27 07 - 221 : S 28.49 % $1,016 6,5,11 55 %
2020-04-16 07 - 172 : B 4.598 ETH
2020-02-29 07 - 217 : S 47.62 % $791 5,5,10 50 %
2020-01-12 07 - 147 : B 3.644 ETH
2019-11-18 07 - 178 : S -2.73 % $536 4,5,9 44 %
2019-11-01 07 - 183 : B 3.010 ETH
2019-09-23 07 - 201 : SL -4.29 % $551 4,4,8 50 %
2019-09-18 07 - 210 : B 2.740 ETH
2019-07-12 07 - 275 : S 63.69 % $575 4,3,7 57 %
2019-05-03 07 - 168 : B 2.093 ETH
2019-04-28 07 - 158 : S 29.51 % $352 3,3,6 50 %
2019-02-15 07 - 122 : B 2.225 ETH
2019-01-10 07 - 125 : SL -6.02 % $271 2,3,5 40 %
2018-12-29 07 - 133 : B 2.172 ETH
2018-05-22 07 - 641 : S 5.95 % $289 2,2,4 50 %
2018-04-21 07 - 605 : B 0.451 ETH
2018-02-02 07 - 922 : S 197.42 % $273 1,2,3 33 %
2017-11-11 07 - 310 : B 0.296 ETH
2017-10-09 07 - 297 : SL -4.50 % $92 0,2,2 0 %
2017-10-07 07 - 311 : B 0.309 ETH
2017-08-22 07 - 310 : SL -4.02 % $96 0,1,1 0 %
2017-08-21 07 - 323 : B 0.310 ETH

BB + RSI double strategy developeI'm Korean, and it may not be enough to explain this script in English. I feel sorry for the users of TradingView for this lack of English skills. If you are Korean, please return it to the translator using Papago. It will be a useful manual for you.
This script referenced Chartart's Double Strategy. But there are some changes in his script.
0. Basically, when you break through the top or bottom of the 100th period balliser band and come back into the band, you track the overbuying and overselling of the RSI to determine your position entry. The order is triggered only when both conditions are satisfied at the same time. However, only one condition applies to clearing the position. This is because it is most effective in reducing risk and increasing assets in terms of profit and loss.
1. This script is optimized for 15 minutes of bitcoin futures chart and API via webbook alert. By default, 10x leverage usage and 10 pyramids are applied.
2. Setting a chart period other than 15 minutes will not guarantee sufficient effectiveness. It can also be applied to Ethereum , but it is not recommended to apply to other symbols.
3. I added Enable Date Filter because Chartart's script could not apply the strategy to the user's desired period. This feature allows you to set a period of time when you do not want to use the strategy. You can also uncheck it if you don't want to fully use this feature. Please remember that it is an exclusion period, not a usage period. With this feature, we can see the effectiveness of the strategy from a point in time, not from the entire period. You can also clearly differentiate the effectiveness of the strategy from the point you use it.
4. You can also stop using strategies at certain times of the day when you don't want to apply them. This works similarly to the Enalbe Date Filter described above. This allows you to sleep comfortably even if you don't fully trust this strategy.
5. The period, overbuying, and overselling figures of RSI can be set individually. For example, when you take a long position, you can set the RSI to a period of 7, and at the same time, the RSI entering the short position can be set to a period of 14. You can also set the base figures for overbuying and overselling to levels that you think are reasonable. This figure works in conjunction with the Bollinger Band and affects position entry when it is crossed or returned.
6. Based on API futures trading, basic Sleepy and commission are applied. This is geared towards market price transactions. This makes your revenue look more reasonable.
Thank you very much, Chartart. You are a genius.
-
저는 한국인이고, 영어로 이 스크립트를 설명하는 것이 어렵기 때문에 설명이 부족할 수 있습니다. 이런 영어 능력 부족에 대해서 TradingView 사용자들에게 미안하게 생각합니다. 만약 당신이 한국인이라면 파파고를 사용하여 번역기에 돌려주십시오. 당신에게 유익한 설명서가 될 것입니다.
이 스크립트는 Chart art의 Double Strategy를 참조했습니다. 그러나 그의 스크립트에서 달라진 점이 몇 가지 있습니다.
0. 기본적으로 100기간의 볼린져밴드의 상단 또는 하단을 돌파한 뒤 다시 밴드 안으로 들어올 때 RSI의 과매수, 과매도를 추적하여 포지션 진입을 결정합니다. 두 가지 조건이 동시에 만족되어야만 주문이 트리거 됩니다. 그러나 포지션을 청산하는 것에는 볼린져밴드 하나의 조건만 적용합니다. 여러가지 테스트를 거친 결과 이것이 손익 면에서 가장 효과적으로 리스크를 줄이고 자산을 늘리는 것에 효율적이기 때문입니다.
1. 이 스크립트는 15분의 비트코인 선물 차트와 webhook alert을 통한 API에 최적화되어 있습니다. 기본적으로 10배의 레버리지 사용과 10개의 피라미딩이 적용되어 있습니다.
2. 15분 외에 다른 차트 기간을 설정한다면 충분한 효과를 보장할 수 없습니다. 또한 이더리움에도 적용할 수 있지만, 그 외에 다른 심볼에는 적용하지 않는 것을 권장합니다.
3. Chart art의 스크립트는 전략을 사용자가 원하는 기간에 적용할 수 없었기 때문에, 저는 Enable Date Filter를 추가하였습니다. 이 기능을 통해 전략 사용을 원하지 않는 기간을 설정할 수 있습니다. 또한 이 기능을 완전히 사용하고싶지 않다면 체크를 해제할 수 있습니다. 사용 기간이 아닌 제외 기간인 점을 상기하시길 바랍니다. 이 기능을 통해 우리는 전체 기간이 아닌 가까운 특정 시점부터의 전략 적용 효과를 확인할 수 있습니다. 또한 사용자가 전략을 사용한 시점부터의 효과를 명백히 구분할 수 있습니다.
4. 또한 사용자가 적용을 원하지 않는 하루 중의 특정 시간대에 전략 사용을 멈출 수도 있습니다. 이는 위에 설명한 Enalbe Date Filter와 유사하게 작동합니다. 이를 통해 당신이 온전히 이 전략을 신뢰하지 못하여도 당신은 마음 편하게 잠에 들 수 있습니다.
5. RSI의 기간 및 과매수, 과매도 수치를 개별적으로 설정할 수 있습니다. 예를 들어 당신이 롱 포지션을 취할 때에는 RSI를 7의 기간으로 설정할 수 있고, 동시에 숏 포지션을 진입하는 RSI는 14의 기간으로 설정될 수 있습니다. 또한 과매수 및 과매도의 기준 수치를 당신이 합리적이라고 생각하는 수준으로 설정할 수 있습니다. 이 수치는 볼린져밴드와 함께 작동하여 그것을 넘어서거나 다시 되돌아올 때 포지션 진입에 영향을 미칩니다.
6. API 선물거래를 기준으로 하여 기본적인 슬리피지와 커미션이 적용되어있습니다. 이는 시장가 거래에 맞춰져 있습니다. 이는 당신의 수익을 좀 더 합리적인 수치로 보일 수 있게 합니다.
Chartart에게 특별히 감사합니다. 당신은 천재입니다.

Combine & Merge Candlesticks + EMACombine & Merge Candlesticks with EMA
You can do the following:-
1 min - look back 5 (5 min) up to 15 (15 min)
5 min - look back 3 (15 min) up to 12 (1 hour)
15 min - look back 4 (1 hour) up to 16 ( 4 hours)
1 hour - look back 4 (4 hours) up to 8 (8 hours - 1 trading session)
4 hour - look back 2 (8 hours - 1 trading session) up to 6 ( 1 Day)
1 day - look back 5 ( 1 week)

TradingGroundhog - Strategy & Wavetrend V2#-- Public Strategy - No Repaint - Fractals - Wavetrend --
Here I come with another script, a nice and simple strategy based on fractals and Wavetrends.
#-- Synopsis --
A simple idea, on a small time frame (15 min) we buy when the opening price goes below a Bottom fractals and sell when it goes over a Top fractals, but in order to avoid bad and evil downtrends, we use Wavetrends based on a Daily time frame. From it, Tops and Bottoms are extracted. If the opening price goes above Wavetrend Tops, no trades will be conducted during the day. If the price goes below Wavetrend bottoms, no trades will be executed from 1 to N days, until a new Wavetrend bottom is generated.
I developed the strategy using BTC /EUR 15 MIN BINANCE but it can be applied to many other cryptos, I don't know for forex or others. You can use it for long term and automated trading, I implemented the Wavetrend indicator to do so, or for short term if you have spot a long coming uptrend. Test it, look at its profit and long or short period on your crypto of choice.
#-- Graph reading --
And now, how to read it ?
Wavetrends:
Red Backgrounds are associated to No Trade periods. These periods occur when the price goes below a Wavetrend bottom or above a Wavetrend Top. They are here to limit the loss.
Blue Gradient lines represent the past Tops. For each bar, only the increasing values of the Wavetrend tops are acquired. Going from light to dark blue based on the age of the Tops. Thus, if on line goes from dark to light, this means the price is approaching a previous Wavetrend top. In the opposite, if it darken, thus the price say 'buy buy' and go dropping.
Yellow Gradient lines represent the past Bottoms. They are based on the same principe that the blue lines.
Fractals:
Yellow Flags occur when the opening price goes below a Bottom fractal , it means Buy.
White Flags appear when the opening price goes over a Top fractal , it means Sell.
#-- Parameters --
*** Parameters have been intensively optimized using 10 cryptocurrency markets in order to have potent efficiency for each of them. I would recommend to only change the Can Be touch parameter. For the others, I don't recommend any modifications. The idea behind the script is to be able to switch between markets without having to optimize parameters, less work, easy to target active crypto and therefor limit the risks. ***
Can be touch :
'Combined Smoothness' : The number of open individuals used by the Wavetrend. (6 or 9, often 9 is better but with less volatile crypto it will be 6)
'Filter fractals' : Activate or Disable the filtering fractal operation. If Enable, buy during less risky periods. (Disable is often better)
Can be touch but not necessary :
'VolumeMA' : The Volume corrector used by the fractals
'Extreme window' : The number of price individuals to look for if we want to remove extreme fractals.
Not to touch :
'Limit_candle to look on' : Number of candles to use to compute the Wavetrend Tops and Bottoms.
'Length top bottom drawn' : Size of the lines
'Long Sop Loss (%)' : The minimal difference of price between a Fractal bottom and the opening price to buy.
#-- Time frame --
Should be used with the following time frames depending on the necessity:
1 MIN
3 MIN (Interesting for short term profit, may need some parameter ajustements)
5 MIN
15 MIN (Preferred for long term profit, the script was developed on it)
#-- Last words --
The script can be set up to send Tradingview signals to 3comma just by adding comment = " " in strategy.close_all() and strategy.entry().
Good trades !
Disclaimer (As it should always be one to any script)
***
This script is intended for and only to be used for personal purposes only. No such information provided by it constitutes advice or a recommendation for any investment or trading strategy for any specific person. There is no guarantee presented or implied as to the accuracy of specific forecasts, projections, or predictive statements offered by the script. Users of the script agree that its original developer does not take responsibility for any of your investment decisions. Please seek professional advice before trading.
***
# Here are the results from the 1rst of July 2021 with 100% of equity on the BTC /EUR 15 Min and with a capital of 1 000 EUR.
# As I saw, it goes from +20% to more than +100% depending on the selected crypto. Sometimes it's negative but it's quite rare on crypto using the EUR.

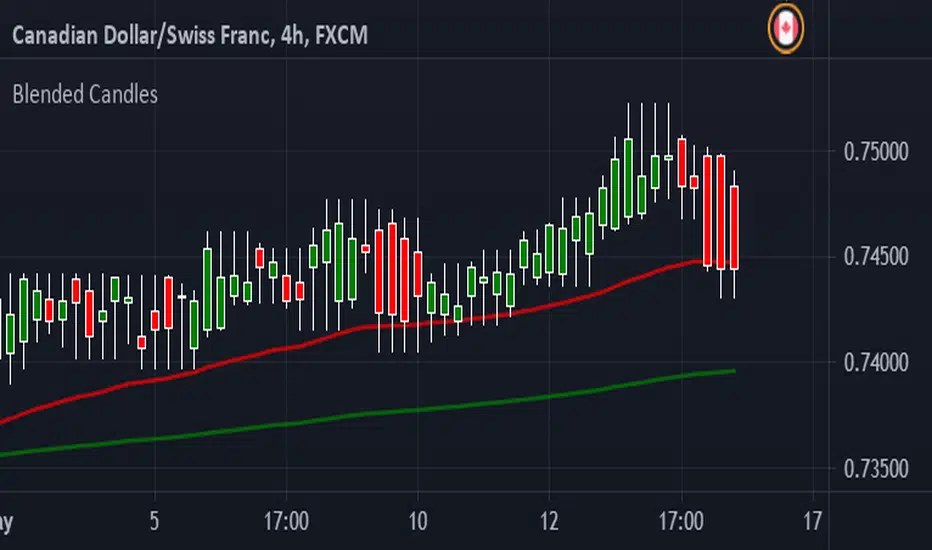
Blended CandlesHave been looking at YouTube and found a few videos about Blended Candles. Couldn't find a script here so I decided to script something myself.
I have also added a couple of EMA's, saves having to put them in individually.
You can Look Back as far back as you want but I find that each time frame looks better if you keep it to multiple of the next
IE : 1 min - look back 5 (5 min) up to 15 (15 min)
5 min - look back 3 (15 min) up to 12 (1 hour)
15 min - look back 4 (1 hour) up to 16 ( 4 hours)
1 hour - look back 4 (4 hours) up to 8 (8 hours - 1 trading session)
4 hour - look back 2 (8 hours - 1 trading session) up to 6 ( 1 Day)
1 day - look back 5 ( 1 week)
Shooting stars, Hammers and Doji's are very easy to recognize
Long wicks on top - Bearish
Long wick on bottom - Bullish
Support and Resistance is easier to spot as well :-)
Hope this helps someone - defiantly helps me time entries
Comments welcome and Happy Trading
VPoC per barThis study prints the current bar VPoC as an horizontal line.
It's aimed originally at BTCUSDT pair and 15m timeframe.
HOW IT WORKS
Zoom In mode: This is the default mode.
The study zooms in into the latest 15 1-minute bar candles in order to calculate the 15 minute candle VPoC.
Zoom Out mode: The VPoC from the last n bars from the current timeframe that match desired timeframe is shown on each bar.
In either case you are recommended to click on the '...' button associated to this study
and select 'Visual Order. Bring to Front.' so that it's properly shown in your chart.
HOW IT WORKS - Zoom In mode
Make sure that '(VP) Zoom into the VP timeframe' setting is set to true.
Choose the zoomed in timeframe where to calculate VPoC from thanks to the '(VP) Zoomed timeframe {1 minute}' setting.
Change '(VP) Zoomed in timeframe bars per current timeframe bar {15}' to its appropiated value. You just need to divide the current timeframe minutes per the zoomed in timeframe minutes per bar. E.g. If you are in 60 minute timeframe and you want to zoom in into 5 minute timeframe: 60 / 5 = 12 . You will write 12 here.
HOW IT WORKS - Zoom Out mode
Make sure that '(VP) Zoom into the VP timeframe' setting is set to false.
If you are using the Zoom out mode you might want to set '(VP) Print VPoC price as discrete lines {True}' to false.
Either choose the zoommed out timeframe where to calculate VPoC from thanks to the '(VP) Zoomed timeframe {1 minute}' setting or turn on the '(VP) Use number of bars (not VP timeframe)' setting in order to use '(VP) Number of bars {100}' as a custom number of bars.
WARNING - Zoom In mode last bar
The way that PineScript handles security function in last bar might result on the last bar not being accurate enough.
SETTINGS
__ SETTINGS - Volume Profile
(VP) Zoomed timeframe {1 minute}: Timeframe in which to zoom in or zoom out to calculate an accurate VPoC for the current timeframe.
(VP) Zoomed in timeframe bars per current timeframe bar {15}: Check 'HOW IT WORKS - Zoom In mode' above. Note : It is only used in 'Zoom in' mode.
(VP) Number of bars {100}: If 'Use number of bars (not VP timeframe)' is turned on this setting is used to calculate session VPoC. Note : It is only used in 'Zoom out' mode.
(VP) Price levels {24}: Price levels for calculating VPoC.
__ SETTINGS - MAIN TURN ON/OFF OPTIONS
(VP) Print VPoC price {True}: Show VPoC price
(VP) Zoom into the VP timeframe: When set to true the VPoC is calculated by zooming into the lower timeframe. When set to false a higher timeframe (or number of bars) is used.
(VP) Realtime Zoom in (Beta): Enable real time zoom for the last bar. It's beta because it would only work with zoomed in timeframe under 60 minutes. And when ratio between zoomout and zoomin is less than 60. Note : It is only used in 'Zoom in' mode.
(VP) Use number of bars (not VP timeframe): Uses 'Number of bars {100}' setting instead of 'Volume Profile timeframe' setting for calculating session VPoC. Note : It is only used in 'Zoom out' mode.
(VP) Print VPoC price as discrete lines {True}: When set to true the VPoC is shown as an small line in the center of each bar. When set to the false the VPoC line is printed as a normal line.
__ SETTINGS - EXTRA
(VP) VPoC color: Change the VPoC color
(VP) VPoC line width {1}: Change VPoC line width (in pixels).
(VP) Use number of bars (not VP timeframe): Uses 'Number of bars {100}' setting instead of 'Volume Profile timeframe' setting for calculating session VPoC. Note : It is only used in 'Zoom out' mode.
(VP) Print VPoC price as discrete lines {True}: When set to true the VPoC is shown as an small line in the center of each bar. When set to the false the VPoC line is printed as a normal line.
CREDITS
I have reused and adapted some code from
"Poor man's volume profile" study
which it's from TradingView IldarAkhmetgaleev user.

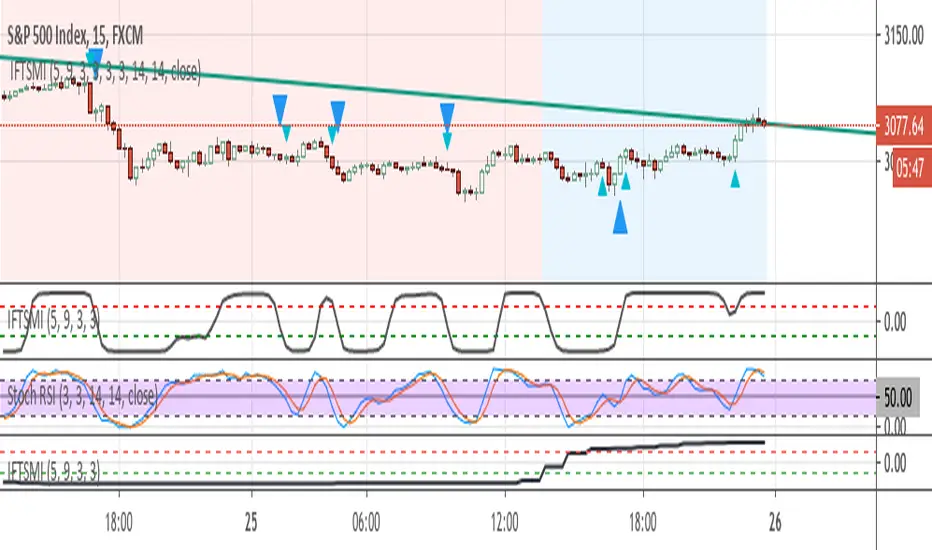
Inverse Fisher Transform of SMI and sto. RSI, MTF confirmedThe system uses 1 hour and 15 min timeframe data. Signals coming from 15 min Inverse Fisher Transform of SMI and stochastic RSI are confirmed by 1 hour Inverse Fisher Transform SMI, according to the following rules:
long cond.: 15 min IFTSMI crosses ABOVE -0.5 or SRSI k-line crosses ABOVE 50 while 1-hour IFTSMI is already ABOVE -0.5
short cond.:15 min IFTSMI crosses BELOW 0.5 or SRSI k-line crosses BELOW 50 while 1-hour IFTSMI is already BELOW 0.5
SMI and Inverse Fisher Transform of SMI codes belong to @kivancozbilgic.
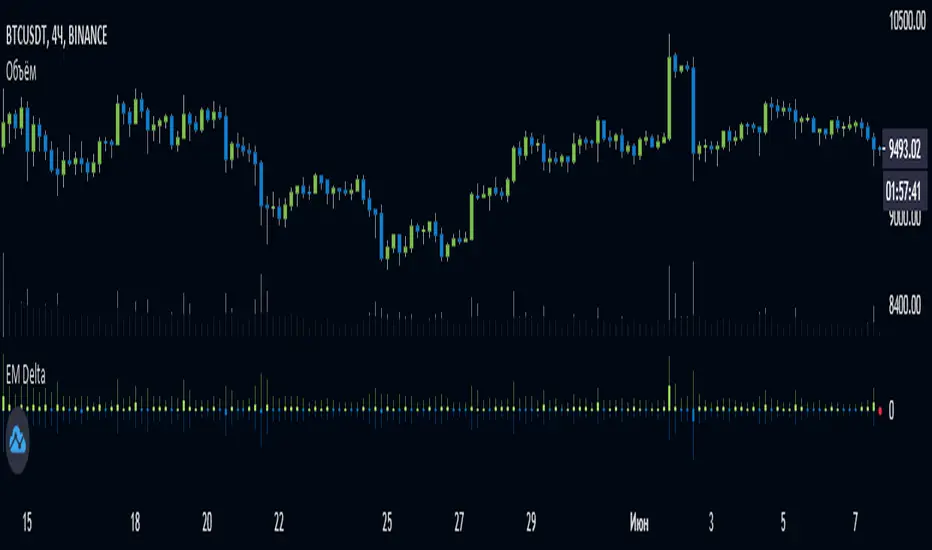
EulerMethod: DeltaEN
Shows the Integral Volume Delta (IVD)
It is a detailed OBV. Each bar sums up the volume for bars of a shorter timeframe.
For example, inside a 1M bar, every 12h bar is added up, and inside a 1h bar, every 1min bar is added. Thus, a conditional volume delta inside the bar is obtained.
The indicator for each bar shows the volume of purchases (positive), sales (negative) and the difference — IVD
The delta histogram is thicker than the volume histograms
Settings detalisation
M — 6 hours, 12 hours and 1 day for the M timeframe (720 by default)
W — 4 hours, 6 hours and 12 hours for the W timeframe (240 by default)
D — 30 minutes, 1 hour and 2 hours for the D timeframe (60 by default)
H — 1 minute, 5 minutes and 15 minutes for timeframes [1h, D) (default is 1)
For timeframes of 15m and less, the calculation is carried out by minute bars
VSA mode
The classic OBV adds volume to the cumulative sum under the condition Сlose (n) > Close (n-1) and subtracts it under the condition Close (n) < Close (n-1)
When VSA mode is disabled, all volumes are summed up under these conditions.
When the VSA approximation is turned on, the volume per bar of detail is divided by the factor (Close - Low) / (High - Low)
That is, it takes into account the spread per bar and closing relative to the spread. VSA is enabled by default
A/D mode
Shows the cumulative Accumulation / Distribution Index
The delta of the detail bar is multiplied by (High + Low + Close) / 3 bars, the result is added to the cumulative sum
No additional price conversions required due to integral summation
Index line view is customizable
EM Delta does not receive intermediate values in real time.
To see the result, wait until the bar closes or switch to a smaller timeframe
RU
Показывает Интегральную Дельту Объёма (ИДО)
Представляет собой детализированный OBV. В каждом баре суммируется объём за бары меньшего таймфрейма.
Например, внутри 1М-бара суммируется каждый 12h-бар, а внутри 1h — каждый 1m-бар. Таким образом получается условная дельта объёма внутри бара
Индикатор на каждый бар показывает объём покупок (положительный), объём продаж (отрицательный) и разницу — ИДО
Гистограмма дельты толще гистограмм объёмов
Настройки детализации внутри бара
M — 6 часов, 12 часов и 1 день для таймфрейма M (по-умолчанию 720)
W — 4 часа, 6 часов и 12 часов для таймфрейма W (по-умолчанию 240)
D — 30 минут, 1 час и 2 часа для таймфрейма D (по-умолчанию 60)
H — 1 минута, 5 минут и 15 минут для таймфреймов [1h, D) (по-умолчанию 1)
Для таймфреймов 15m и меньше расчёт ведётся по минутным барам
Режим VSA
Классический OBV прибавляет объём к кумулятивной сумме при условии Сlose(n) > Close(n-1) и отнимает при условии Close(n) < Close(n-1)
При отключении режима VSA все объёмы суммируются по этим условиям
При включённой VSA-аппроксимации объём за бар детализации делится по фактору (Close - Low) / (High - Low)
То есть учитывает спред за бар и закрытие относительно спреда. По-умолчанию режим VSA включен
Режим A/D
Показывает кумулятивный индекс Накопления/Распределения
Дельта бара детализации умножается на (High + Low + Close) / 3 бара, результат прибавляется к кумулятивной сумме
Дополнительные преобразования цены не требуются ввиду интегрального суммирования
Вид линии индекса настраивается
EM Delta не получает промежуточные значения в реальном времени.
Чтобы увидеть результат, дождитесь закрытия бара или перейдите на меньший таймфрейм
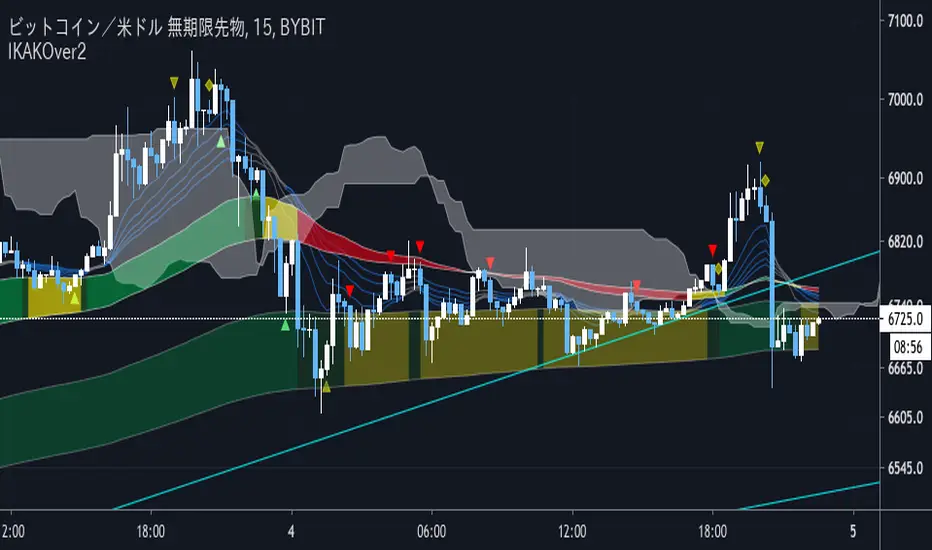
IKAKOver2(LITE雲なし)
change point
I tried to make the operation lighter by removing the display of the Ichimoku balance table.
We have set a period such as EMA to use 5 minute bars and the first band is period 60 and 100 EMA . The color of the belt changes according to the position of the period 5EMA-25EMA-50EMA. The second sash is based on a 60- and 100-EMA period of 15 minutes. The change in the color of the obi is also a 15-minute specification.
Since the above period can be changed, I think that there are customs such as 1 hour and 4 hours.
Buying and selling signs are shown in green for buying and red for selling. (More frequent)
For the time being, it is also possible to display the Ichimoku balance table.
As for my usage method, when both the 15-minute and 5-minute bars have an uptrend (downtrend ), when each trading sign is confirmed, spread the limit just below the price. . (Because there is a commission in the market)
If the color of the obi becomes yellow, the trend may be over, so wait for the signature to reach the bundle of 15 minutes instead of 5 minutes, and after the signature is confirmed, it is the same as 5 minutes.
The loss cut line is often the latest low. Or when the obi is broken. .
I am still studying about profitability. Sometimes we use indicators, sometimes we reach the target horizon. I think each way is good.
It is a discretionary aid, and the head and tail are cut off, and the image is about 10 to 100 $.
IKAKOver2change point
Improve the accuracy of reverse sign
Adding a signature using only RCI
変更点
逆張りのサインと順張りのサインを区別し、逆張りのサインは騙しができるだけ少なくなるように精度を上げました。
逆張りか順張りかは10emaと100emaの位置関係だけで区別しています。
また、RCIのみを利用した、レンジ相場用のサインを追加しました。
We have set a period such as EMA to use 5 minute bars and the first band is period 60 and 100 EMA . The color of the belt changes according to the position of the period 5EMA-25EMA-50EMA. The second sash is based on a 60- and 100-EMA period of 15 minutes. The change in the color of the obi is also a 15-minute specification.
Since the above period can be changed, I think that there are customs such as 1 hour and 4 hours.
Buying and selling signs are shown in green for buying and red for selling. (More frequent)
For the time being, it is also possible to display the Ichimoku balance table.
As for my usage method, when both the 15-minute and 5-minute bars have an uptrend (downtrend ), when each trading sign is confirmed, spread the limit just below the price. . (Because there is a commission in the market)
If the color of the obi becomes yellow, the trend may be over, so wait for the signature to reach the bundle of 15 minutes instead of 5 minutes, and after the signature is confirmed, it is the same as 5 minutes.
The loss cut line is often the latest low. Or when the obi is broken. .
I am still studying about profitability. Sometimes we use indicators, sometimes we reach the target horizon. I think each way is good.
It is a discretionary aid, and the head and tail are cut off, and the image is about 10 to 100 $.
Price Action and 3 EMAs Momentum plus Sessions FilterThis indicator plots on the chart the parameters and signals of the Price Action and 3 EMAs Momentum plus Sessions Filter Algorithmic Strategy. The strategy trades based on time-series (absolute) and relative momentum of price close, highs, lows and 3 EMAs.
I am still learning PS and therefore I have only been able to write the indicator up to the Signal generation. I plan to expand the indicator to Entry Signals as well as the full Strategy.
The strategy works best on EURUSD in the 15 minutes TF during London and New York sessions with 1 to 1 TP and SL of 30 pips with lots resulting in 3% risk of the account per trade. I have already written the full strategy in another language and platform and back tested it for ten years and it was profitable for 7 of the 10 years with average profit of 15% p.a which can be easily increased by increasing risk per trade. I have been trading it live in that platform for over two years and it is profitable.
Contributions from experienced PS coders in completing the Indicator as well as writing the Strategy and back testing it on Trading View will be appreciated.
STRATEGY AND INDICATOR PARAMETERS
Three periods of 12, 48 and 96 in the 15 min TF which are equivalent to 3, 12 and 24 hours i.e (15 min * period / 60 min) are the foundational inputs for all the parameters of the PA & 3 EMAs Momentum + SF Algo Strategy and its Indicator.
3 EMAs momentum parameters and conditions
• FastEMA = ema of 12 periods
• MedEMA = ema of 48 periods
• SlowEMA = ema of 96 periods
• All the EMAs analyse price close for up to 96 (15 min periods) equivalent to 24 hours
• There’s Upward EMA momentum if price close > FastEMA and FastEMA > MedEMA and MedEMA > SlowEMA
• There’s Downward EMA momentum if price close < FastEMA and FastEMA < MedEMA and MedEMA < SlowEMA
PA momentum parameters and conditions
• HH = Highest High of 48 periods from 1st closed bar before current bar
• LL = Lowest Low of 48 periods from 1st closed bar from current bar
• Previous HH = Highest High of 84 periods from 12th closed bar before current bar
• Previous LL = Lowest Low of 84 periods from 12th closed bar before current bar
• All the HH & LL and prevHH & prevLL are within the 96 periods from the 1st closed bar before current bar and therefore indicative of momentum during the past 24 hours
• There’s Upward PA momentum if price close > HH and HH > prevHH and LL > prevLL
• There’s Downward PA momentum if price close < LL and LL < prevLL and HH < prevHH
Signal conditions and Status (BuySignal, SellSignal or Neutral)
• The strategy generates Buy or Sell Signals if both 3 EMAs and PA momentum conditions are met for each direction and these occur during the London and New York sessions
• BuySignal if price close > FastEMA and FastEMA > MedEMA and MedEMA > SlowEMA and price close > HH and HH > prevHH and LL > prevLL and timeinrange (LDN&NY) else Neutral
• SellSignal if price close < FastEMA and FastEMA < MedEMA and MedEMA < SlowEMA and price close < LL and LL < prevLL and HH < prevHH and timeinrange (LDN&NY) else Neutral
Entry conditions and Status (EnterBuy, EnterSell or Neutral)(NOT CODED YET)
• ENTRY IS NOT AT THE SIGNAL BAR but at the current bar tick price retracement to FastEMA after the signal
• EnterBuy if current bar tick price <= FastEMA and current bar tick price > prevHH at the time of the Buy Signal
• EnterSell if current bar tick price >= FastEMA and current bar tick price > prevLL at the time of the Sell Signal
