St_cumulativeI decided to publish one of my "old" indicators on market sentiment, with possible reversal points. The indicator has 1 parameter-the period. It is based on the fact that the average between the maximum and minimum for the period is displayed, and then the difference between the average line and the maximum of the candle or the minimum (depending on the color of the candle) accumulates. If the indicator is in the positive zone and is colored green, then the trend is up, if it is in the positive zone, but white, then the upward trend may be completed, similarly with a fall, in the negative zone and red is a falling trend, in the negative zone and white-the fall may be completed. It is better to take periods to bind to natural periods If the schedule is 1 minute, then take a period of 60-equal to an hour, if the hour is 24 (day), if the day is 7 (week) or 30 (month)
Cari dalam skrip untuk "豪24配债"

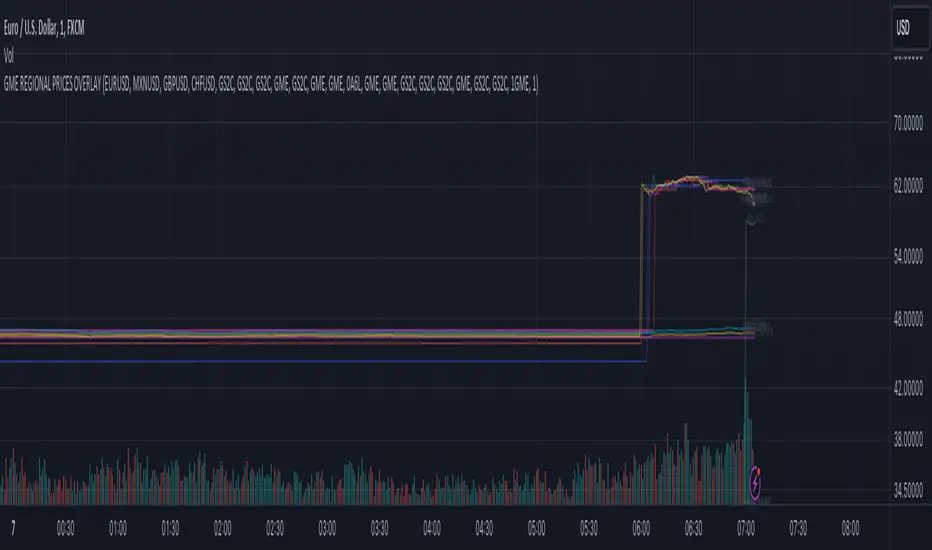
GME REGIONAL PRICES OVERLAYGME Regional Prices Overlay (VWAP)
1. Select a chart 24-hour ticker like FX_IDC:USDEUR
2. Select a timescale (5 min, 15 min, ...)
3. Monitor the regional price variance
Exchanges included: NYSE, XETR, BMV, FWB, SWB, BITTREX, FTX, LSE, CAPITALCOM (CFD)
Currency conversion: FX_IDC
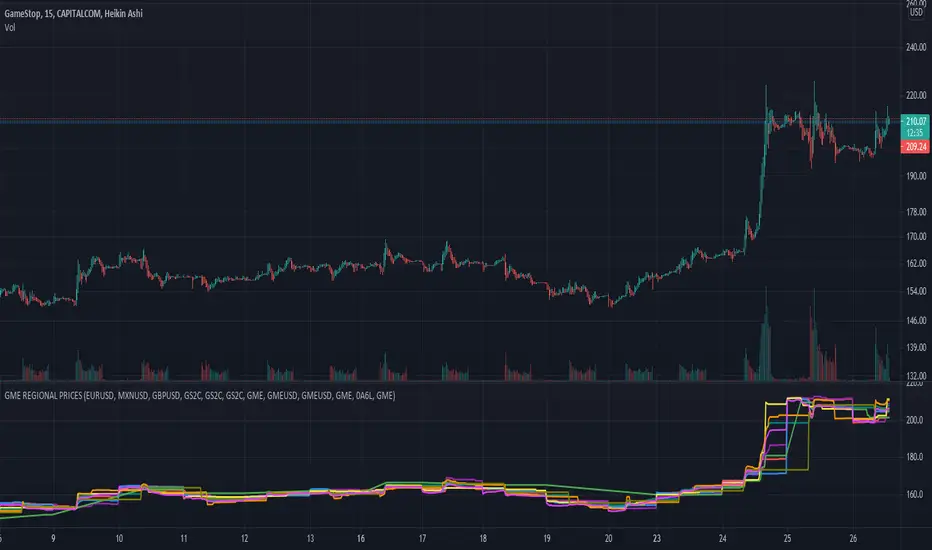
GME REGIONAL PRICESGME Regional Prices
1. Select a chart 24-hour ticker like CAPITALCOM:GME
2. Select a timescale (5 min, 15 min, ...)
3. Monitor the regional price variance
Exchanges included: NYSE, XETR, BMV, FWB, SWB, BITTREX, FTX, LSE, CAPITALCOM (CFD)
Currency conversion: FX_IDC
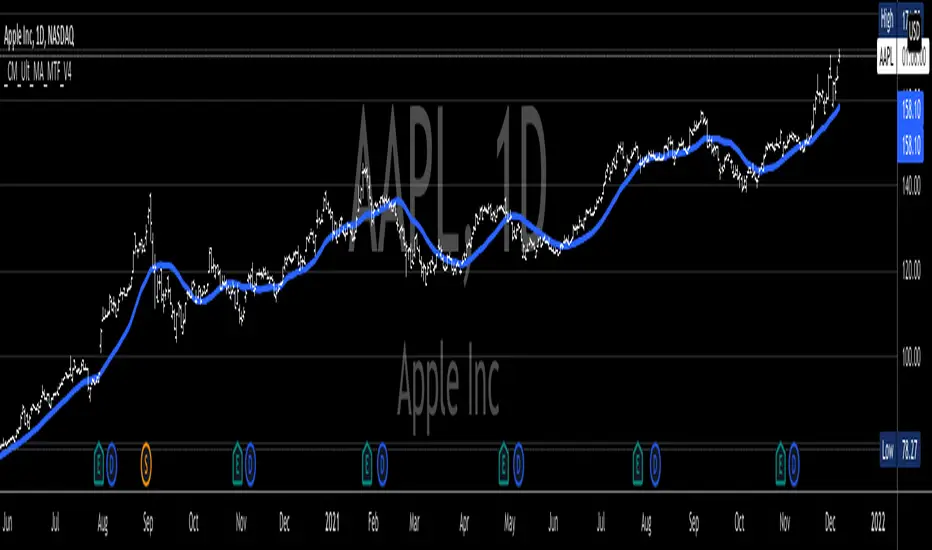
_CM_Ultimate_MA_MTF_V4***For a Detailed Video Overview Showing all of the Settings...
Click HERE to View Video
New _CM_Ultimate_MA_MTF_V4 - Update - 08-24-2021
Thanks to @SKTennis for help with code
Added Ability to Plot 1 or 2 Moving Averages - Fast MA & Slow MA
Added Ability to Plot Fast MA with Multi TimeFrame
Added Ability to Plot Slow MA with Multi TimeFrame
Added Ability to Color Fast MA Based on Slope of MA
Added Ability to Color Fast MA based on being Above/Below Slow MA
Added Ability to Plot 8 Types of Moving Averages
Simple, Exponential, Weighted, Hull, VWMA, RMA, TEMA, & Tilson T3
Added Ability to Set Alerts Based on:
Slope Change in the Fast MA Or Fast MA Crossing Above/Below Slow MA.
Added Ability to Plot "Fill" if Both Moving Averages are Turned ON
Added Ability to control Transparency of Fill
Added Alerts to Settings Pane.
Customized how Alerts work. Must keep Checked in Settings Pane, and When you go to Alerts Panel, Change Symbol to Indicator (_CM_Ultimate_MA_MTF_V4)
Customized Alerts to Show Symbol, TimeFrame, Closing Price, & Moving Average Signal Name in Alert
Alerts are Pre-Set to only Alert on Bar Close
See Video for Detailed Overview
New Updates Coming Soon!!!
***Please Post Feedback and Any Feature Requests in the Comments Section Below***
Unusual Time Frame VolumeThis script plots the ratio of each volume bar to the average daily volume of that specific bar (at that specific time of day).
You can see what the volume at the 09:30 (or whenever) bar looks like compared to the average volume at the same time during the previous X number of days.
The output can be read like a normal volume chart; however, you can see at a glance whether these is more volume than "normal" for that time of day.
A value of "2" would be 2x the "normal" volume; a value of "0.5" would be half.
Thus, if bars exceed the value of "1", you know that there is more volume than normal.
If the bar exceeds an adjustable threshold, it will change the color of the bar to yellow; otherwise it will be orange for values exceeding "1".
As a consequence to this approach, the plot is effectively normalized such that it obviates the need to scale up or down as volume changes throughout the day.
Notes:
If the settings are not set appropriately for your mode and time frame, the output will be incorrect/invalid!
Make sure you set the "Asset Mode" and "Time Frame (minutes)" to values that match your asset and chart setting. For example, if you are trading Futures on a 2m chart, set the Asset Mode to Futures and Time Frame to 2m. If you are trading crypto on a 5m chart, set the Asset Mode to 24/7 and Time Frame to 5m.
If you choose a "Look-back (Days)" setting that is too far back given the time frame, the script will produce an error. I suggest playing with settings from 1 (compares volume to the previous day's volume) to the highest number that doesn't break the script. For example, at a 2m time frame, the maximum look-back will be 6-7 depending on which mode you are using. Longer time frames allow larger look-back values. I find that the default value (6 Days) does a decent job in general.

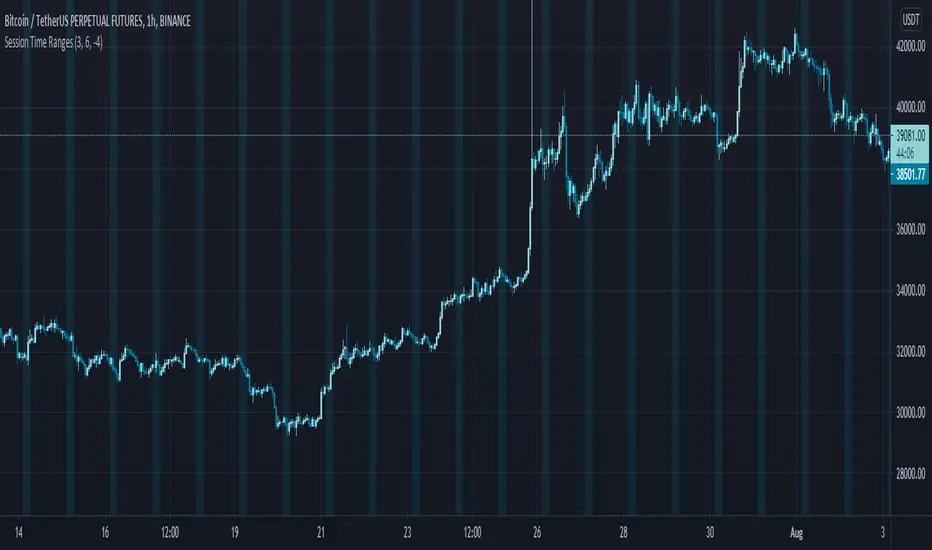
Session Time RangesHave you ever wondered if you are trading at the right time of the day or feel like all the good trades happen when you are sleeping? Well now you can check your theory :)
This Script allows you to highlight a time range on your chart over a 24hour time period. For example 3AM to 6AM
The script has two time variables, set your start time and end time based on a 24 hour clock and set the time zone offset variable to match your charts time zone. For example New York -4 (for utc just enter 0 for no offset )
This is a quick script I put together so hopefully it is error free enjoy :)
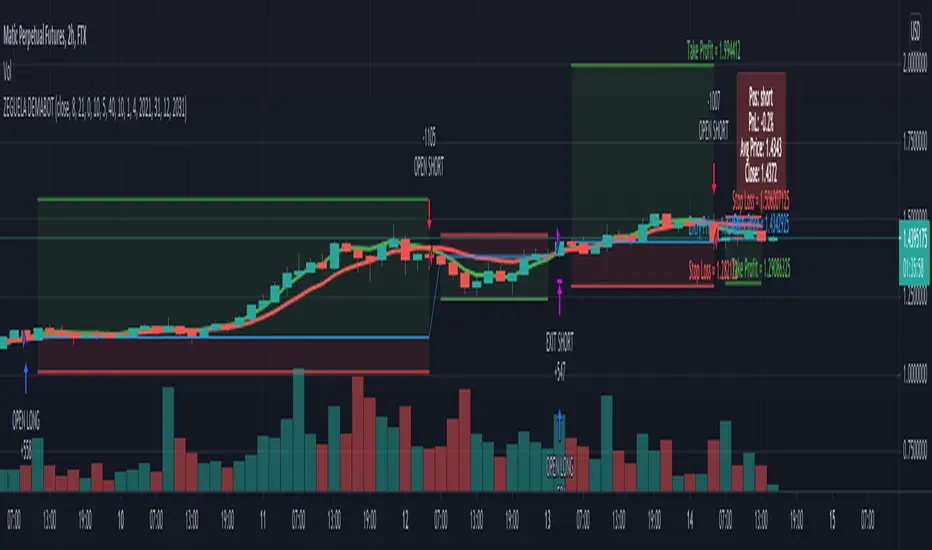
ZEGUELA DEMABOTSwing trading bot strategy. This indicator uses Dema 8 and Dema 24 crosses to throw buy and sell signals. You can also se take profit and stop loss parameters
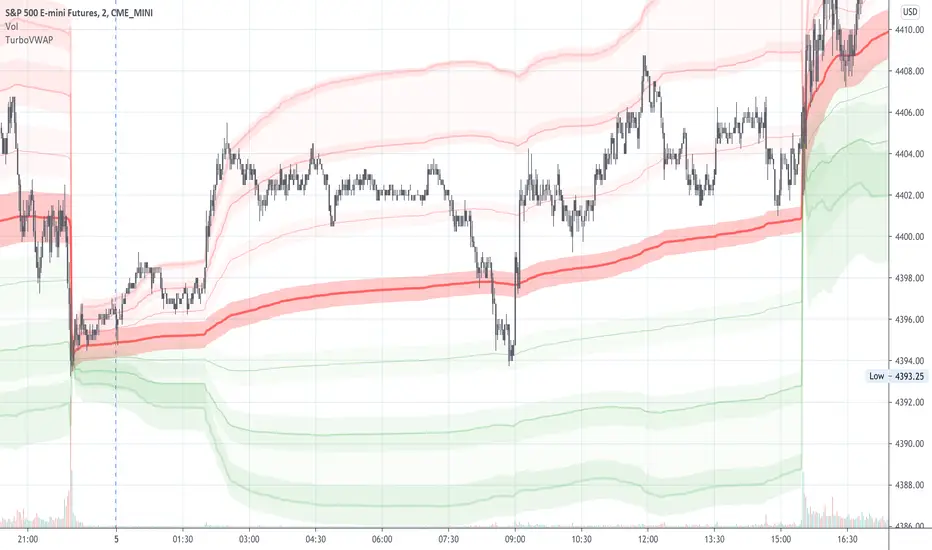
TurboVWAPVWAP indicator based in the built-in one but completely rewritten. Features:
- more standard deviation bands, up to 3.
- added the possibility to not anchor the VWAP but make it a rolling one instead, like a VWMA, being in this case able to specify days, hours or minutes for the rolling VWAP.
- for rolling VWAPs, the indicator doesn't count bars but real days, hours or minutes instead, so regardless of the chart timeframe the indicator will always show the correct values.
- for rolling VWAPs, if you specify x days as the rolling time, the indicator will always count exactly 24 hours from the current time backwards - so, from the same time yesterday or x days ago.
- in rolling VWAPs, although the indicator counts real time elapsed as per your settings and not chart bars, it will automatically skip holidays, so you needn't worry about that.
- for the anchored VWAP, added the possibility to specify custom session times (for example, for ES 0830-1500, instead of Globex, which is the Tradingview default as of today)
- complete customization of all fills and linetypes
For illustration purposes in the attached 1min chart I have:
- a 30min rolling VWAP in BLUE with no standard deviation plots,
- a 1 day rolling VWAP in RED with standard deviations in light red and green (these are the default settings)
- a RTH-session-anchored VWAP in ORANGE with standard deviations in light orange and light blue
Anas center line the center line is taken from one method if spliting the screen in two haves , if the price comes to the upper half its up , if going to lower half its sell , I add to make ne lower low and to confirm the direction .
I recomminded to but the same time period of the time frame .
1 min frame = 60
1 hour frame = 24
1 month == 22 (working day candles )
and test for best result .

Technical Ratings on Multi-frames / Assets█ OVERVIEW
This indicator is a modified version of TECHNICAL RATING v1.0 available in the public library to provide a quick overview of consolidated technical ratings performed on 12 assets in 3 timeframes.The purpose of the indicator is to provide a quick overview of the current status of the custom 12 (24) assets and to help focus on the appropriate asset.
█ MODIFICATIONS
- Markers, visualizations and alerts have been deleted
- Due to the limitation on maximum number of security (40), the results of 12 assets evaluated in 3 different time frames can be shown at the same time.
- An additional 12 assets can be configured in the settings so that you do not have to choose each ticker one by one to facilitate a quick change, but can switch between the 12 -12 assets with a single click on "Second sets?".
- The position, colors and parameters of the table can be widely customized in the settings.
- The 12 assets can be arranged in rows 3, 4, 6 and 12 with Table Rows options, which can also be used to create a simple mobile view.
- The default gradient color setting has been changed to red/yellow/green traffic lights
ORIGINAL DESCRIPTION ABOUT TECHNICAL RATING v1.0
█ OVERVIEW
This indicator calculates TradingView's well-known "Strong Buy", "Buy", "Neutral", "Sell" or "Strong Sell" states using the aggregate biases of 26 different technical indicators.
█ WARNING
This version is similar, but not identical, to our recently published "Technical Ratings" built-in, which reproduces our "Technicals" ratings displayed as a gauge in the right panel of charts, or in the "Rating" indicator available in the TradingView Screener. This is a fork and refactoring of the code base used in the "Technical Ratings" built-in. Its calculations will not always match those of the built-in, but it provides options not available in the built-in. Up to you to decide which one you prefer to use.
█ FEATURES
Differences with the built-in version
• The built-in version produces values matching the states displayed in the "Technicals" ratings gauge; this one does not always.
• A strategy version is also available as a built-in; this script is an indicator—not a strategy.
• This indicator will show a slightly different vertical scale, as it does not use a fixed scale like the built-in.
• This version allows control over repainting of the signal when you do not use a higher timeframe. Higher timeframe (HTF) information from this version does not repaint.
• You can adjust the weight of the Oscillators and MAs components of the rating here.
• You can configure markers on signal breaches of configurable levels, or on advances declines of the signal.
The indicator's settings allow you to:
• Choose the timeframe you want calculations to be made on.
• When not using a HTF, you can select a repainting or non-repainting signal.
• When using both MAs and Oscillators groups to calculate the rating, you can vary the weight of each group in the calculation. The default is 50/50.
Because the MAs group uses longer periods for some of its components, its value is not as jumpy as the Oscillators value.
Increasing the weight of the MAs group will thus have a calming effect on the signal.
• Alerts can be created on the indicator using the conditions configured to control the display of markers.
Display
The calculated rating is displayed as columns, but you can change the style in the inputs. The color of the signal can be one of three colors: bull, bear, or neutral. You can choose from a few presets, or check one and edit its color. The color is determined from the rating's value. Between 0.1 and -0.1 it is in the neutral color. Above/below 0.1/-0.1 it will appear in the bull/bear color. The intensity of the bull/bear color is determined by cumulative advances/declines in the rating. It is capped to 5, so there are five intensities for each of the bull/bear colors.
The "Strong Buy", "Buy", "Neutral", "Sell" or "Strong Sell" state of the last calculated value is displayed to the right of the last bar for each of the three groups: All, MAs and Oscillators. The first value always reflects your selection in the "Rating uses" field and is the one used to display the signal. A "Strong Buy" or "Strong Sell" state appears when the signal is above/below the 0.5/-0.5 level. A "Buy" or "Sell" state appears when the signal is above/below the 0.1/-0.1 level. The "Neutral" state appears when the signal is between 0.1 and -0.1 inclusively.
Five levels are always displayed: 0.5 and 0.1 in the bull color, zero in the neutral color, and -0.1 and - 0.5 in the bull color.
█ CALCULATIONS
The indicator calculates the aggregate value of two groups of indicators: moving averages and oscillators.
The "MAs" group is comprised of 15 different components:
• Six Simple Moving Averages of periods 10, 20, 30, 50, 100 and 200
• Six Exponential Moving Averages of the same periods
• A Hull Moving Average of period 9
• A Volume-weighed Moving Average of period 20
• Ichimoku
The "Oscillators" group includes 11 components:
• RSI
• Stochastic
• CCI
• ADX
• Awesome Oscillator
• Momentum
• MACD
• Stochastic RSI
• Wiliams %R
• Bull Bear Power
• Ultimate Oscillator

Stochastic MomentumThis RSI indicator uses the difference between the K and D values in the Stochastic RSI indicator. Using the same layered lengths of 12, 24, 48 and 96 intervals that the Avg Stoch RSI indicator, this offers a rate of change momentum measurement. Crossovers are at zero, this indicator gives a clearer indicator of market momentum.

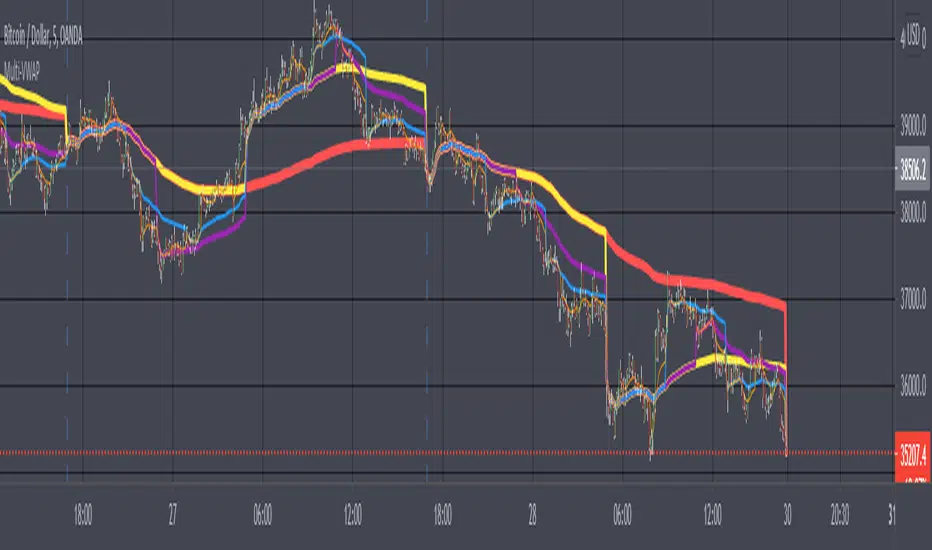
Multi-VWAPVolume Weighted Average Price (VWAP) Definition
What is the Volume Weighted Average Price (VWAP)?
The volume weighted average price (VWAP) is a trading benchmark used by traders that gives the average price a security has traded at throughout the day,
based on both volume and price. It is important because it provides traders with insight into both the trend and value of a security.
-Investopedia By JASON FERNANDO Reviewed by SOMER ANDERSON Updated Feb 24, 2021
-Choose from 5 different Timeframes (lower or higher)
Liquidation Levels
I got sick of calculating leverage all of the time, so I made this real time calculator. It is primarily for crypto derivatives.
It tracks and displays the liquidation price for 5 customisable leverage levels and plots them either historically and/or in real time, with labels beside each including the estimated price.
These calculations include maintenance margin and can be configured for linear futures (USDT) or non-linear futures. Never again make dumb mistakes that are obvious with a bit of maths.
To jazz it up, you can customise the colours, disable various labels, set different leverage multiples, and change the offsets and number of bars to plot in the past.
Alternatively, you can change the offset to 24 on an hourly chart and change show last bars to 0. By doing this, you can see which levels most often get liquidated. It is crude, I know, and there are better tools for tracking liquidation hunts. This is not an attempt to replace or compete with them.
Enjoy and trade safely.

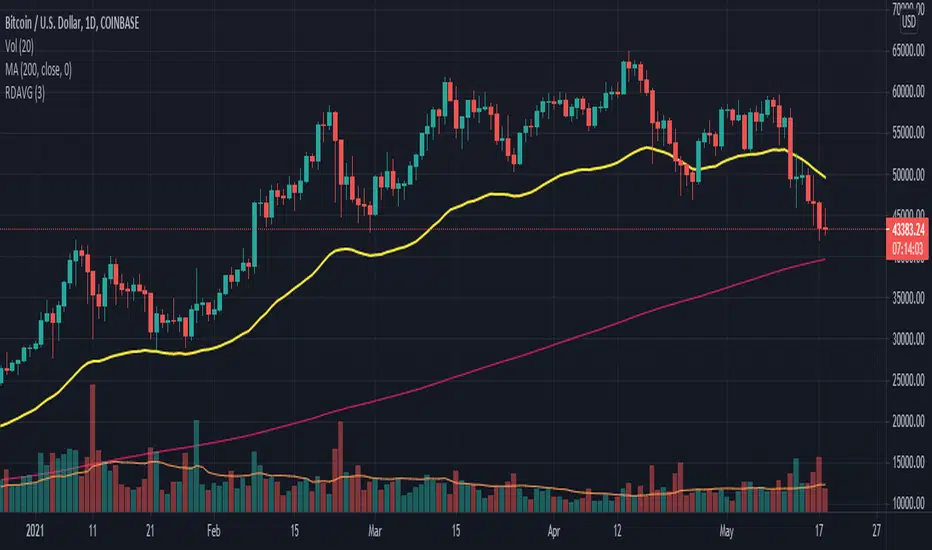
RexDog AverageYes, simple—the RexDog Average is a bias moving average indicator. The purpose is to provide the overall momentum bias you should have when trading an instrument. It works across all markets and all timeframes.
Usage:
Price above the RexDog AVG = long momentum bias
Price below the RexDog AVG = short momentum bias
*Note: we have banned the word “trend” in the RexDog Trading Method.
Additional Usage Advice:
If price rips through the average your momentum bias should probably change. 80% of the time when price moves through the RexDog Average it will come back and test the area around average within 1-2 bars. 20% of the time it does not. The momentum is so strong in that direction so look for a 50-70% tests of the bar that impulse through the RexDog Average.
If you are using the RexDog Trading Method by default if the price is above the average and you are short you are in a fade trade. The momentum trade would be long. Of course reverse if price is below.
On multiple time frames. Of course, one timeframe can be long bias and a lower timeframe can be short bias. Which one do you use? Both—if your in a short trade using lower timeframe and with the bias of the average your in a momentum trade—but on the higher timeframe your aware you are essential fading the overall momentum.
Background:
Rex and I searched high and low for one simple thing. A moving average (or combination of some) that we could use to form our momentum bias that worked for all timeframes and all markets we trade.
We tried and tested them all. Even went down the path of ribbons and various other types of hybrid EMA/MA derivatives. Nothing had a high enough accuracy or mathematically was reliable that we could say with a high probability that it was on the right side of the momentum.
We almost stopped and landed on using the true and tested 200 MA—but we found through extensive tests that using the 200MA or EMA you’re often late to the party. Look you don’t need to be the first one in the trade but having a heads up sure helps.
To quote one of the best financial movies of the modern era—Margin Call:
“There are three ways to make a living in this business: be first, be smarter, or cheat… it sure is a hell of a lot easier to be first”. The RexDog Average used properly enables you to be first or damn near close.
Under the Hood:
This is so simple most reading this will discount it. You might even scoff and berate Rex for wasting your time. But you would be wrong. The RexDog Average has been tested across all markets—FOREX, Crypto, Equities, Futures (even tick charts), and even the Penguin population in Antarctica.
The RexDog Average is an average of 6 simple moving averages: 200, 100, 50, 24, 9, 5.
Yes, that’s it.
The RexDog Average Plus will be released soon with additional parameters and most likely upper and lower bounds. In addition, we are working on a hybrid RexDog Exponential Average.
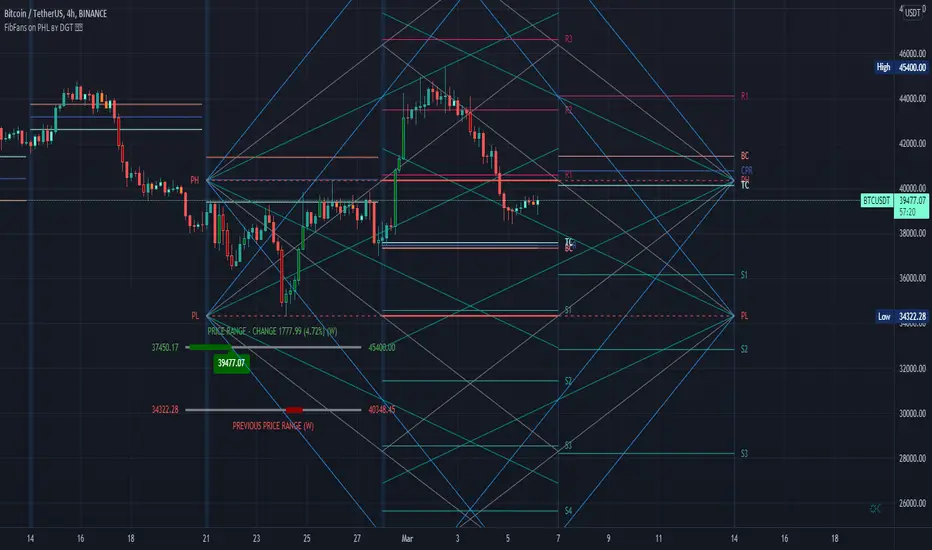
FibFans on Previous HTF HL [FaizanNawaz] by DGTFibonacci Fans application on top of Previous Higher TimeFrame High and Low. Idea owner is @faizannawaz1, special thanks to him for both the idea and tesing the application
WARNING : Study includes plottings in the future, and due to temporal gaps in non 7/24 markets such as weekends, holidays etc plotting of the fans will move to the open session (the effect will be observed on Friday and Monday). With crypto no any side affect will be observed.
More about Fibonacci Fans, how to apply fibonacci fans and automated fibonacci speed and resistance fans study
Adiitonally the study includes some addons, such as
Central Pivot Range and Traditional Pivot Points
Volume Weighted Colored Bars
Price Range Meter - Horizontal HTF Candle
Disclaimer :
Trading success is all about following your trading strategy and the indicators should fit within your trading strategy, and not to be traded upon solely
The script is for informational and educational purposes only. Use of the script does not constitute professional and/or financial advice. You alone have the sole responsibility of evaluating the script output and risks associated with the use of the script. In exchange for using the script, you agree not to hold dgtrd TradingView user liable for any possible claim for damages arising from any decision you make based on use of the script
The Last 5N Bars HLI made this script to watch the market on the timely manner.
Always set up per day and week.
- 1 hour chart 24, 4 hour chart 6, 15 min chart 96, etc
- Keep eyes on the similar bars on the same hour every day. As big players have regular working time every day.
- Labels ' position can show a trend

Ichimoku Crypto Cloud 11-30-61A minor adjustment to the original Ichimoku Cloud, changing periods to reflect the 24/7 open market of cryptocurrency.
TENKAN: 11 - a week and a half
KIJUN: 30 - one month
SENKOU: 61 - two months
For a simpler visualization, I made the cloud limit lines and the Chikou line invisible by default.

Day of month gain-lossSince March 2014 to date, on the 24 of each month, the crypto market has:
- lost more than 1% 30 times
- gained more than 1% 32 times

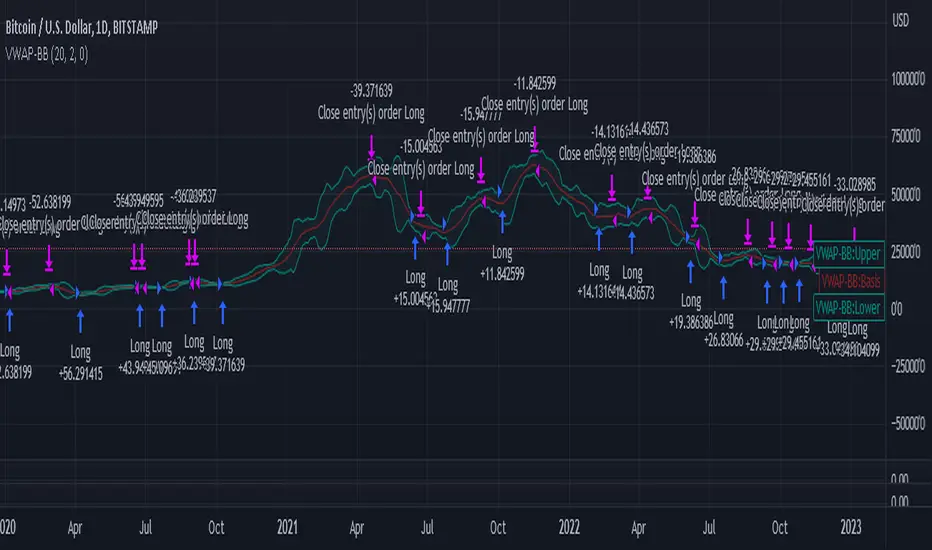
VWAP-Bollinger BandsThis script uses Bollinger bands but with a VWAP as the source, it uses the high crossing the upper band as a buy signal and a low crossing the lower band as a sell signal
Its default settings are for a day chart - Crypto 30 periods, forex 24 periods and stocks 20 periods, which basically line up with a month per asset class
ive seen good results in crypto and stocks, settings used between1% and 10% equity per trade with a 0.1% fee which lines up with Binance fee structure and $25 per trade which lines up with Commsec on the ASX
Initial Balance Monitoring PanelInitial Balance Monitoring Panel
Allows you to have an instant view of 16 Crypto pairs within a monitoring panel, monitoring Initial Balance (Asia, London, New York Stock Exchanges).
The code can easily be changed to suit the crypto pairs you are trading.
The setup of my chart would also include this indicator and the " Initial Balance Markets Time Zones - Overall Highest and Lowest " (with all IBs enabled) as shown above.
Initial Balance is based on the highest and lowest price action within the first 60 minutes of trading. Reading online this can depict which way the market can trend for the session.
The indicator has been coded for Crypto (so other symbols may not work as expected).
Though Initial Balance is based off the first 60 minutes of the trading markets opening, but Crypto is 24/7, this indicator looks at how Asia, London and New York Stock Exchanges opening trading can affect Crypto price action.
As the current Market sentiment is bullish if the price action fell below all Initial balances I would be looking at completing Technical Analysis for a long trade and to see if price action can find support from the trading sessions Initial Balance:
Please see below an example of this....
IOTAUSDT signaled red (that it had dropped below all IBs) but then found support and moved on up.
Also a similar example as above for BTCUSDT....
If the signal is green do your technical analysis, but as shown below once the highest Initial Balance has been broken price can increase.
LINKLUSDT
I would like to say thanks to AnyDozer from StackOverFlow for helping me get my idea onto the charts and wugamlo for allowing me to use some of his panel code.

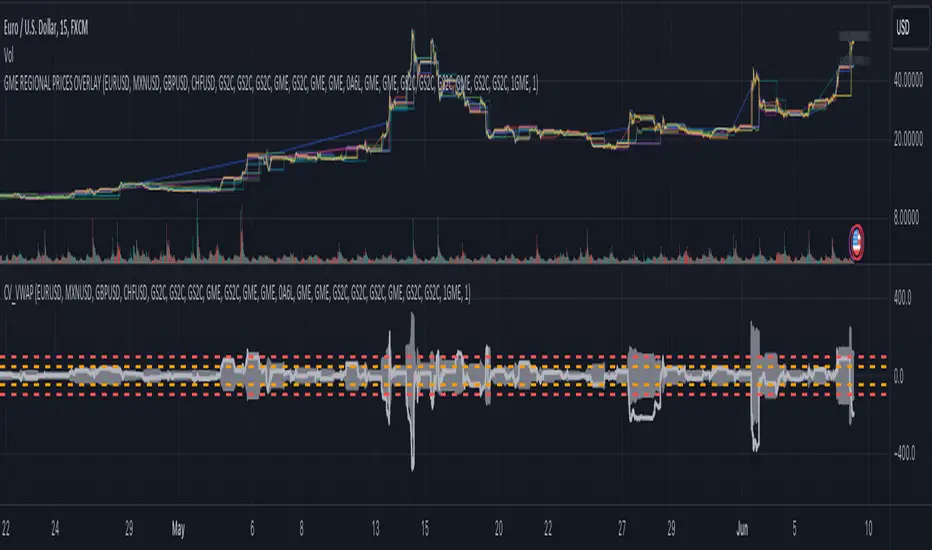
CV_VWAP_GMECoefficient of variance GME ‰
Gray area: Regional price variance of GME in per milles
Light gray thick line: NYSE:GME deviation from global mean
1. Select a chart 24-hour ticker like FX_IDC:USDEUR
2. Select a timescale (5 min, 15 min, ...)
3. Monitor the regional price variance
Exchanges included: NYSE, XETR, BMV, FWB, SWB, BITTREX, FTX
Currency conversion: Forex
Adapted from Detecting the great short squeeze on Volkswagen, Godfrey, K. (2016, February 18).
Vortex Range Breakout SystemThis is a Vortex Based Visual System,
Which can help you identify the Vortex Crosses based Range Breakouts/ Breakdown, over the price Scale,
How its made ?
The vortex Crosses are projected over the Price
on Same Time frame {Green and Red Filled area}
-> green Area means : Vortex Crossover Range
-> red Area means : Vortex Crossunder Range
and on Higher Timeframe
Vortex Cross Levels are Plotted, which you see as :
Blue and Orange Lines
Default Configs
Vortex Period is 14
Higher Timeframe Option is set to 60 mins
You can change the Higher timeframe to any minutes which suits your need
Also If you want to change the Higher Timeframe in Days
just know
1D = 24*60 min, = 1140mins
Enjoy!

[ALERTS] MA Cross HildiIch habe nur einige Modifikationen vorgenommen, so dass es meinen Bedürfnissen gerecht wird. Das Skript dient lediglich dazu die gleiche Einstellungen auf mehreren Konten nutzen zu können. Allein die Farbe und die Symbole habe ich noch nicht Automatisiert übertragen.
mfg Hildi Channel
