[astropark] MACD, RSI+, AO, DMI, ADX, OBV, ADI//******************************************************************************
// Copyright by astropark v4.1.0
// MACD, RSI+, Awesome Oscillator, DMI, ADX, OBV, ADI
// 24/10/2018 Added RSI with Center line to have clear glue of current trend
// 10/12/2018 Added MACD
// 13/12/2018 Added multiplier for MACD in order to make it clearly visible over RSI graph
// 11/01/2019 Added Awesome Ascillator (AO)
// 11/01/2019 Added Directional Movement Index (DMI) with ADX
// 14/01/2019 Added On Balance Volume (OBV)
// 14/01/2019 Added Accelerator Decelerator Indicator (ADI)
//******************************************************************************
Cari dalam skrip untuk "豪24配债"

[astropark] MACD, RSI+, Awesome Oscillator, DMI, ADX, OBV//******************************************************************************
// Copyright by astropark v4.0.0
// MACD, RSI+, Awesome Oscillator, DMI, ADX, OBV
// 24/10/2018 Added RSI with Center line to have clear glue of current trend
// 10/12/2018 Added MACD
// 13/12/2018 Added multiplier for MACD in order to make it clearly visible over RSI graph
// 11/01/2019 Added Awesome Oscillator (AO)
// 11/01/2019 Added Directional Movement Index (DMI) with ADX
// 14/01/2019 Added On Balance Volume (OBV)
//******************************************************************************

[astropark] MACD, RSI+, Awesome Oscillator, DMI with ADX//******************************************************************************
// Copyright by astropark v3.1.0
// MACD, RSI+, Awesome Oscillator, DMI, ADX
// 24/10/2018 Added RSI with Center line to have clear glue of current trend
// 10/12/2018 Added MACD
// 13/12/2018 Added multiplier for MACD in order to make it clearly visible over RSI graph
// 11/01/2019 Added Awesome Ascillator (AO)
// 11/01/2019 Added Directional Movement Index (DMI) with ADX
//******************************************************************************

[astropark] MACD, RSI+, Awesome Oscillator//******************************************************************************
// Copyright by astropark v3.0.0
// MACD, RSI+, Awesome Oscillator
// 24/10/2018 Added RSI with Center line to have clear glue of current trend
// 10/12/2018 Added MACD
// 13/12/2018 Added multiplier for MACD in order to make it clearly visible over RSI graph
// 11/01/2019 Added Awesome Ascillator (AO)
//******************************************************************************

EMA + Ichimoku Kinko Hyo StrategyThis trading strategy uses combination of the Ichimoku Kinko Hyo system with Fibonacci numbers based exponential moving average(EMA) and RSI 12/24 crossover, giving excellent results in trending stocks !

Creating long term bitcoin data
One of the problems, with bitcoin, is that we miss long term bitcoin data. There is not a single source from which to gather the value of bitcoin in any moment from it's inception. Or at least from when it was first exchanged into exchanges. If you look at coinmarketcap the data go back to the 28 apr 2013. But mtgox started in July 2010. If you go to yahoo, you will be able to gather data, but once you start working with this data you soon find out how poor is it. Basically it follows mtgox data while mtgox was alive, and then switched to some other exchange. But this means that we see a sudden jump in data which makes any indicator go wild. Basically it's really difficult to gather long term data on bitcoin. Also consider that mtgox did not just "go away" when it stopped trading. But in the database here it is still present with the fixed exchange rate of when it stopped.
So I tried to create the data we need. How? By taking three exchanges, and taking the median between them. The three exchanges I took were MTGOX: , BITFINEX: and KRAKEN: XBTUSD . We cannot avoid mtgox because it's the only source of data for the first years. But then as soon as the other exchanges come in we are going to use the median between them.
The indicator must be overlaid on another chart. And I use the forex usdeur which I then hide (If someone has a better idea, maybe something which is open 24/7, I would be happy to hear it).

[astropark] MACD & RSI+//******************************************************************************
// Copyright by astropark v2.0
// MACD RSI+
// 24/10/2018 Added RSI with Center line to have clear glue of current trend
// 10/12/2018 Added MACD
// 13/12/2018 Added multiplier for MACD in order to make it clearly visible over RSI graph
//******************************************************************************

[astropark] MACD & RSI+//******************************************************************************
// Copyright by astropark v2.0
// RSI+
// 24/10/2018 Added RSI with Center line to have clear glue of current trend
// 10/12/2018 Added MACD
//******************************************************************************

lsi (study about length and MTF) Here in this example I took lazy bear famous momentum squeeze indicator . the problem that there is lagging in the indicator so the buy and sell will be late . So instead the KC length that the original script had we put
int1=input(30)
int2=input(60)
lengthKC=isintraday and interval >= int1 ? int2/interval * 7 : isintraday and interval < 60 ? 60/interval * 24 * 7 : 7
this allow us to create a time and length related function to indicator and result in better output with no lagging
The second and most important thing is the ability to create indicator with time function as MTF without the security function that create repaint
all you need to do is to change int2 (to the time min of your choice ) and you can create an indicator with MTF function without the security function .And by this hopefully avoid the repainting issue
when you use this indicator change the setting of int1 and int 2 according to time frame that you use
lets say 15 min graph
make the int1 <15 min and the int2 at 15 min. if you want to see it as MTF just increase the int2 to the time set of your choice and play little with int1 to best setting

24HLRThis indicator is 24 hours Linear regression line . with upper SD and lower SD (can be manipulated )
The idea is that the coin will bounce up or down around the LR line (red) when you go lower frame of 4h up to1 hour charts then you can see more easy the direction of the coin , its potential low or potential high , where the LR lead the way .
In this example we look on btc at 4hours chart and see that its in a cross road either to hell or to escape (if break the line going down upward)
and here in 1D graph

Cumulative Force IndexVolume indicator adapted from Elder's Force Index.
From here:
stageanalysis.net

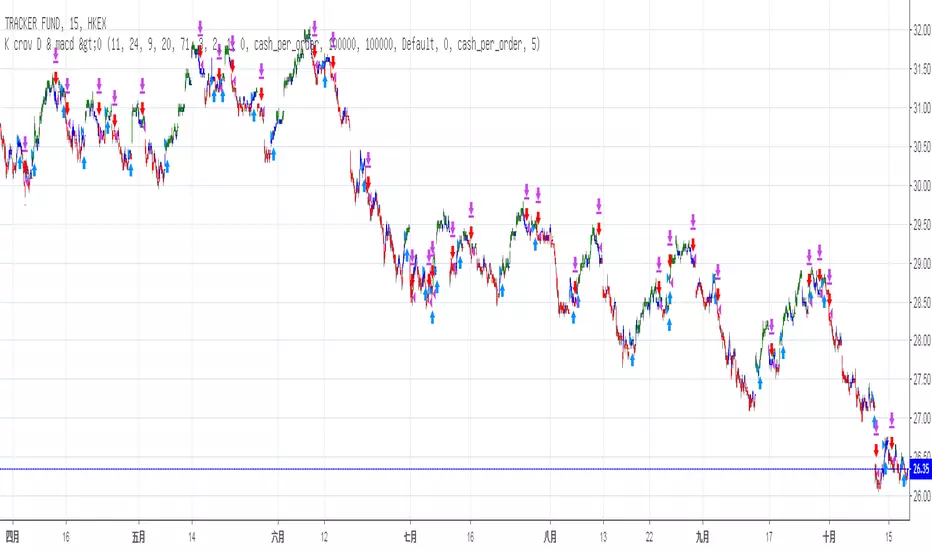
Stochastic & MACD Strategy Ver 1.0This strategy is inspired by ChartArt and jasonluk28.
The following input changes from the initial ChartArt version to achieve higher stability and profit:
Fast MA Len:11
Slow MA len: 24
Stoch Len: 20
No difference is found in minor changes (+-10) lv. of overbought/oversold
It works above 40% winning rate in Heng Heng Index, Shanghai Composite, Dow Jones Industrial Averge, S&P 500 NASDAQ, VT (World Total Market) and in 15 mins chart
Profit: above ~10 to 30% in less than 1year backtest for most major indice of China and US and ~62% in Heng Seng Index (Hong Kong) & 40.5% in SZSE Composite (Shen Zhen)
P.S. Profit: 700 (Tencent) +150.5%, 939 (CCB) +66.5%, 1299 (AIA) +45%, 2628 (CLIC) +41%, 1 (CK Hutchison) +31%
NFLX +82.5%, BABA +55.5%, AMZN +44%, GOOG +38%, MCD +24.5%
However, Loss in FB -19% , AMD -38.5%
Not suitable for stocks with great influences in News or Events ???
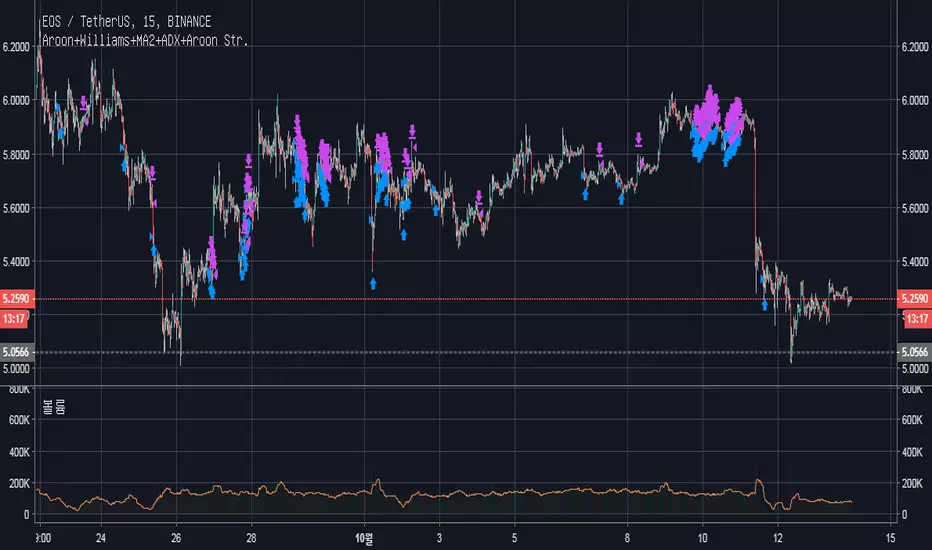
Aroon+Williams+MA2+ADX+Aroon Str.Inspired by the Watchbot strategy which makes about +60% profit in two months.
cafe.naver.com
This is customized to "EOSUSDT, 15 min, Binance" as a default.
I want to add the function for avoiding the recurrence of the trading for 24 ticks(period), but don't know how to yet.
Inverse Fisher RSI-MTF2 alertsThis is the study with allerts of the RSI-MTF2
if there is repainting then I suggest to go to lower time frame and graph of 1 hour or half hour then it will not repaint. the issue i think exist only in 24 hours time frame when you build it on shorter graph
still the results will be great (test it in strategy that i put before this one)
have fun

MA Study: Different Types and More [NeoButane]A study of moving averages that utilizes different tricks I've learned to optimize them. Included is Bollinger Bands, Guppy (GMMA) and Super Guppy.
The method used to make it MtF should be more precise and smoother than regular MtF methods that use the security function. For intraday timeframes, each number represents each hour, with 24 equal to 1 day. For daily, 3 is 3 day, for weekly, 4 is the 4 weekly, etc. If you're on a higher timeframe than the one selected, the length will not change.
Log-space is used to make calculations work on many cryptos. The rules for color changing Guppy is changed to make it not as choppy on MAs other than EMA. Note that length does not affect SWMA and VWAP and source does not affect VWAP.
A short summary of each moving average can be found here: medium.com
List of included MAs:
ALMA: Arnaud Legoux
Double EMA
EMA: Exponential
Hull MA
KAMA: Kaufman Adaptive
Linear Regression Curve
LSMA: Least Squares
SMA: Simple
SMMA/RMA: Smoothed/Running
SWMA: Symm. Weighted
TMA: Triangular
Triple EMA
VWMA: Volume Weighted
WMA: Weighted
ZLEMA: Zero Lag
VWAP: Vol Weighted Average
Welles Wilder MA

[NG] Indicator - Altcoin Alpha - v1(Created for Client)
Alpha (Unique price action of asset) indicator for ALTcoins implementation, taking `BINANCE:BTCUSDT` as the market reference. Can be improved by adding more BTC charts from more sources, so as to get a unified chart of BTC for market representation.
Set `alpha period` to a value, wherein you want to see the unique price action of the asset. For short term trend, a value of 24 is good for `1H` charts (1 day), and value of 168 is good for long term trends on `1H` charts (1 week trend).
Corresponding values of `beta period` should be `168` (1 week for 1 day alpha) and `720` (1 month for 1 week alpha period).
You can set `alpha` and `beta` period as per your requirements.
Regards,


RSI3graf. 3 RSI in one window[wozdux] Three RSI indicator charts in one window. Plus, the resale area (green) and overbought area ( red) are highlighted. Indicator settings are periods of calculation of the RSI indicator (24, 14, 9). The fourth parameter (30) is the critical levels, which are at a distance of 30 units from the edges. If the parameter is 30, then the oversold level is 30 and the overbought level is 70 (100-30).

[f(x)] Bollinger Donchian RemixThis is my version of a mixture of Bollinger and Donchian (BB/DC Remix)
It is a modified fork of Dolchian/Bollinger Hybrid by Ricardo Santos ( DBH.V0)
this is the two pictures comparing it.
Made this Fork because Santos' code starts getting chopping with my type of settings.
His time input is 24, but mine varies between 13 and 21.
You really notice in scalping and sometimes intraday timeframes with my settings.
His also differ from mine based on the trendline, where he modifies his Simple Moving Average, which is default color is black, and I use the the default one, which the default color is red.
Also you can change the trendline type input (open,close,hl2,etc...) to tailor your preference.
Note: Default is close, Santos use hl2, I use ohlc4.

RSI Oversold bounce - Scaling in levels (30, 28, 26, 24, 22, 20)Oversold bounce entry levels based on RSI
Helps to gauge levels for scaling into a position based on oversold rsi levels.

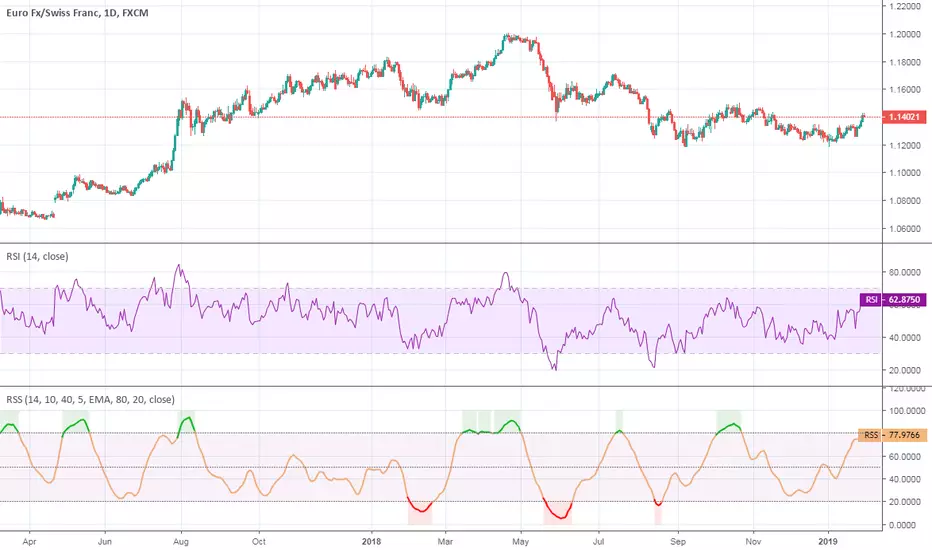
Relative Spread StrengthRelative Spread Strength indicator script. This indicator was originally developed by Ian Copsey (Stocks & Commodities V. 24:10 (16-23): Forex Focus).
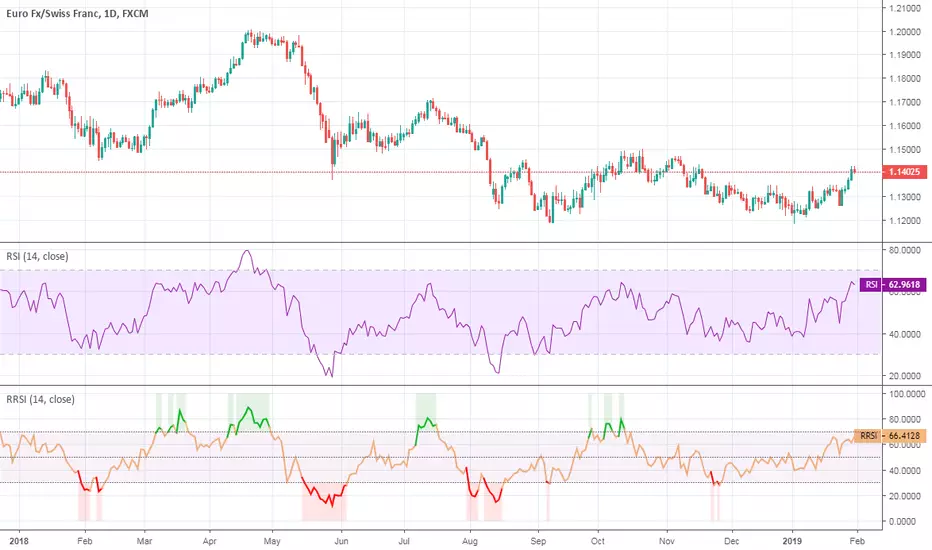
Rapid RSIRapid RSI indicator script. This indicator was originally developed by Ian Copsey (Stocks & Commodities V. 24:10 (16-23): Forex Focus).
TSP Ichimoku Clouds x2 MTFDouble Ichimoku
Use a Multiple of current time frame :
15m * 4 = 1h
1h*24 = 1d
