Trend Trader-Remastered StrategyOfficial Strategy for Trend Trader - Remastered
Indicator: Trend Trader-Remastered (TTR)
Overview:
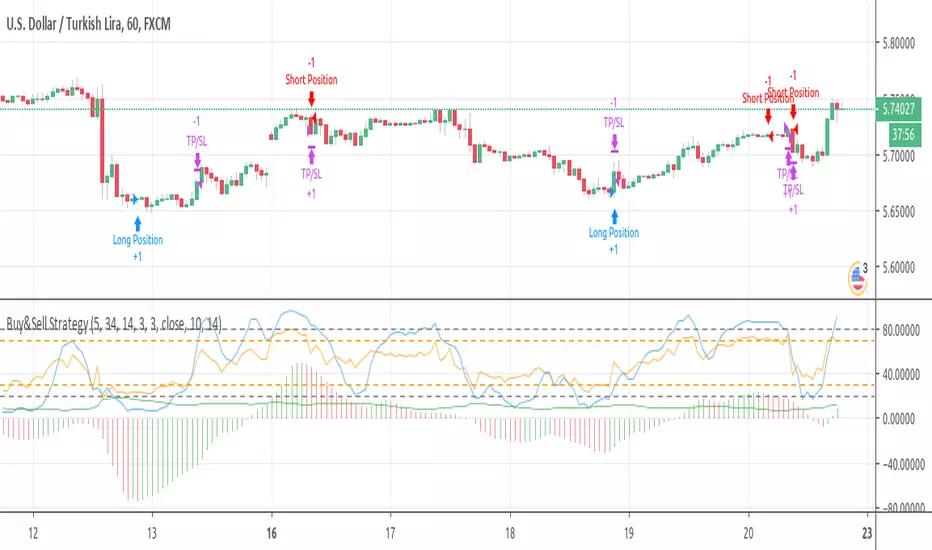
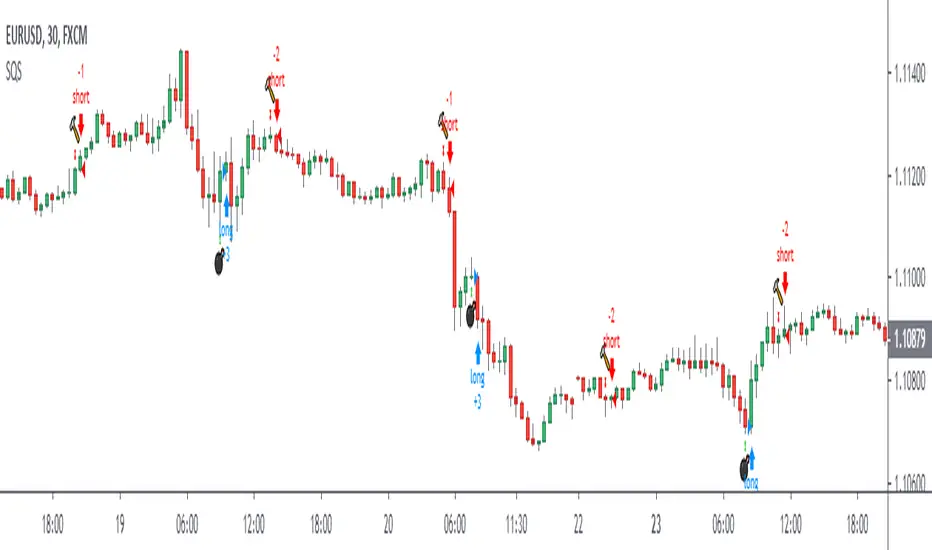
The Trend Trader-Remastered is a refined and highly sophisticated implementation of the Parabolic SAR designed to create strategic buy and sell entry signals, alongside precision take profit and re-entry signals based on marked Bill Williams (BW) fractals. Built with a deep emphasis on clarity and accuracy, this indicator ensures that only relevant and meaningful signals are generated, eliminating any unnecessary entries or exits.
Please check the indicator details and updates via the link above.
Important Disclosure:
My primary objective is to provide realistic strategies and a code base for the TradingView Community. Therefore, the default settings of the strategy version of the indicator have been set to reflect realistic world trading scenarios and best practices.
Key Features:
Strategy execution date&time range.
Take Profit Reduction Rate: The percentage of progressive reduction on active position size for take profit signals.
Example:
TP Reduce: 10%
Entry Position Size: 100
TP1: 100 - 10 = 90
TP2: 90 - 9 = 81
Re-Entry When Rate: The percentage of position size on initial entry of the signal to determine re-entry.
Example:
RE When: 50%
Entry Position Size: 100
Re-Entry Condition: Active Position Size < 50
Re-Entry Fill Rate: The percentage of position size on initial entry of the signal to be completed.
Example:
RE Fill: 75%
Entry Position Size: 100
Active Position Size: 50
Re-Entry Order Size: 25
Final Active Position Size:75
Important: Even RE When condition is met, the active position size required to drop below RE Fill rate to trigger re-entry order.
Key Points:
'Process Orders on Close' is enabled as Take Profit and Re-Entry signals must be executed on candle close.
'Calculate on Every Tick' is enabled as entry signals are required to be executed within candle time.
'Initial Capital' has been set to 10,000 USD.
'Default Quantity Type' has been set to 'Percent of Equity'.
'Default Quantity' has been set to 10% as the best practice of investing 10% of the assets.
'Currency' has been set to USD.
'Commission Type' has been set to 'Commission Percent'
'Commission Value' has been set to 0.05% to reflect the most realistic results with a common taker fee value.
Sellsignal

V Bottom & V Top Pattern [Misu]█ This indicator shows V bottom & V top patterns as well as potential V bottom & V top.
These V bottom & V top are chart powerful reversal patterns.
They appear in all markets and time-frames, but due to the nature of the aggressive moves that take place when a market reverses direction, it can be difficult to identify this pattern in real-time.
To address this problem, I added potential V pattern as well as the confirmed one.
█ Usages:
You can use V top & V bottoms for reversal zones.
You can use it for scalping strategies, as a main buy & sell signal.
Potential V patterns can be used to anticipate the market, in addition to volatility or momentum indicators, for example.
█ How it works?
This indicator uses pivot points to determine potential V patterns and confirm them.
Paramaters are available to filter breakouts of varying strengths.
Patterns also have a "max number bars" to be validated.
█ Why a Strategy type indicator?
Due to the many different parameters, this indicator is a strategy type.
This way you can overview the best settings depending on your pair & timeframe.
Parameters are available to filter.
█ Parameters:
Deviation: Parameter used to calculate parameters.
Depth: Parameter used to calculate parameters.
Confirmation Type: Type of signal used to confirme the pattern.
> Mid Pivot: pattern will confirm on mid pivot breakout.
> Opposit Pivot: pattern will confirm on opposit pivot breakout.
> No confirmation: no confirmation.
Lenght Avg Body: Lenght used to calculate the average body size.
First Breakout Factor: This factor multiplied by the "body avg" filters out the non-significant breakout of potential V pattern.
Confirmation Breakout Factor: This factor multiplied by the "body avg" filters out the non-significant breakout for the confirmation.
Max Bars Confirmation: The maximum number of bars needed to validate the pattern.

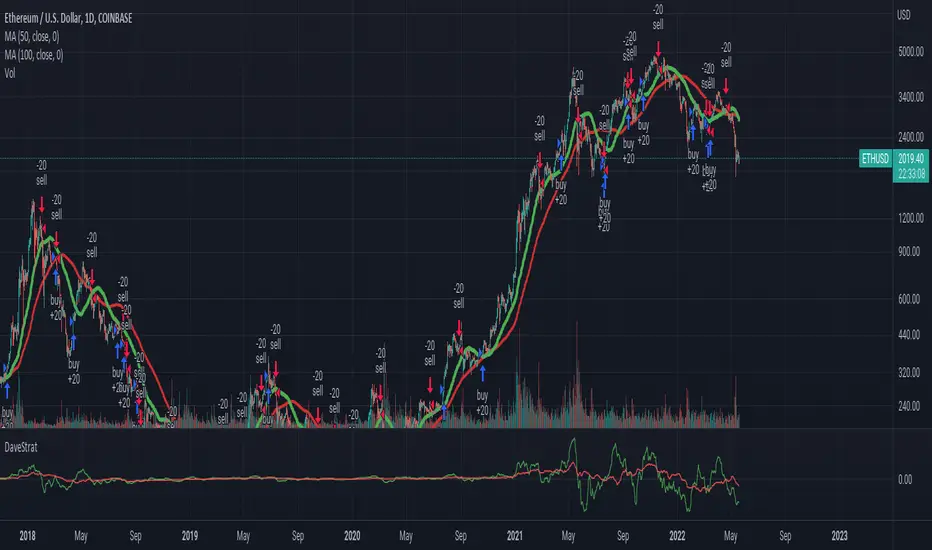
DaveStratThis script attempts to guess inflection points in cryptocurrency asset prices using change in two simple moving averages on the daily timescale.
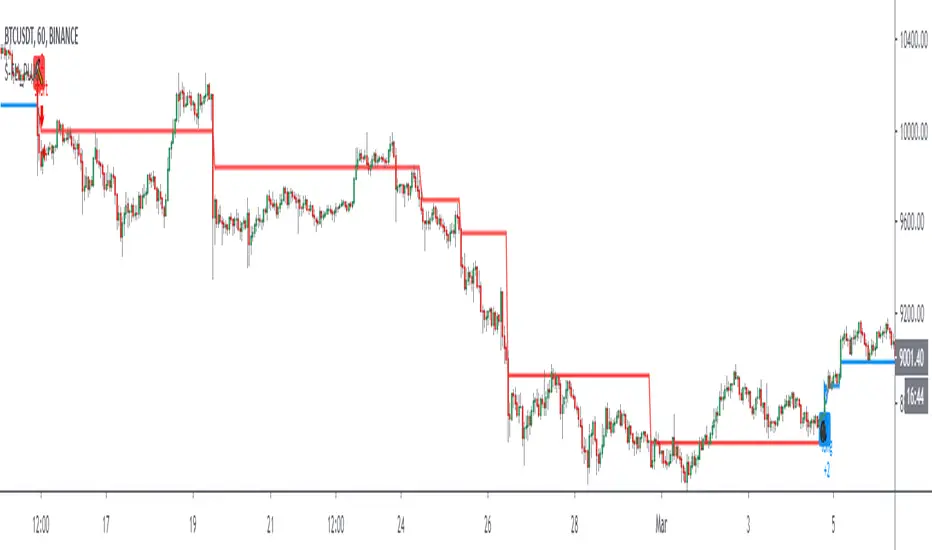
TradingGroundhog - Strategy & Fractal V1#-- Public Strategy - No Repaint - Fractals -- Short term
Here I come with another script, more simple than Wavetrend V1. You will love it.
#-- Synopsis --
Another simple idea, on a small time frame (15 min) we buy when the opening price goes below a Bottom fractals and sell when it goes over a Top fractals, but as this script do not use Wavetrends. You should stop by your self to use the script during long lasting downtrends.
I developed the strategy using BTC /EUR 3 MIN BINANCE but it can be applied to many other cryptos, I don't know for forex or others. You can use it for short term (to a month of uptrend) and automated trading.
#-- Graph reading --
And now, how to read it ?
Fractals:
Yellow Flags occur when the opening price goes below a Bottom fractal , it means Buy.
White Flags appear when the opening price goes over a Top fractal , it means Sell.
#-- Parameters --
*** Parameters have been intensively optimized using 10 cryptocurrency markets in order to have potent efficiency for each of them. I would recommend to only change the Can Be touch parameter. For the others, I don't recommend any modifications. The idea behind the script is to be able to switch between markets without having to optimize parameters, less work, easy to target active crypto and therefor limit the risks. ***
Can be touch :
'Filter fractals' : Activate or Disable the filtering fractal operation. If Enable, buy during less risky periods. (Activate is often better)
Can be touch but not necessary :
'VolumeMA' : The Volume corrector used by the fractals
'Extreme window' : The number of price individuals to look for if we want to remove extreme fractals.
Not to touch :
'Long Sop Loss (%)' : The minimal difference of price between a Fractal bottom and the opening price to buy.
#-- Time frame --
Should be used with the following time frames depending on the necessity:
1 MIN
3 MIN (Preferred with the parameters set)
5 MIN
#-- Last words --
The script can be set up to send Tradingview signals to 3comma just by adding comment = " " in strategy.close_all() and strategy.entry().
Good trades !
Disclaimer (As it should always be one to any script)
***
This script is intended for and only to be used for personal purposes only. No such information provided by it constitutes advice or a recommendation for any investment or trading strategy for any specific person. There is no guarantee presented or implied as to the accuracy of specific forecasts, projections, or predictive statements offered by the script. Users of the script agree that its original developer does not take responsibility for any of your investment decisions. Please seek professional advice before trading.
***
# Here are the results from the 20rst of September 2021 with 100% of equity on the BTC /EUR 3 Min and with a capital of 10 000 EUR. So almost, one month.
# As I saw, it goes from +30% to more than +160% (the great SHIB) depending on the selected crypto. It may be negative if you spot a downtrend.

Williams Fractals StrategyThis indicator made with using Williams Fractals, 20 50 100 Moving Averages and Relative Strength Index. You can easily find entry points by using Long (L), Short (S) signals.
Note : Settings are optimized for BTC:USDT Perpetual 15min TF. For use different pairs or TFs you may need to change settings.

Simple way to BEAT the market [STRATEGY]This script has been created to demonstrate the effectiveness of using market regime filters in your trading strategy, and how they can improve your returns and lower your drawdowns
This strategy adds a simple filter (A historical volatility percentile filter, an implementation of which can be found on my trading profile) to a traditional buy and hold strategy of the index SPY.
Note, There are other filters that could also be added including a long-term moving average/percentile rank filter/ADX filter etc, to improve the returns further.
The filter closes our long position during periods of volatility that exceed the 95th percentile (or in the top 5% of volatile days) and buys back when the volatility is below 95% rank of the past 100 days
Have included the backtest results since 1993 which is 28 years of data at the time of writing. Comparison of traditional buy and hold with this modified strategy can be found below:
Traditional buy and hold:
Return per year: 7.95 % (ex Dividends)
Total return: 851.1 %
Max drawdown: 50.79 %
'Modified' buy and hold (this script):
Return per year: 9.92 % (ex Dividends)
Total return: 1412.2 %
Max drawdown: 31.57 %
Feel free to use some of the market filters in my trading profile to improve and refine your strategies further, or make a copy and play around with the code yourself. This is just a simple example for demo purposes.

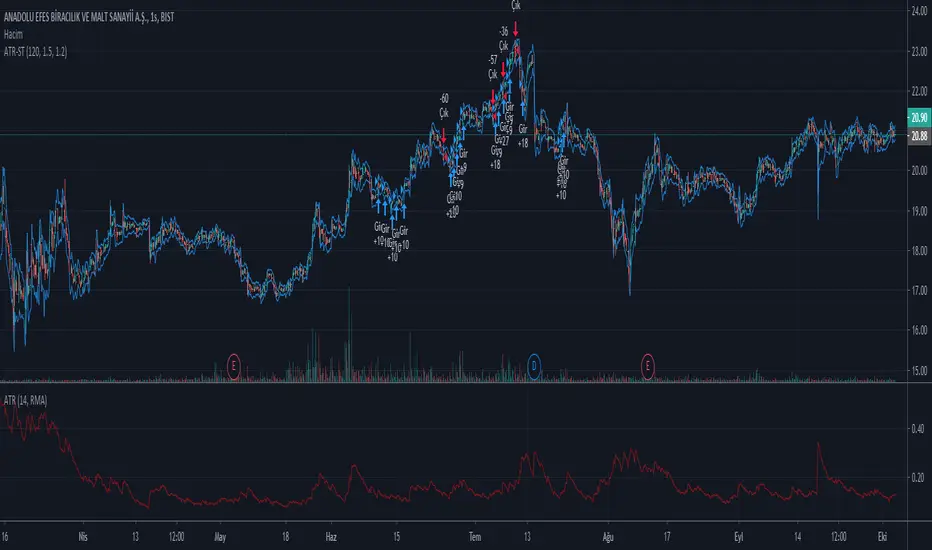
ATR Stop Buy StrategyThis strategy trial is let you to giving sell and buy orders with ATR (average true range) and an coefficent for them. it is my first strategy work, needs to be upgraded. USE IT WITH YOUR OWN RISK. IT IS NOT EVEN GUARANTEED TO WORK.
Strategy Follow Line MTF Any MM AverageThe objective is only to evaluate different configurations of the indicator "Follow Line MTF Any MM Average".
The strategy does not have position management, it's very basic, this indicator should be used to see trend, range zones, evaluate the best areas to enter the market, use higher time frames to confirm a direction can be useful.
I do not recommend using only this indicator to trade, because you can lose all your money if you do not know what you are doing.
I hope you find it useful.
Successes
Strategy Follow Line Indicator The objective is only to evaluate different configurations, I do not recommend using only this indicator to trade, because you can lose all your money if you do not know what you are doing.
I hope you find it useful.
Successes

Strategy PyramiCoverStrategy for pyramidization and coverage. (Indicator PyramiCover)
Recommended time frame 60 min.

Strategy Quadratic Semaphore I add a basic strategy for the "Quadratic traffic light" indicator, it can help to find a good configuration.
Regards.
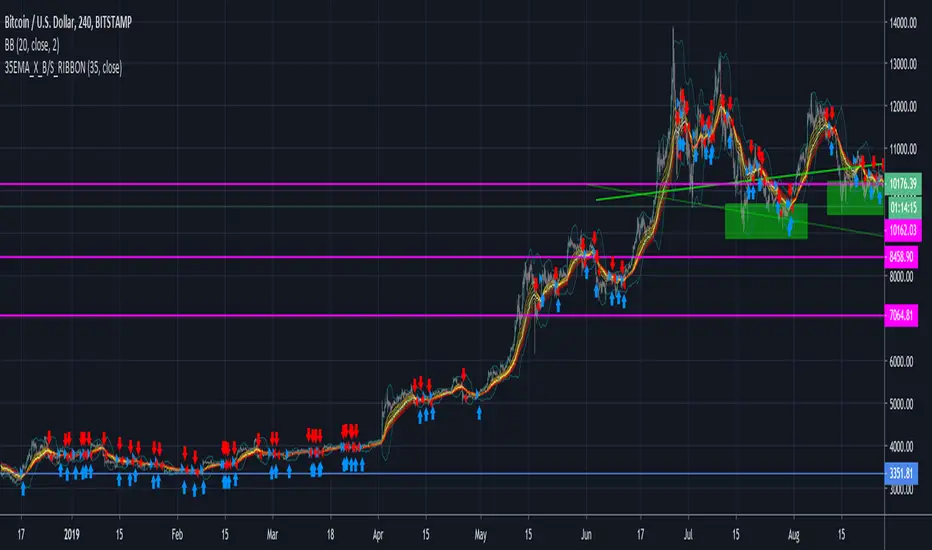
35EMA Cross BuyAndSell Strategy + RIBBON [d3nv3r]This strategy allow the user to move the EMA which control the Buy&Sell Strategy and show the EMA ribbon that can be found in the Template area.
Buy showing the ribbon and letting the user to adjust the EMA signaling the B&S strat the user can create an elaborated strategy for buyPoint and sellPoint.
The 35EMA Cross is choosen by default but I recommend to move it to find best Sell point and best Buy point as you would not react on the same EMA for a Buy signal and a Sell Signal..
It would be good to have buy signal on a EMA and the sell signal on another but that's for another Strategy to be shared.
Let me know by commenting what you would like for the next one !
150MA Cross BuyAndSell Strategy [d3nv3r]This is a Buy And Sell Strategy I haven't seen anywhere so i share mine.
Used on Bitcoin - daily chart - the strategy generate sell and buy indicator on crossover and crossunder the 150 simple moving average.

Histogram Trends Strategy by SedkurThis gives to you buy-sell signal with MACD's histogram trends.
Use "Fast and Slow length" and "Trend of Histogram Number" inputs to take less or more signal.
"Trend of Histogram Number" : This means how many histogram bars the trend continues before trading.

MACD Strategy by SedkurThis gives to you buy-sell signal with MACD histogram value.
Use "Fast and Slow length" and "Buy or Sell Histogram Value" inputs to take less or more signal.

Buy&Sell Strategy depends on AO+Stoch+RSI+ATR by SerdarYILMAZThis strategy is just for training, its purpose is just learning code in pine script.
Don't make buy or sell decision with this strategy.
Turkish/Turkce
Bu strateji sadece pine script'te kodlamanın nasıl yapildigini ogrenmek icindir.
Bu stratejiye dayanarak, kesinlikle al-sat islemleri yapmayin.
How it works?
When RSI and Stoch are in oversold area and if awesome osc. turns positive, take long position. Stop loss and take profit levels were defined with ATR ind.
When RSI and Stoch are in overbought are and if awesome osc. turns negative, take short position. Stop loss and take profit levels were defined with ATR ind.
Turkish/Turkce
RSI ve Stoch asiri satım bölgesinde iken awesome pozitife döner ise long pozisyon açar, zarar kes ve kar al seviyeleri ATR indikatoru ile tanımlandı.
RSI ve Stoch asırı alım bölgesinde iken awesome negatife döner ise short pozisyon açar, zarar kes ve kar al seviyeleri ATR indikatoru ile tanımlandı.