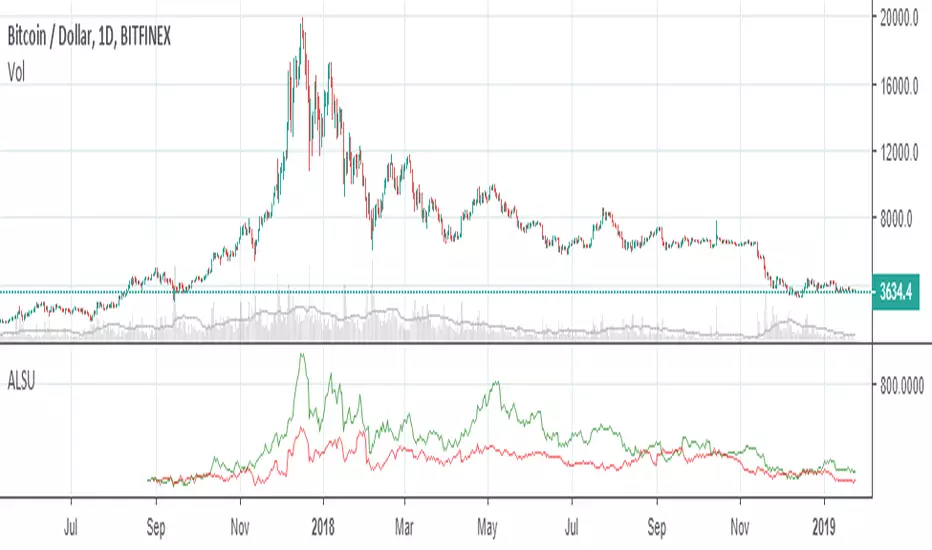
All Longs Shorts USDSummary longs, shorts of cryptos ( BTC ETH EOS XRP LTC XMR) in millions USD on Bitfinex.
Shorts
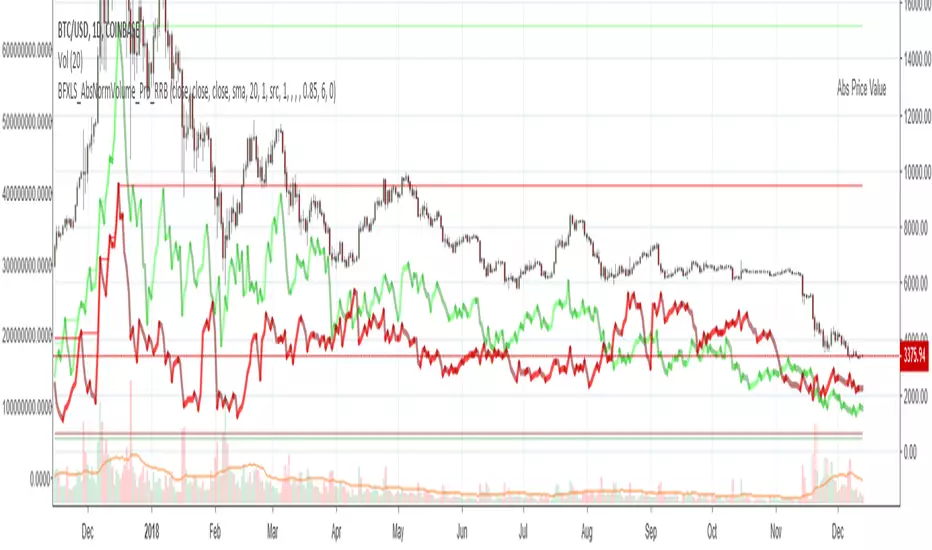
Chiki-Poki BFXLS Longs Shorts Abs Normalized Volume Pro by RRBChiki-Poki BFXLS Longs vs Shorts Absolute Normalized Volume Value Pro by RagingRocketBull 2018
Version 1.0
This indicator displays Longs vs Shorts in a side by side graph, shows volume's absolute price value and normalized volume of Longs/Shorts for the current asset. This allows for more accurate L/S comparisons (like a log scale for volume) since volume on spot exchanges (Bitstamp, Bitfinex, Coinbase etc) is measured in coins traded, not USD traded. Similarly, L/S is usually the amount of coins in open L/S positions, not their total USD value. On Bitmex and other futures exchanges volume is measured in USD traded, so you don't need to apply the Volume Absolute Price Value checkbox to compare L/S. You should always check first whether your source is measured in coins or USD.
Chiki-Poki BFXLS primarily uses *SHORTS/LONGS feeds from Bitfinex for the current crypto asset, but you can specify custom L/S source tickers instead.
This 2-in-1 works both in the Main Chart and in the indicator pane below. You can switch between Main/Sub Window panes using RMB on the indicator's name and selecting Move To/Pane Above/Below.
This indicator doesn't use volume of the current asset. It uses L/S ticker's OHLC as a source for SHORTS/LONGS volumes instead. Essentially L/S => L/S Volume == L/S
Features:
- Display Longs vs Shorts side by side graph for the current crypto asset, i.e. for BTCUSD - BTCUSDLONGS/BTCUSDSHORTS, for ETHUSD - ETHUSDLONGS/ETHUSDSHORTS etc.
- Use custom OHLC ticker sources for Longs/Shorts from different exchanges/crypto assets with/without exchange prefix.
- Plot Longs/Shorts as lines or candles
- Show/Hide L/S, Diff, MAs, ATH/ATL
- Use Longs/Shorts Volume Absolute Price Value (Price * L/S Volume) instead of Coins Traded in open L/S positions to compare total L/S value/capitalization
- Normalize L/S Volume using Price / Price MA / L/S Volume MA
- Supports any existing type of MA: SMA, EMA, WMA, HMA etc
- Volume Absolute Price Value / Normalize also works on candles
- Oscillator mode with negative axis (works in both Main Chart/Subwindow panes).
- Highlight L/S Volume spikes above L/S MAs in both lines/oscillator.
- Change L/S MA color based on a number of last rising/falling L/S bars, colorize candles
- Display L/S volume as 1000s, mlns, or blns using alpha multiplier
1. based on BFXLS Longs vs Shorts and Compare Style, uses plot*, security and custom hma functions
2. swma has a fixed length = 4, alma and linreg have additional offset and smoothing params
Notes:
- Make sure that Left Price Scale shows up with Auto Fit Data enabled. You can reattach indicator to a different scale in Style.
- It is not recommended to switch modes multiple times due to TradingView's scale reattachment bugs. You should switch between Main Chart and Sub Window only once.
- When the USD price of an asset is lower you can trade more coins but capitalization value won't be as significant as when there are less coins for a higher price. Same goes for Shorts/Longs.
Current ATH in shorts doesn't trigger a squeeze because its total value is now far less than before and we are in a bear market where it's normal to have a higher number of shorts.
- You should always subtract Hedged L/S from L/S because hedged positions are temporary - used to preserve the value of the main position in the opposite direction and should be disregarded as such.
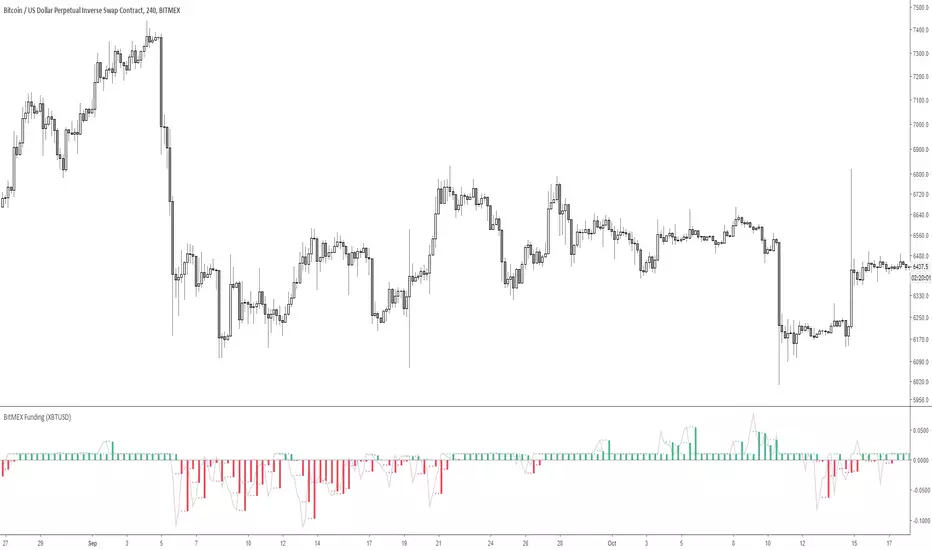
- Low margin rates increase the probability of a move in an underlying direction because it is cheaper. High margin rates => the market is anticipating a move in this direction, thus a more expensive rate. Sudden 5-10x rate raises imply a possible reversal soon. high - 0.1%, avg - 0.01-0.02%, low - 0.001-0.005%
You can also check out:
- BFXLS Longs/Shorts on BFXData
- Bitfinex L/S margin rates and Hedged L/S on datamish
- Bitmex L/S on Coinfarm.online
Bitfinex Longs/Shorts Ratio AlertableThis script contains Bitfinex longs/short ratio and generates alarms with a given input .default value is 60 which means alerts when either shorts/longs reach 60:40 ratio

speed_long_short[WOZDUX]Indicator of the position growth rate in long and short. Schedule of positions long and short is taken from the stock exchange Bitfinex. The total number of long and short positions shows the total activity of traders and indirectly the total volume of transactions. On the chart of the indicator it is a blue line.
Since we do not study the absolute values of volumes, but the growth rate of volumes, the blue line shows the overall growth rate of all transactions. The red line shows the rate of growth of transactions in the short. The green line shows the rate of growth of transactions in the long.
The rate of growth of the absolute value of long positions is the green line. The rate of increase in the percentage of positions in the long light green.Thus, the relative growth of long positions (light green line) actually shows the Delta of the volume, since this is the ratio of the number of long positions to the total number of transactions .
By default, the pair btc usd is used. However, you can change this pair in the indicator settings.
============================
Индикатор скорости прироста позиций в лонг и шорт. График позиций лонг и шорт берется с биржи Bitfinex. Суммарное количество позиций лонг и шорт показывает общую активность трейдеров и косвенно общий объем сделок. На графике индикатора это синяя линия.
Поскольку мы исследуем не абсолютные значения объемов, а скорость прироста объемов, то синяя линия показывает общую скорость прироста всех сделок. Красная линия показывает скорость прироста сделок в шорт. Зеленая линия показывает скорость прироста сделок в лонг.
Скорость прироста абсолютного значения лонг позиций - зеленая линия. Скорость прироста процентной доли позиций в лонг светлозеленая.Таким образом, относительный прирост позиций лонг ( светлозеленая линия) фактически показывает дельту объема, поскольку это отношение количества позиций лонг к общему количеству сделок .
По умолчанию, используется пара btcusd. Однако в настройках индикатора можно изменить эту пару.

Volume + Margin Toolkit (Longs & Shorts)-predicts volume on current bar based on how long is left in the bar
-shows how much volume is spent on margin positions
-shows how much buy & sell volume on margin positions
-shows volume in fiat value
-normalized view shows percent of volume spent on margin
-sma
-enter the security name for shorts & longs data, by default it is set to BITFINEX:BTCUSDLONGS and BTCUSDSHORTS.

LONGS + SHORTS Bitfinex BTCUSDI put together two indicators of 'autemox'. the lines follow the graphs of LONGS and SHOTS

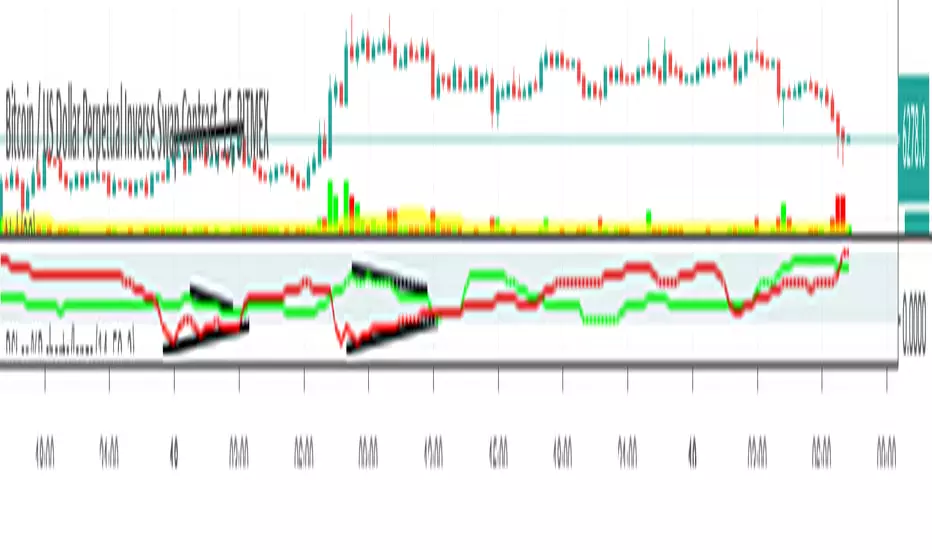
Bitfinex BTC margin position differencesIf green is over the red it means that longs are currently dominant on BitFinex for BTC.
Same goes if red is over green just that shorts are dominant.
If the green is over red the green will show how many more longs there are than shorts and if you hover over the red you will see how many more shorts there are compared to longs
Vice versa if red is over green .
You can change to a histogram, area, line or any other style of chart in the settings of the indicator
The black dashed line in the middle is 0 aka if u see the indicator go there it means there are an equal amount of longs and shorts

RSI or %B of Bitfinex shorts /longs of main crypto trading pairsNormalized longs and shorts with %B or RSI of some crypto trading pairs listed below (longs and shorts data from Bitfinex). If you're not familiar with %B just use default setting and it will plot a RSI of the longs and shorts (screenshot is from %B). Obviously this should not be used as a single reason to take a trade but part of your analysis.
For some longs/shorts sentiment interpretation you can look at this:
cdn.discordapp.com
Available pairs (you can add some with very basic Pine Script knowledge but it will take more time loading):
BTCUSD
ETHUSD
ETHBTC
EOSBTC
LTCBTC
XRPBTC
BCHBTC
TRXBTC


BTC longs n' shortsA indicator that neatly shows you BitFinex margin longs and shorts that can be put on any chart!

Dumb Indicator 9 - Bitfinex Shorts X LongsThis is a way to study how the crypto market is going on Bitfinex, you can see the diference between the Long and Short terms on most popular pairs.

Bitcoin Shorts and LongsThis indicator shows the volume of shorts and longs for margin trading in Bitfinex.

BTC-USD: LONGS, SHORTS & RATIO (Bitfinex)This script allows you
1. to plot the outstanding BTC long (green) and/or short (red) positions
2. to plot an area (blue) corresponding to the ratio between the outstanding long and short positions, shifted and rescaled, such that the zero-line corresponds to the mid-point between the long and short positions: ratio => ratio * mid + mid

ETHUSD FINEX OPEN POSsame as another public btcusd open pos indicator, changing data to use finex open positions for ethusd

Bitfinex BTCUSD margin longs vs shortsNon overlay indicator for BTCUSDLONGS and BTCUSDSHORTS + delta

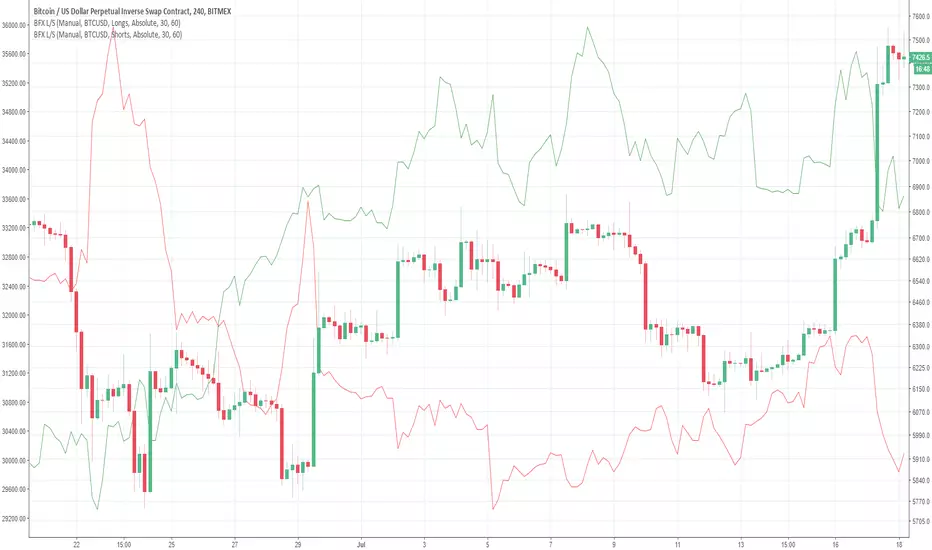
BTCUSD Bitfinex Longs vs ShortsBitfinex BTC -0.82% longs versus shorts margin trading positions
Displays total longs, total shorts, and net
Option to normalize data between to -100% and 100%
Option to adjust smoothing factor
Option to adjust upper and lower threshold when normalized

Universal Longs Vs. Shorts - Ratio (Any Symbol)Hello again all my Trading View friends!
This script is a variation of my other script "Universal Longs Vs. Shorts - Percentage (Any Symbol)"
It allows you to choose ANY symbol and plot the ratio against ANY other symbol, as an indicator on your given pair. It is primarily used as an indicator of longs/shorts as well as shorts/longs as a ratio to each other.
For example, you could plot BITFINEX:BTCUSDLONGS against BITFINEX:BTCUSDSHORTS.
It plots the ratio of longs/shorts or shorts/longs. For example:
If there are more longs than shorts open, the long ratio will be great than 1 with no upper limit.
If there are less longs than shorts open, the ratio will be less than 1 but greater than 0.
The same is true when comparing shorts to longs. You can choose to view Longs Ratio only, Shorts Ratio only, or Both.
This is useful to see how many more longs there are than shorts, and visa versa, at any given time interval. It does not take into consideration total volume of longs + shorts to get an absolute number, but rather a relative ratio to each other.
If there are many more positions open in one direction over the other, the ratio will rise higher and higher away from 1, which lets you know generally that there is a lot greater volume of that position open compared to its reverse.
If you found this script helpful please remember to FOLLOW and press LIKE!!
More useful scripts to come :-D
