Multi-Sigma Bands [fmb]Multi-Sigma Bands plots standard deviation (sigma) bands around a selectable basis (SMA, EMA, RMA, or Linear Regression). It’s designed to help you spot when price is behaving “normally” versus when it’s stretching into statistically extended territory.
What it shows
- Basis: the central reference line (your chosen basis type)
- ±1σ zone: the common range where price spends much of its time
- ±2σ zone: extended range where moves often become more emotional or trend-driven
- ±3σ zone: extreme range where price is statistically stretched (risk increases)
How to read it
- Inside ±1σ
- Often normal behaviour and mean-reverting price action around the basis.
- Between ±1σ and ±2σ
- A meaningful extension. In trends, price can “walk” these areas for longer than expected.
- Between ±2σ and ±3σ
- Rare extension. Can signal exhaustion, blow-off behaviour, or capitulation depending on direction and context.
How traders typically use it
- Trend context
- In strong uptrends, price may ride the upper bands (+1σ to +2σ) repeatedly.
- In strong downtrends, the lower bands (-1σ to -2σ) can act the same way.
- Bands show statistical stretch, not automatic reversal signals.
- Extension and risk framing
- The farther price is from the basis, the more “stretched” it is.
- That usually means chasing becomes riskier and entries require tighter confirmation.
- Range behaviour
- Ranges often oscillate around the basis, with frequent returns toward the middle zone.
Settings
- Source: what price series to use (Close by default)
- Length: lookback used for both basis and standard deviation
- Basis: SMA, EMA, RMA, or LinReg
- Stdev smoothing: optional smoothing on standard deviation for cleaner bands
- σ multipliers: customise σ1, σ2, σ3 (defaults: 1, 2, 3)
- Force Monthly Data (optional): calculate bands using a higher-timeframe source to reduce noise and focus on macro structure
Disclaimer
This indicator is for informational and educational purposes only and is not financial advice. Always use risk management and confirm with market structure and trend context.
Sigma

Outliers Detector with N-Sigma Confidence Intervals (TG fork)Display outliers in either value change, volume or volume change that significantly deviate from the past.
This uses the standard deviation calculation and the n-sigmas statistical rule of significance, with 2-sigma (a value of 2) signifying that the observed value is stronger than 95% of past values, and 3-sigma 98.5% of past values, and so on for higher sigma values.
Outliers in price action or in volume can indicate a strong support for the move, and hence potentially more moves in the same direction in the future. Inversely, an insignificant move is less likely to be supported. And of course the stronger, the more support.
This indicator also doubles as a standard volume indicator if volume is selected as the source, but with the option of highlighting outliers.
Bars below significance can be uncolored (gray) to unclutter the visuals.
Differently to almost all other similar indicators, the background highlighting is dynamical, so that all values will be highlighted differently, not just 2-sigma or 3-sigma, but also 4-sigma, 5-sigma, etc, with a different value of transparency.
The dynamical transparency value can be calculated in two ways: either statically proportionally to the n-sigma but capped at 10-sigma, or either as a ratio relative to the highest observed sigma value over the defined lookback period (default: 300).
If you like this indicator, which is an extension of previously published indicators, please give some love to the original authors:
* tvjvzl :
* vnhilton :
This extension, authored by Tartigradia, extends tvjvzl's indi, implements vnhilton's idea of highlighting the background, and go further by adding dynamical background highlighting for any value of sigma, add support for volume and volume change (VolumeDiff) as inputs, add option to uncolor insignificant bars, allow plotting in both directions and more.

Outlier Detector with N-Sigma Confidence IntervalsA detrended series that oscilates around zero is obtained after first differencing a time series (i.e. subtracting the closing price for a candle from the one immediately before, for example). Hypothetically, assuming that every detrended closing price is independent of each other (what might not be true!), these values will follow a normal distribution with mean zero and unknown variance sigma squared (assuming equal variance, what is also probably not true as volatility changes over time for different pairs). After studentizing, they follow a Student's t-distribution, but as the sample size increases (back periods > 30, at least), they follow a standard normal distribution.
This script was developed for personal use and the idea is spotting candles that are at least 99% bigger than average (using N = 3) as they will cross the upper and lower confidence interval limits. N = 2 would roughly provide a 95% confidence interval.

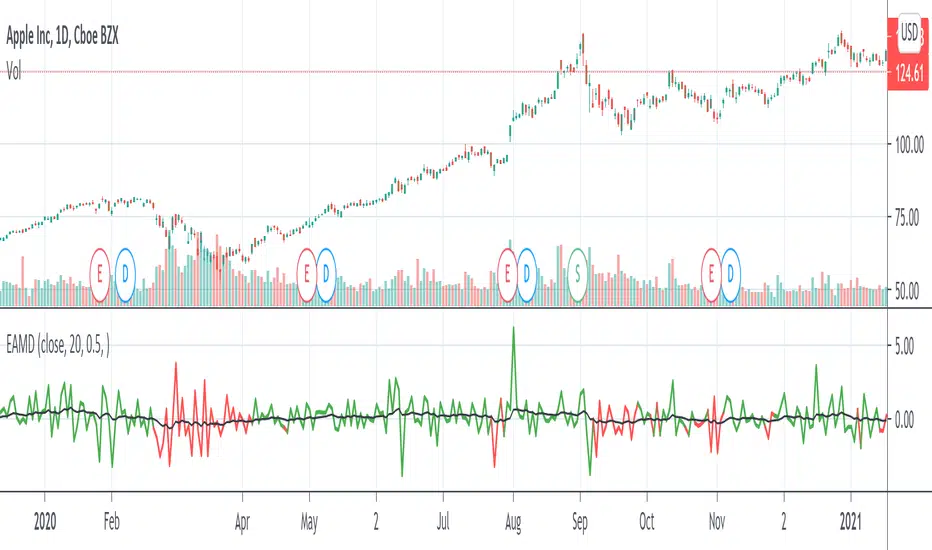
Sigma Spikes [CC]Sigma Spikes were created by Adam Grimes and this is one of the best volatility indicators out there. This indicator not only gives you positive or negative volatility but with my version I can identify any sudden changes from the underlying trend. Buy when the line turns green and sell when it turns red.
Let me know if there were any other indicators you wanted to see me publish!
Indices Sector SigmaSpikes█ OVERVIEW
“The benchmark Dow Jones Industrial Average is off nearly 300 points as of midday today...”
“So what? Is that a lot or a little? Should we care?”
-Adam H Grimes-
This screener aims to provide Bird-Eye view across sector indices, to find which sector is having significant or 'out-of-norm' move in either direction.
The significance of the move is measured based on Sigma Spikes, a method proposed by Adam H. Grimes, where Standard Deviation of returns used as a baseline.
*You can google his blog or read his book, got some gold in there, especially on how he use indicators for trading
█ Understanding Sigma Spikes
As described by Grimes, moves in markets are only meaningful when we consider what “normal” is for that market.
Without that baseline, the daily change number, and even the percent change on the day doesn’t really mean much.
To overcome that problem, Sigma Spikes, as a measure of volatility, attempt to put todays change in price (aka return) in context of the standard deviation of 20 days daily's return.
Refer chart below:
1. The blue bars refer to each days return
2. The orange line is 1 time standard deviation of past 20days daily's return (today not included)
3. The red line is 2 time standard deviation of past 20days daily's return (today not included)
Using the ratio of today's return over the Std Deviation, determining your threshold (1,2,3,etc) will be the key that tells if today's move is significant or not.
*Threshold referring to times standard deviation, and different market may require different threshold.
*20 Days period are based on the Lookback Period, adjustable from user input window.
█ Features
- Scan up to 13 symbols at a time (Bursa (MYX) indices are defaulted, but you may change to any symbols/index from the user input setting)
█ Limitation
- Due to multiple use of security() function required to call other symbols, expect the screener to be slow at certain times
- Custom Timeframe currently accept only Daily and Weekly. I'll try to include lower timeframe in the next update
█ Disclaimer
Past performance is not an indicator of future results.
My opinions and research are my own and do not constitute financial advice in any way whatsoever.
Nothing published by me constitutes an investment recommendation, nor should any data or Content published by me be relied upon for any investment/trading activities.
I strongly recommends that you perform your own independent research and/or speak with a qualified investment professional before making any financial decisions.
Any ideas to further improve this indicator are welcome :)

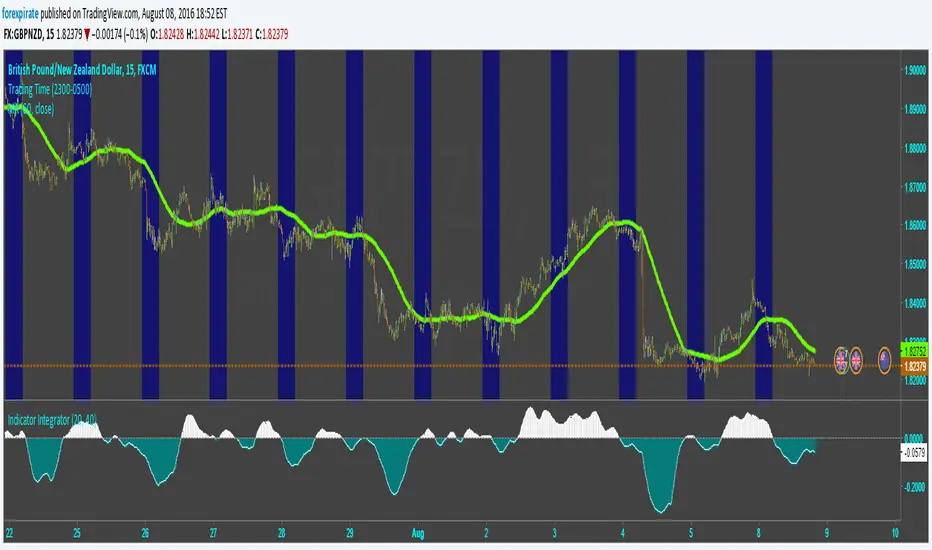
Indicator IntegratorHere is a light piece of code, The Indicator Integrator. It sums up a function (like an integral for you calculus folks). Unlike the 'cum' function that does a million bars of look back you can change the look back period, like limits of integration.
Built in is a difference of the close from an SMA. And there is an ROC. By changing what is summed up in the loop you can sum up the differences from the SMA or sum up the ROC. Pick your SMA length/ROC length. Then pick your look back period of how much to add up (bars to add up). There is a built in SMA smoother of three bars on the final summation.
Comments welcomed
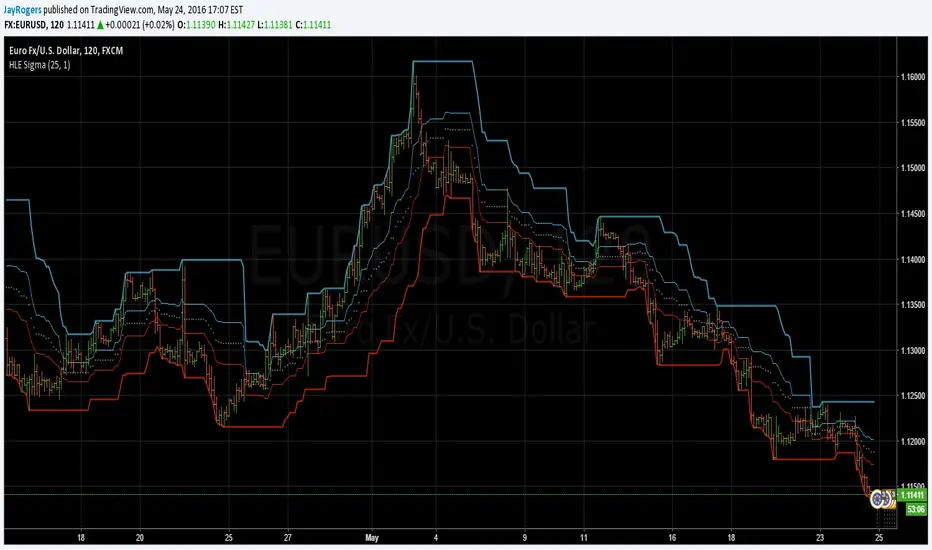
High Low Envelope SigmaDescription:
High and Low Envelope channel with median line and 'sigma' offsets to try and encapsulate price flow and quickly locate likely areas of support and resistance on the fly.