Multiple Alerts by MortyMultiple Alerts by Morty
Version 1.0, Updated at 20210322
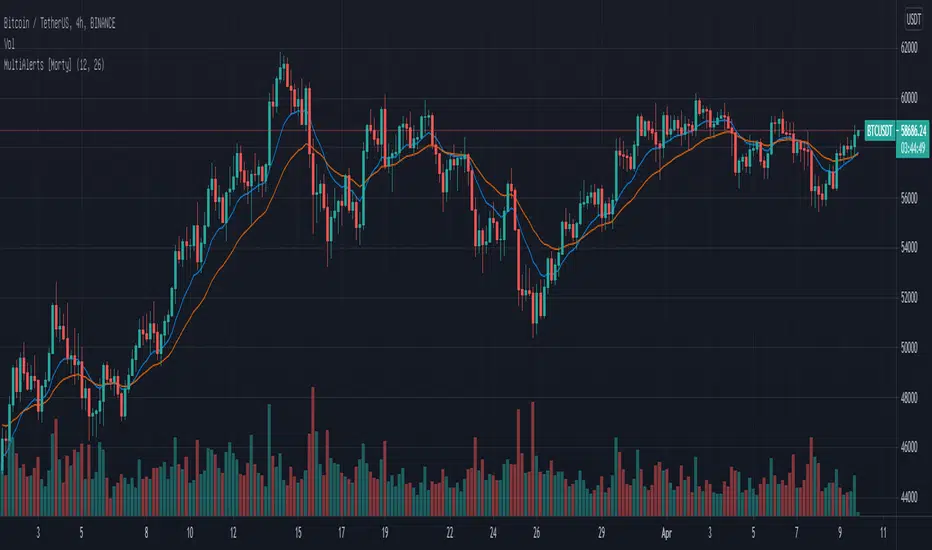
When the following signals meet the conditions, alerts will be triggered.
close price cross SMA
SMA_fast cross SMA_slow
MACD cross signal
RSI overbought and oversold
close price cross Bollinger Bands
Momentum cross 0 level
This script will also plot two MAs, EMA default ( SMA optional ).
Sma
MA Perfect Order DashboardJapanese below / 日本語説明は下記
Hello traders,
This indicator, Moving Average Perfect Order Dashboard, is to literally show moving average perfect order status of 4 selected USD crosses; EURUSD, USDJPY, GBPUSD and AUDUSD on main chart as text.
One of the KSFs in markets is to follow trend.
Moving average(MA) perfect order(PO) is one of the sings that markets signal when trends are occurring.
See more info on perfect order in my previously published script below.
3MA with Perfect Order Alert
To identify perfect order across multiple currency pairs, I have developed the dashboard where you can see perfect order status from 3 timeframes; Daily, 4 hour and 1 hour.
Due to the limited number of usages of security function in Pine script, I have selected 4 USD cross currency pairs as mentioned above as these are most traded currency pairs according to several sources that I have checked.
Functions:
-To show 3 moving average with selection of SMA/EMA.(MAs can be hidden)
-PO status is identified based on 3 MA period set on parameters.
Bullish PO is when short, middle and long term MAs are in an ascending order and bearish PO is when long, middle and short term MAs are in a descending order.
-Dashboard shows status of PO depending on timeframe you open as follows:
Daily chart and above : Not displayed
4 hour chart: PO status of daily timeframe(4hour/1hour column will be blank)
1 hour chart: PO status of 4 hour and daily timeframe(1hour column will be blank)
30M/15M/5M: PO status of 1hour, 4hour and daily timeframe
Notes on parameters:
MA periods:
You have to input MA period as indicated by parameter: MA short, middle and long.
If MA period does not match this length, PO status will not be shown properly.
Dashboard Position
You can select either Top right or Bottom right where the dashboard is shown.
How Far is Dashboard From the Last Candlestick?
This is to adjust the position of dashboard horizontally.
The more you increase the number, the more the dashboard shifts toward right.
My recommendation is 20-30.
Sample chart
1hour
15M
————————————————————
移動平均線のパーフェクトオーダー発生状況をメインチャートに表示するダッシュボード型インジケーターです。
4つのドルストレート通貨ペア: ユーロ/ドル(EURUSD)、ドル/円(USDJPY)、ポンド/ドル(GBPUSD)、豪ドル/ドル(AUDUSD)の日足、4時間足、1時間足の3つのタイムフレームのパーフェクトオーダー発生状況を一覧表示することができます。
トレードで好成績をキープするコツの一つはトレンド相場でトレンドフォローでトレードすることだと思います。
移動平均線(MA)のパーフェクトオーダー(PO)はマーケットが発するトレンド発生シグナルの一つです。
パーフェクトオーダーの詳しい説明については以前リリースしたパーフェクトオーダーシグナルインジケーターの説明を参照ください。
3MA with Perfect Order Alert
このダッシュボードは異なる複数の通貨ペアの中からパーフェクトオーダーが発生している通貨ペアが一目見てわかるように作成しています。
日足、4時間足、1時間足の3つのタイムフレームのパーフェクトオーダー発生状況を確認することが可能です。
Pine ScriptのSecurity関数の制約上、表示できる通貨数が限られています。
したがって、ダッシュボードの表示対象通貨ペアは前述の4つのドルストレート通貨ペアとしています。
これらは複数の情報ソースで世界中でもっとも取引されている通貨ペアとして扱われており、トレードする人も多いだろうという理由からです。
機能概要:
-3本のMAを表示可能。MAはSMAかEMAを選択可能(MAは非表示可)
-POの発生はパラメータで定義された3本のMAが上から短期・中期・長期となった時に上昇POとして、上から長期、中期、短期となった時に下降POとして認識されます。
-ダッシュボードはユーザが開いているチャートのタイムフレームに応じて、以下のように表示されます。
日足とそれ以上のタイムフレーム:表示なし
4時間足:日足のPOのステータス(4時間と1時間の列はブランク)
1時間足:4時間足と日足のPOのステータス(1時間の列はブランク)
30分足/15分足/5分足:1時間足と4時間足と日足のPOのステータス
パラメータ設定注記:
MAの期間
パラメーター設定画面で指定された短期・中期・長期に合うように、それぞれの移動平均線の期間を設定する必要があります。
それ以外の場合、POステータスが正しく認識されません。
Dashboard Position
ダッシュボードをチャートの右上に表示するか、右下にするかを選択します。
How Far is Dashboard From the Last Candlestick?
ダッシュボードの表示位置を横軸で制御するためのパラメータです。
数字を大きくすればするほど、チャートの右側に表示することができます。
推奨値は20-30です。お好みで調節してください。
サンプルチャート
1時間足
15分足

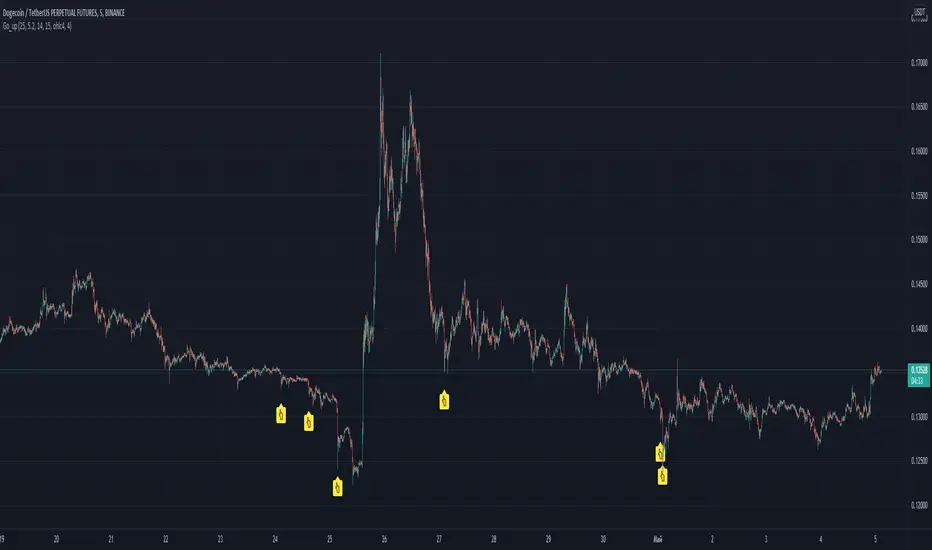
Go_up Hello. Our task is to find the local minimum. The trade is entered on the basis of RSI and SMA according to a specific formula, which is embedded in the code. When the RSI crosses the SMA upside down, a long position is entered. You can change the length of the RSI. The longer the length, the less frequent, but more accurate the entrance, and vice versa. You can use a different time frame. The default RSI length is 25 and the time frame is 15 minutes. Use hooks for auto trading, there is an alert. I recommend using a larger number of altcoins and with the default settings or TF 5 minutes. If you want to "scalp", then use the length 15-21 and take profit 0.5-2 percent. See the history of signals and you can make the optimal strategy for yourself. Due to the strong volatility, these settings are optimal. I use position averaging over history, additional purchase occurs no more than three times, before going into a plus. Entering a trade in notifications "once per bar". To exit, you can use scripts from other authors, for example, pivot / resistance points. No repainting. If anyone has any questions, write, I will answer in detail. good luck trading, dear friends!
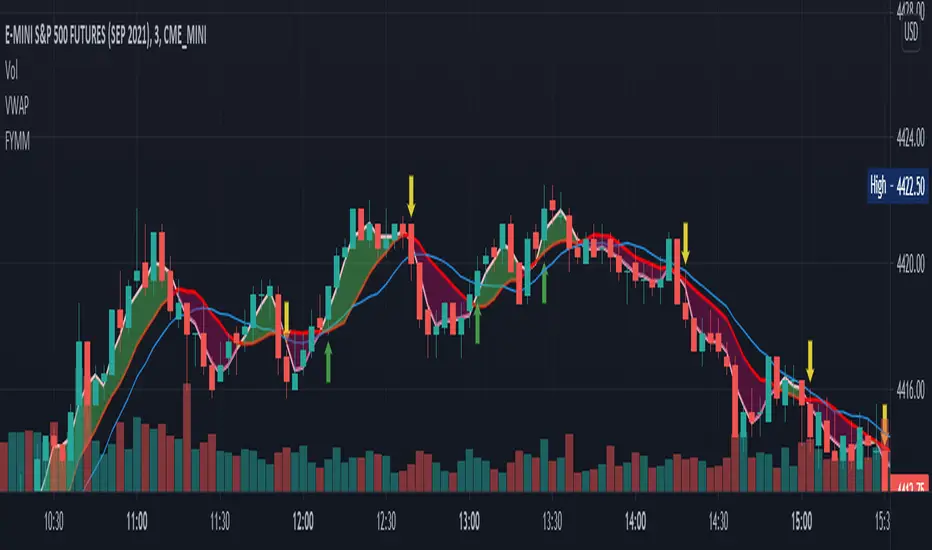
F_ You Money MakerThe FYMM is a combination of custom stochastics and an SMA cloud. The idea is when the bullish stochastic crosses over the bearish stochastic and a cross occurs on the cloud it will alert you. The indicator is slightly leading so you'll need to be careful and use near technical levels such as support and resistance or trend lines. Up arrow means enter a long down arrow means enter a short. Again, use this around technicals.
Snake Trend PremiumThis is an improved version of my original open source snake trend script.
I made this script to reference the current market environment while working on the lower time frames. It combines 8 slow moving averages to calculate the strength of the market trend. It will color the center of the line based on those results. The purpose of it is to visualise a bunch of sma lines into 1 line, it will make it much more organised and gives visual clarity instead of chaos. Do not use this script.
How the snake calculates trend strength for color:
1. It will check for each SMA line if it increased or decreased in value compared to previous candle.
2. An increase means +1 a decrease means -1
3. It will count those numbers to get a strength value ranging from -8 to 8
4. Each specific number is color coded and it will plot that color into the center of the snake based on the color theme selected in config
Configuration:
Show MA Lines = Ability to show the hidden lines used for calculation
5 Color Themes = Includes 5 color themes for the snake of which one based on the original, this is so the user can decide which color theme is most clear.
Plot Snake on other timeframe ? = Ability to plot the visual snake on the timeframe you want instead of current, this will not change the calculation and is only visual.
Use Current Timeframe MACD ? = Chose if you want to use a custom timeframe for MACD (outer skin of the snake line), below that are the standard MACD settings
Use Current Timeframe rsiMFI ? = Chose if you want to use a custom timeframe for rsiMFI (inner skin of the snake line)
Static SMA Length ? = The amount of candles the SMA uses to calculates it's value, standard SMA settings
Timeframe in Minutes SMA 1 = The timeframe line 1 uses (these timeframes are very important as they decide the trend strength calculation which is the backbone of the script. Below that are settings for all the other SMA's
SMA length input changes all lines at once.
The script will get published in 2 ways:
A simple version that will display the trend strength indicator as bars (no overlay)
A version which displays the strength as colors and includes a skin to see if higher or lower TF MACD and rsiMFI are in the negative or positive
Disclaimer:
Never enter a trade purely based on the indicator as it is a trend visualisation but not a good entry trigger.

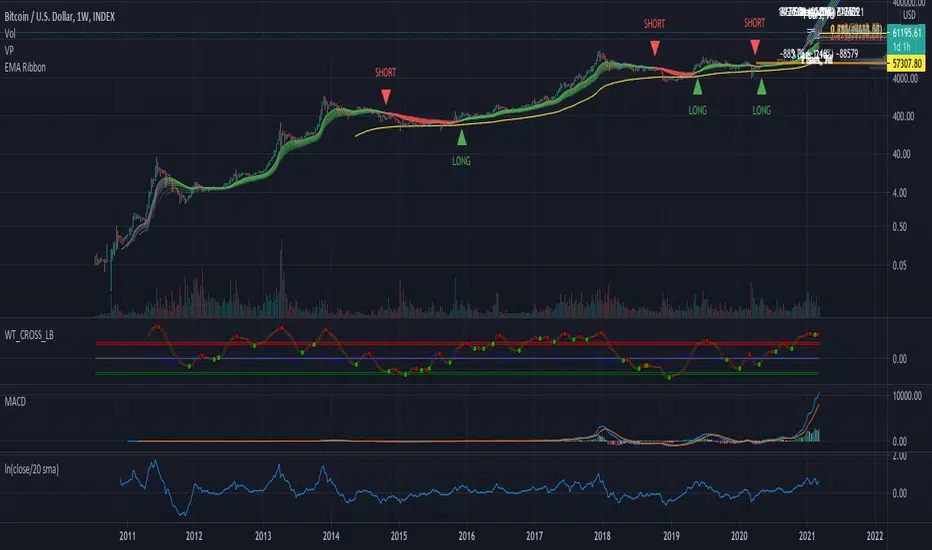
Price Extension - ln(close/20 sma)A simple script to visualize price extension. Useful to gauge tops/oversold areas. Most useful when used on weekly tf.
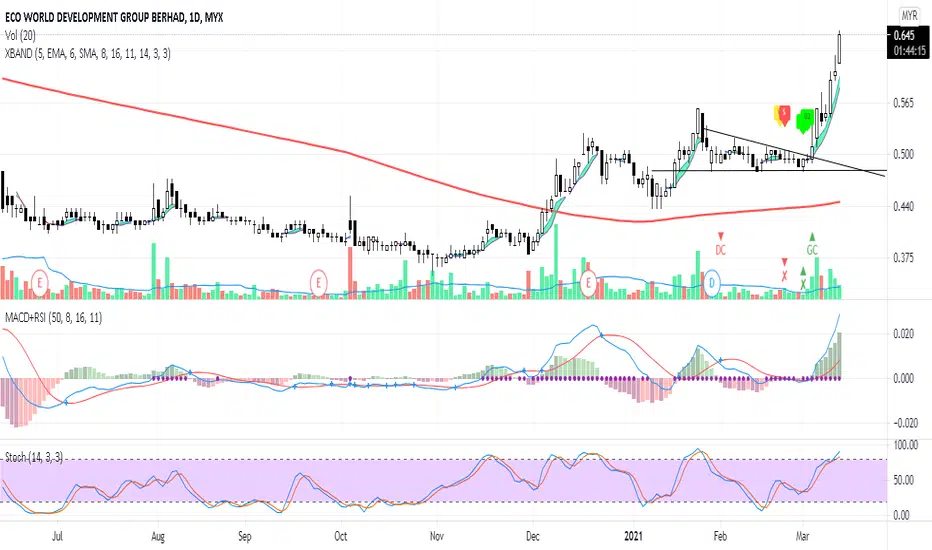
XBANDCombination of 3 Moving Average:
- Preset setting for MA 1 : SMA 5 (can be changed in setting)
- Preset setting for MA 2 : SMA 6 (can be changed in setting)
- Preset setting for SMA 200 (can't be changed)
Labels for Moving Average actions:
- Label B1 (lime color) : Current MA 1 price greater than previous MA 1 price
- Label B2 (lime color) : MA 1 crossed up MA 2
- Label W (yellow color) : Current MA 1 price lower than previous MA 1 price
- Label S (red color) : MA 1 crossed down MA 2
- Green Cloud: MA 1 crossed up MA 2
MACD (only display labels on chart):
- Preset setting for MACD 18, 16 & 11 (can be changed in setting)
- Label GC (green color) : Golden Cross occurred
- Label DC (red color) : Death Cross occurred
Stochastic (only display labels on chart):
- Uses default setting (can be changed in setting)
- Label x up (green color) : Stochastic k cross D
- Label x down (red color) : Stochastic D cross k
Notes:
Notes: This indicator is a secondary indicator. Therefore, you shouldn't used it solely for trading.
Monthly, Quaterly, Yearly SMA trendsIt highlights on the chart when the SMA20 crosses the SMA60 etc. for the Monthly, Quaterly, Yearly SMA trends.

Customizable MA RibbonAll credits to @Violent (www.tradingview.com) for making the original code! I just updated it by adding new features and themes!
---------------------------------------------
Lemon's Customizable MA Ribbon:
---------------------------------------------
A series of moving averages of different lengths that create a ribbon-like indicator. Traders can determine trend strength by lookin at the distance between the moving averages and the overall balance of the colored lines. Price movements through the ribbon can also be used to identify trend changes.
------------
FEATURES
------------
MA TYPES: SMA , EMA , WMA, RMA, ALMA, VWMA, HMA
Editable length
Editable start
User defined number of plots to show (between 1 to 32 total plots)
Multiple color theme choices
A color smoothing option.
Thank you and happy trading!
with love,
-Lemon

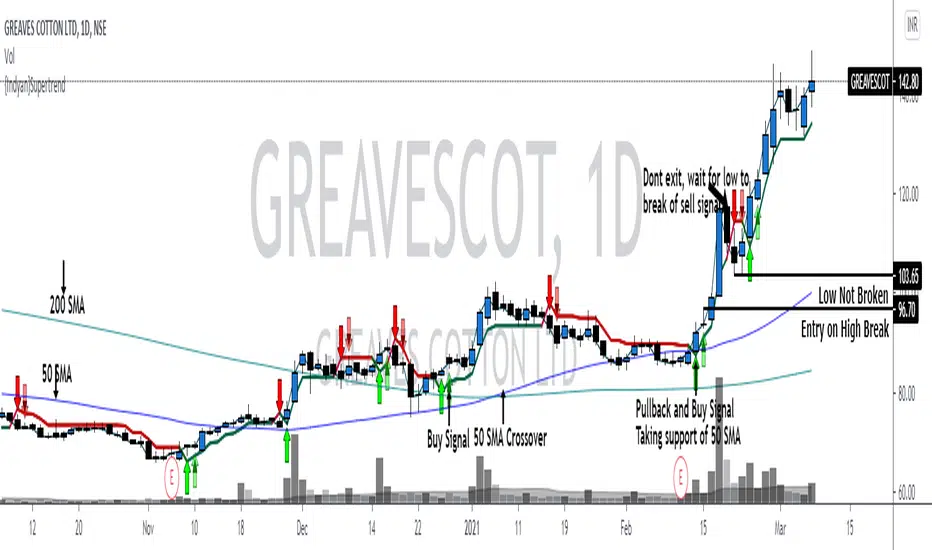
{Indyan}SupertrendHello trader friends,
A very simple but effective supertrend startegy which help u to get good RR. It is combination of 3 supertrend values with sma crossover. Enrty at pullback after sma crossover , exit only if sell signal low is broken.
I hope it will help my trader friends.
Love Indyan
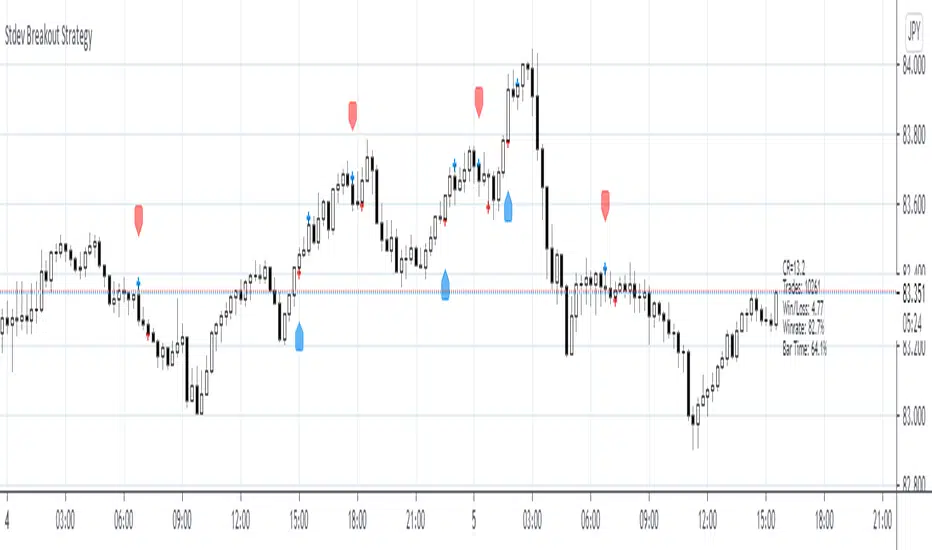
Stdev Breakout StrategyStdev Breakout Strategy
Description:
This script generates a long entry signal when the Standard Deviation crosses over the Simple Moving Average and the Close is greater than the Open, and/or generates a short entry signal when the Standard Deviation crosses under the Simple Moving Average and the Close is less than the Open.
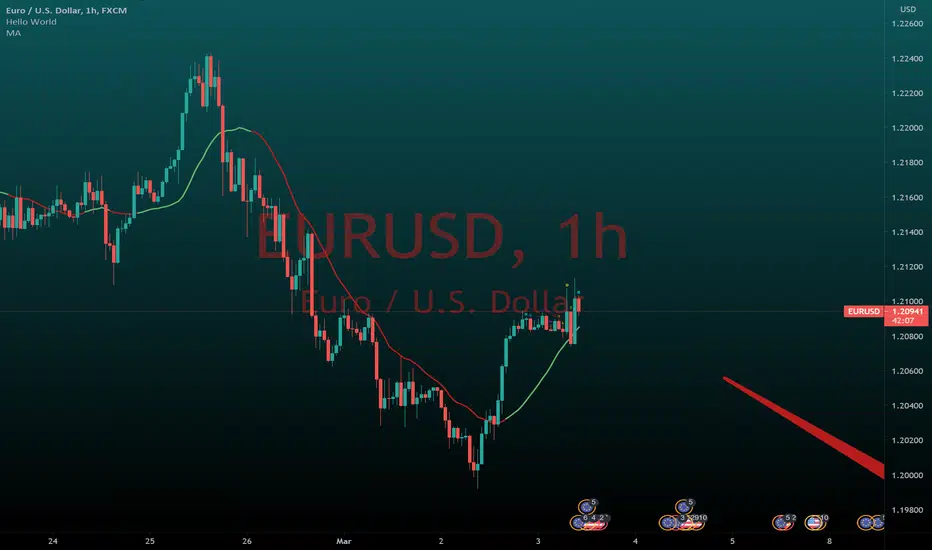
Moving Average Slope to determine market directionMoving Average Slope is a straightforward but also a handy indicator.
By inserting this moving average, it is possible to glance at the direction of the trend.
When the moving average has an increasing angle, it will turn green; vice versa, it will be colored red.
It is a trend indicator; I recommend leaving the period at 20 because it includes the last four trading weeks.
If you found this indicator useful, please like it
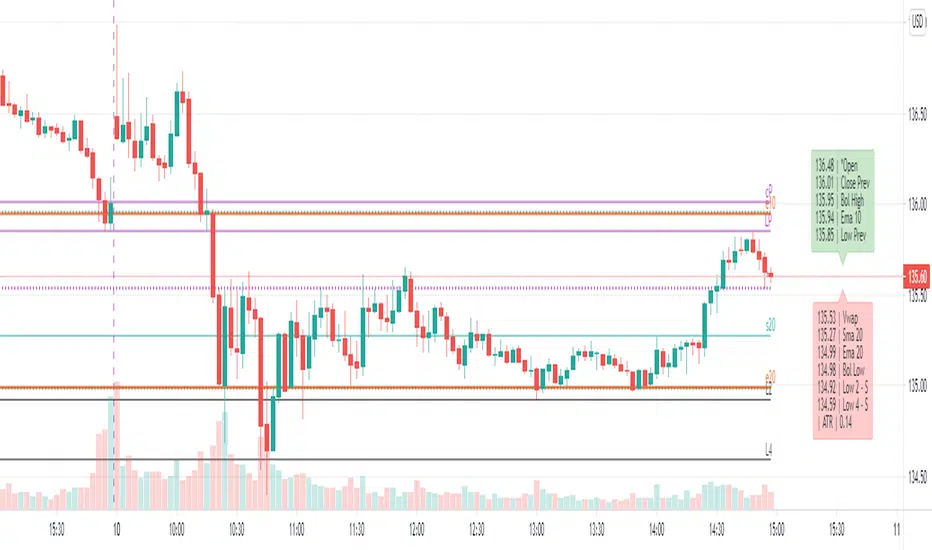
Dynamic levels from higher TF: EMA, SMA, OHLC, Bollinger, Vwap[ AR ] iLevels - indicator is intended for displaying important levels from a current and higher timeframe.
The indicator hides levels if they are far from the current price . The concealment range is based on the ATR * multiplier value. This keeps the graph clean and not shrinking .
Available levels:
- EMA - 5, 10, 20, 50, 100, 200, 300, 400, 500, 1000, 2000
- SMA - 20, 50, 100, 200
- Current day - Open/High/Low/Close
- Prev day - Open/High/Low/Close
- Prev days - Historical Open/High/Low/Close
- Vwap
- Local Bollinger - upper and lower channel boundaries from current timeframe
--- Detailed description ---
Why do you need an indicator?
The indicator is designed to display the most important levels from the current and upper time frames, which are support/resistance for the price. You do not need to constantly search for the level on the upper time frame and track it on the current one. For ease of understanding, here we will assume that the main time frame is one minute, and the upper one is daily, and we are trading intraday. Of course the indicator works on any time-frame. And the most convenient moment is that the indicator automatically hides and shows levels near the current price so that the chart does not shrink (does not increase along the vertical axis). An important point - the level is calculated for the current bar, i.e. 20 bars ago most likely it was not at this value (but you can see it through the market simulation). This means that the levels move with the price change and they are always horizontal for the current bar, and not historical in general.
Benefits
Automatic hiding of levels depending on ATR
Levels from the current time frame: Bollinger, Vwap
Levels from the upper time frame: Open/High/Low/Close of the current day and Open/High/Low/Close of the previous day
Levels from the upper time frame: popular EMAs, popular EMA fibonacci, popular SMA, previous historical High/Low, if the price did not touch them
Table (summary) with levels for quick orientation
When hovering over a table/level, a tooltip appears in%
Everything can customized. Levels, colors, styles, hints - you can customize everything and make a dream indicator.
Available levels
EMA and SMA
A whole set of popular EMAs from the higher time frame: 5, 10, 20, 50, 100, 200, 300, 400, 500, 1000, 2000. Fibonacci EMAs: 13, 34, 55, 89, 144, 233
In our basic example, we add the EMA from the daily chart to the minute chart:
SMA added only the most popular: 20, 50, 100, 200
Vwap and Bollinger Bands from the current time frame
Open/High/Low/Close of the current and previous day (bar)
Open/High/Low/Close of the current (example: Current Open) and the previous bar (example: Prev Open) are requested from the higher time frame. If we use the indicator on the data of the daily chart, then we get the open/close/min/max levels of the current and the previous day. These are the usual Pivot levels that can be used as support/resistance:
Historical Open/High/Low/Close
These are the Open/High/Low/Close values of 50+ previous bars from the upper time frame. Marked as o3 (the Open value of the 3rd bar back), H55 (the High value of the 55th bar back), etc. They serve as excellent support/resistance levels, you just need to look at the upper chart to determine the significance of this level
In our example with a one-minute chart and an upper daily time frame, we can, for example, see the exact values of the historical maximum resistance or some significant support at the close of the gap.
By default, only High and Low are enabled, as they are the most significant. The summary hint contains a letter after the level - R or S, respectively, this is resistance or support.
Another good example of historical levels. On the left chart there is a daily time frame, on the right is a minute with an indicator. The indicator accurately shows the nearest historical support Low 14, 19 and 54. On the left I have highlighted them for clarity:
Lines and labels
The line is the "level". The line is the ray. It starts from the last bar and goes to the left. Since this is a ray, looking at the historical data (rewinding the chart back), it will not rescale and collapse the chart.
Label is the abbreviated name of the level, for example V (Vwap), e50 (EMA 50), or H17 (High 17). The title has been abbreviated so as not to clutter up the graph. When you hover the mouse, a tooltip appears with the full name of the level, the price and the difference in % to this level from the current price.
Settings
The indicator is very flexible and you can customize it absolutely for any needs and tasks.
Higher time frame
This is the timeframe from where the indicator requests data for most levels.
You can use different variations: minute/day, day/week, etc.
Atr Multiplier
This is the setting that allows you to decrease/increase the number of displayed levels.
It's simple - a “space” is created near the price above and below. If the level falls into this “space”, then it is displayed.
The space above is calculated as:
Price + (ATR * AtrMultiplier) and below as: Price - (ATR * AtrMultiplier)
While on the minute chart, it is optimal to use the value up to 10, on the hourly chart - up to 2-3, on the daily chart - 0.5, etc.
Line Right Shift, Label Right Shift
How many bars the levels and labels above them move from the last bar. If Line Right Shift is set to negative, the line will start at this point and go to the right side of the chart.
Show Lines ?, Show Labels?
Need to show lines or labels above them? You can turn off one option and use only the other - lines without labels or vice versa.
Show Summary table?
Summary table is a table of data that conveniently displays the full name of the levels and the price. Hover displays a tooltip with levels as a percentage.
To maximize the acceleration of the trader, the following has been done:
Levels sorted by price
The table is split in two. Green table above - levels are more expensive than the current price (possible resistance). Red table below - levels are cheaper than the current price (possible support)
Distance between tables = ATR. We quickly and easily understand the value of ATR by looking at this distance. You can compare it with the nearest bars, which will give good information.
Show ATR in Summary?
In the lower table showing the value of the current ATR. Convenient, no additional indicator needed.
Always show in Summary
A list of levels that must always be displayed on the table, even if they are far away and have not appeared. The short names of the levels are specified, separated by commas. My basic set is Open, Vwap, EMA 10, EMA 20, Bollinger High, Bollinger Low.
Always show Levels
What levels should be displayed, even if they are far away. Bollinger channels are my choice. You can add Vwap, but in some cases it will compress the graph a lot, so Vwap is only in Summary by default.
Hide labels
In order not to clutter up the graph, you can remove some of the labels. For example, Bollinger Bands have their own style and are perceived visually - a mark above the level is not needed. You can add Vwap.
Replace labels on *
Which labels need to be replaced with an asterisk so as not to clog the graph. For example, this is Vwap, which has its own style. You can hover over the star and get a tooltip for the price.
Replace ALL labels on *
You can massively replace all tags with asterisks and get information when you hover over them.
Show Prevs Open/High/Low/Close?
4 settings that allow you to show historical levels. The labels are o12, H4, L72, c8. By default, only High and Low are enabled due to their significance.
Max Prev Days - how many bars back to get historical levels. Limited by TradingView's abilities and you can get about 50-100 bars back.
Current/Prev Open/High/Low/Close?
8 settings for displaying 8 levels of the current and previous day, which are important boundaries for the price. Current Close is disabled by default, as this is the current price level and is highlighted in TradingView.
Vwap?, Local Bollinger?, Sma ?, Ema?
Vwap level, Bollinger channels and a complete list of available Ema/Sma.
The most popular ones are enabled by default.
Color/Style/Width
Visual settings for lines. All lines are divided into 7 groups. Styles are customizable for the group as a whole.
Life hacks
You can add the indicator multiple times to the chart and set each copy to different time frames. For example, you have a minute chart. You add the indicator 3 times and set each indicator to daily, hourly and 15 minute time frames. Next, you set up the styles and colors for the lines on each indicator so that you can easily distinguish them from each other. Thus, you will not miss a single important level when trading intraday.
Known Issues
The main problem is overlapping of labels and levels. Overlapping labels is difficult to solve, but work is underway.
A side issue is the visual styles of levels and labels. The main goal is to create well-visually perceptible lines so that they can be instantly identified without reading the mark. We need to create a good color scheme for the level groups.
How can the community help and improve the indicator?
Suggest ideas.
Please, write them in the comments. Suggest edits to existing functionality. Suggest solutions to problems, new features, etc.
I believe that the community's suggestions for improvement can bring the indicator to perfection.
Thanks you!
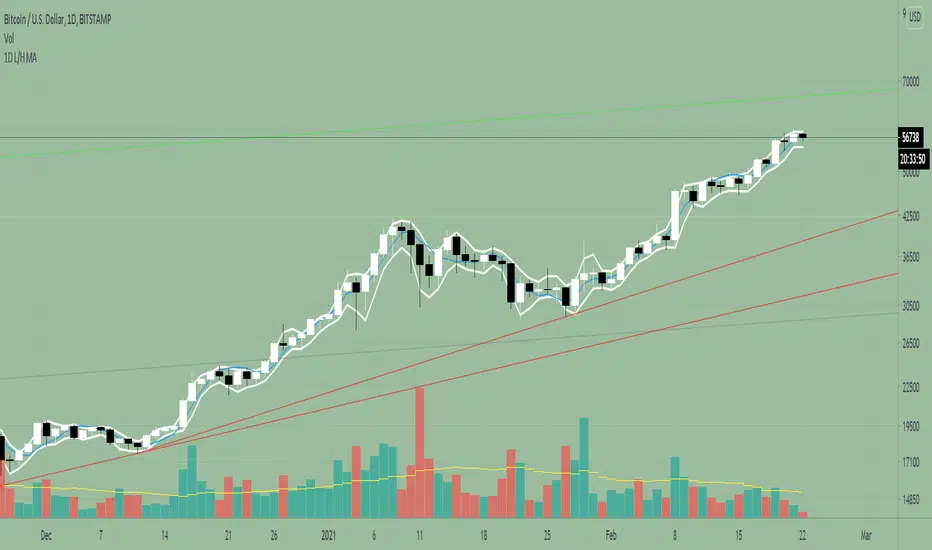
1D Low/High MA + Least Square Mean (3 indicators in 1)This indicator is a combination of 3 public indicators being:
* a standard Simple Moving Average with the source as the candle low & length of 2
* a standard Simple Moving Average with the source as the candle high & length of 2
* the Least Square Mean with a source of high + low /2 and length of 9
This combo was inspired by Tyler Coates who crafted EMASAR.
He regularly uses the a SMA with source of Low / High and length of 2 for defining trading daily ranges as well as the Least Square Mean for calculations in the his trading which he teaches via youtube.
I hope this indicator will reduce time spent on setting up charts.
Buy/Sell/Hold/Away? This script based on Simple Moving Average and Exponential Moving Average.
The Red Line is an exponential moving average with small length. It act as a main line.
The Black Line is an average of some past data of exponential moving average. Act as Trend Line
The green circles is an exponential moving average with medium length. It act as a signal line.
The Idea is, when the price move higher from it past,past,past, repeatedly in some duration, it will gain enough energy to fly to the highest.
Buy signal when red line cross down green circle. strong buy when red line cross down black line.
Sell signal when red line cross down green circle. strong buy when red line cross down black line.
Additional 1:
Triangle up(blue) indicate Buy Signal. it happen when the price break resistant with some condition and volume>1m
Triangle down(maroon) indicate Sell Signal. it happen when the price break support with some condition and volume>1m
The more triangle show in series, the strong the trend to move accordingly.
Additional 2:
Support and Resistance line.
Hope Benefit To You All.

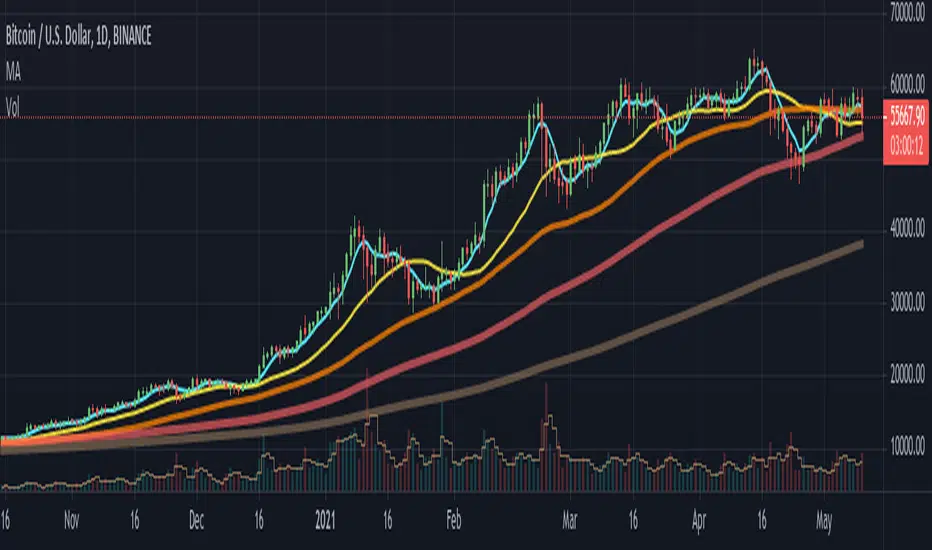
Customisable Moving Averages x5This is a Moving Averages pack with 5 lines.
This indicator is different from others because with it you can select the MA type used in calculations for each line.
Available MA types are (currently):
SMA
EMA
WMA
VWMA
RMA
HMA
Also configurable (for each line) are data source (open, close, hlc3, etc) and period.
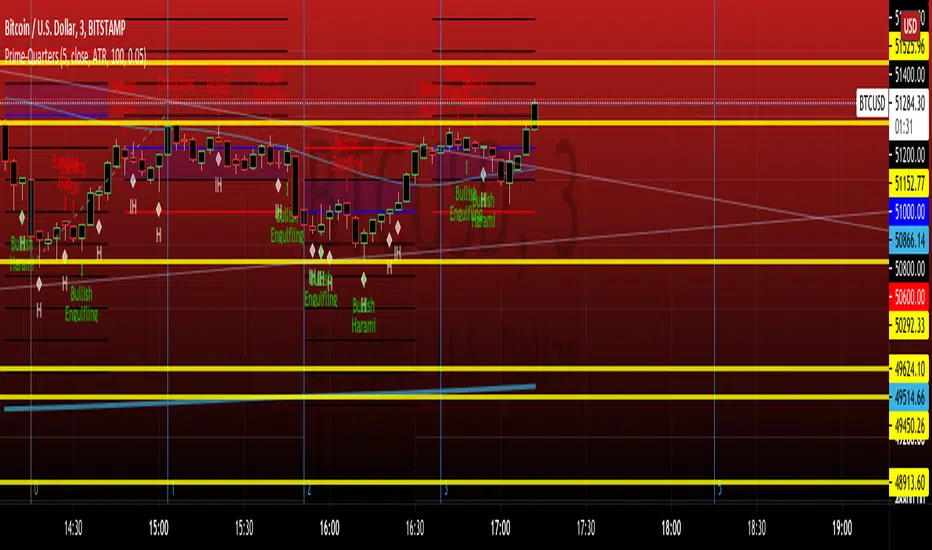
PRIME IMPULSE W/ 3MAThis indicator bundle, combined with PRIME-QUARTERS, provides a trader with everything needed, on chart, to make swing and scalper entries. The short candle SMA are used to execute immediate entries, while the larger candle tf indicate Continuation, trend changes and swing points. The color coded impulse indicator used both RSI and TSI variables to determine divergences and the probability of the impending impulse thereafter. Red and green within the candles indicate bull or bearish impulses, while the yellow bars signal decreased volume and momentum for the current impulse, indicating the possible end of trend and either retracement, or Reversal. $auceCamp
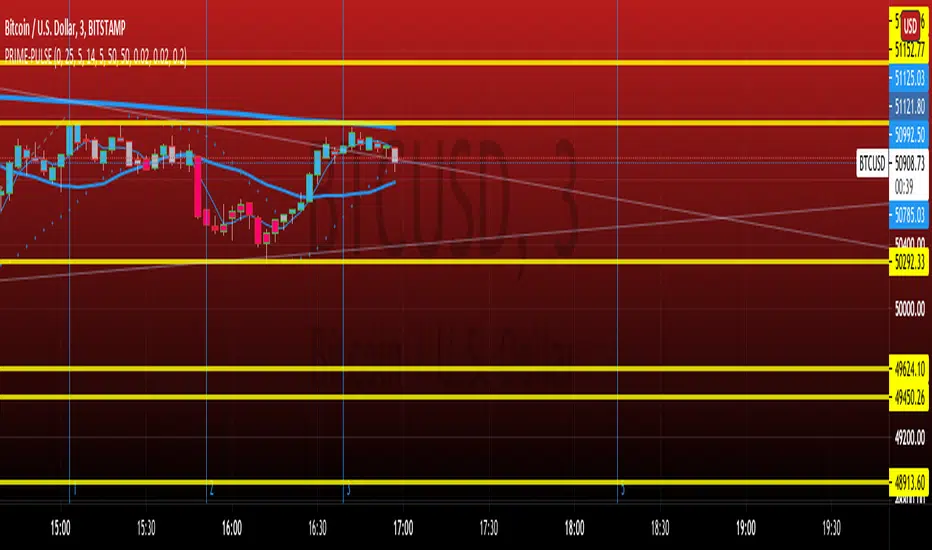
PRIME-QUARTERS W-XsThis script applies both the Quaters theory for easy analysis of market structure, as well as a 50 and 800 SMA to be used in conjunction with the 4 and 21 SMA found in Prime-Pulse, to pin point sniper entries. $auceCamp
Swing Trade - Jay Swing
shortest = ema(low, 9)
short = sma(low, 45)
longer = ema(close, 100)
longest = ema(close, 200)
MA, MATR, ChEx | All in One - 4CR CUPIn trade position setup, we always need to determine the market structure and manage the position sizing in a short period of decision time. Indicators such as moving average, initial stop loss and trailing stop loss are always helpful.
This indicator put all these handy tools into a single toolkit, which includes the following price action and risk management indicators:
MA - Moving Average
MATR - Moving Average less Average True Range
ChEx - Chandelier Exit
This script further enhances the setting so that you can easily customize the indicators.
For both the Moving Averages and the Moving Average less Average True Range , you can pick a type of moving average which suits your analysis style from a list of commonly used moving average formulations: namely, EMA , HMA , RMA, SMA and WMA , where EMA is selected as default.
The Moving Average less Average True Range , MATR, is usually applied as a reference to set the initial stop loss whenever opening a new position.
The abbreviation, MATR, is picked, so that this can serve as a handy reminder of a very good trading framework as elaborates as below:
M – Market Structure
A – Area of Value
T – Trigger
R – Risk Management (aka. Exit Strategy)

AEP Trend IndicatorWARNING!!!
This indicator is used not to sell and buy but to predict a trend.
Different Moving Averages are used for different periods.
Moving average is used for support and resistance line.It is safer to wait for the closing after the signals.
The bottom red line is the stop level.
The top black line is the dynamic resistance line.
The blue zone represents between resistance and stop line.
The green zone represents a rising trend.
The red zone represents a falling trend.
A close above resistance is a buy signal or you can wait for the indicator to signal.
For now, it only works in 15-minute, 1-Hour and 4-hour time frames and it’s public.

Rainbow Trend IndicatorThis is an indicator based on the MA rainbow concept. It is possible to choose between 15 or 20 MA's and if all 15 MA's is picked, the calculation will be calculated on 15 MA's and if 20 is picked the calculation is calculated on 20 MA's. The indicator will then be a line which is assigned a value from the calculation based on the MA's. If the line is above the dashed zero line, meaning the line's last value is a positive value, the price is in a uptrend and if the line is below the dashed zero line, meaning the line's last value is a negative value, the price is in a downtrend.
In short
If the line is green, the price is in a uptrend. If the line is red, the price is in a downtrend.
