[fikira] Volume + MTF MAVolume normally has 1 Moving Average (standard orange coloured)
This script gives 1 extra Moving Average (default blue coloured)
BOTH MA can be shown with Multi Time Frames,
based on the most excellent work of "PineCoders"
(MTF Selection Framework functions)!
This can provide more insights, also the crossovers can be interesting!
So, default there are 2 MA's of the present Time Frame + extra 2 TF's of these MA's
(default 2 and 4 times of the present TF)
All can be enabled/disabled,
Only 1 MA:
With labels and values:
Here 2 MA but + only 1 extra TF:
Sma

[fikira] Fibonacci MA / EMA's (Fibma / Fibema)I've made SMA/EMA's NOT based on the principle of the 2(1+1), 3(2+1),
5(3+2), 8(5+3), 13(8+5), 21(13+8), 34(21+13), 55(34+21), ... numbers,
but based on these following Fibonacci numbers:
0,236
0,382
0,500
0,618
0,764
1
Ending up with 2 series of Fibma / Fibema:
"Tiny Fibma / Fibema":
24, 38, 50, 62, 76, 100
"Big Fibma / Fibema":
236, 382, 500, 618, 764, 1000
IMHO it is striking how these lines often act as Resistance/Support,
although (except the 50, 100 & 500) they are not typical MA/EMA's.
They perform very well on every Timeframe as well!
Week:
3 Days:
1 Day:
4h:
1h:
Even on the 15 minutes:
Or 5':
Things to watch for:
Price compared to the Tiny or Big Fibma / Fibema (below or above)
Price compared to important Fibma / Fibema (for example below or
above MA 236, MA 764, MA 1000, ...)
Crossing of Fibma / Fibema 24/76, 236/764 and 38/62, 382/618
(bullish crossover = Lime coloured "cloud", bearish crossunder = Red coloured "cloud"),
...
I've made a change in barcolor if the close crosses the "Big Fibma / Fibema 500"
If price closes above MA/EMA 500, the first bar is yellow coloured,
if price stays above this level, candles are coloured lime/orange (= very bullish)
If price closes under MA/EMA 500, the first bar is purple,
if price stays under this level, candles are standard coloured (= very bearish)
Strategy will follow,
Thanks!

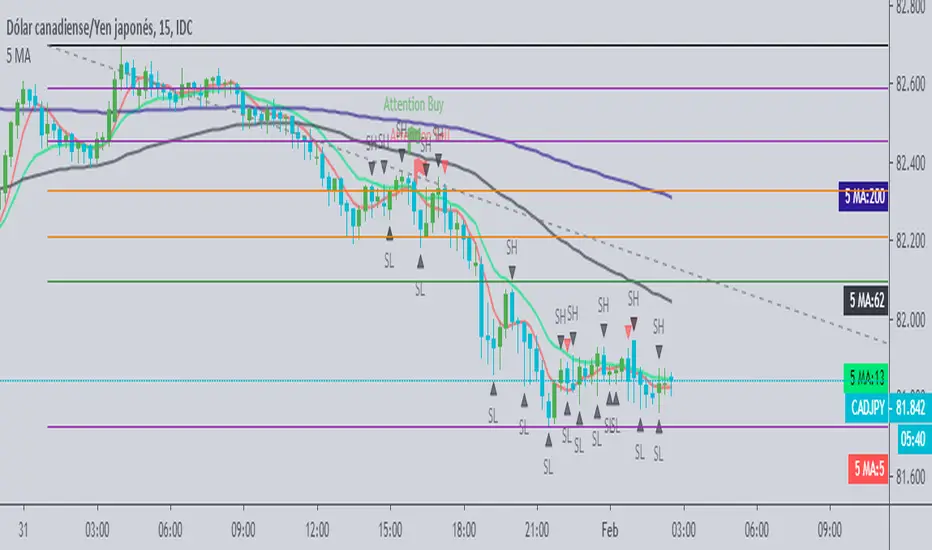
5 MAThis indicator can help you out to check for entry points, taking in concideracion ema cross, providing you an alert before the entry and as doble check once you get the confirmation you will be able to put you order
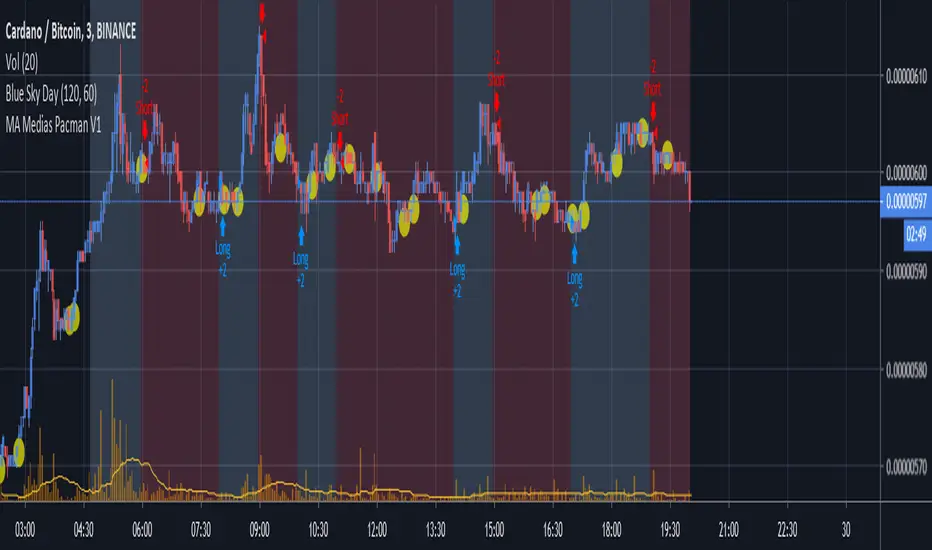
MA Medias Pacman V1The indicator shows the cross of 2 medias, when the moving average lines cross, a small circle is shown on screen, this is useful when you work with small timeframes. This script helps you to find the small trends. You can combine it with rsi or macd.
SMA by KGS 5 MA's in 1 indicatorIn this indicator you can use 5 moving averages in a single indicator.
You can also adjust the moving averages time period and color code.
Turning on/off is also available as per your convenience.

Genesis 20/200 Trend ScalperThis is a 20 / 200 SMa trend scalper, works on all time frames to Identify Trend and short/long scalp opportunities. The Indicator is very simple and it includes the following
20 SMA
100 SMA
200 SMA
when the 20 SMA is green and above the 200 SMA go long...When the 20 SMA is red and below the 200 SMA then short.
Simple Moving Average - ATR Trailing StopThe old adage goes "Cut losers fast and let the winners run"
With this in mind, this will plot a dynamic trailing stop by subtracting any multiplier of the Average True Range (ATR) from the SMA of your choice.

Chingas EMA/MA - White BackgroundI use a lot of Black Background as well as a lot of White background charts. Therefor when I made the Black Background version, I'd have to change all the settings when I was on a White Background. And thus, the White Version was born!
Those who love their Dynamic Support and Resistance will hopefully find some value with this indicator.
This is not the end all be all EMA/MA but something that I wanted for myself and figured some other traders may like to use it as well.
I have one for BLACK Background as well and that has already beed posted.
By Default I have the following EMAs:
9
21
50
70
100
200
By default I have the following SMAs:
20
50
100
200
350
www.dropbox.com
www.dropbox.com
If you go into your settings and select
INDICATOR NAME LABEL and
INDICATOR LAST VALUE
then you will be able to see a super easy and super clean representation on your scale for exactly which EMA/MA you want the value of.
www.dropbox.com
Obviously you can change the colors to whatever you want and you can change the source to whatever you want.
You can also change the length to whatever you want but the names are coded in. In other-words if you want to use a 99 EMA instead of a 100, you can change it to 99 from 100 BUT the name will always be 100.
Enjoy.
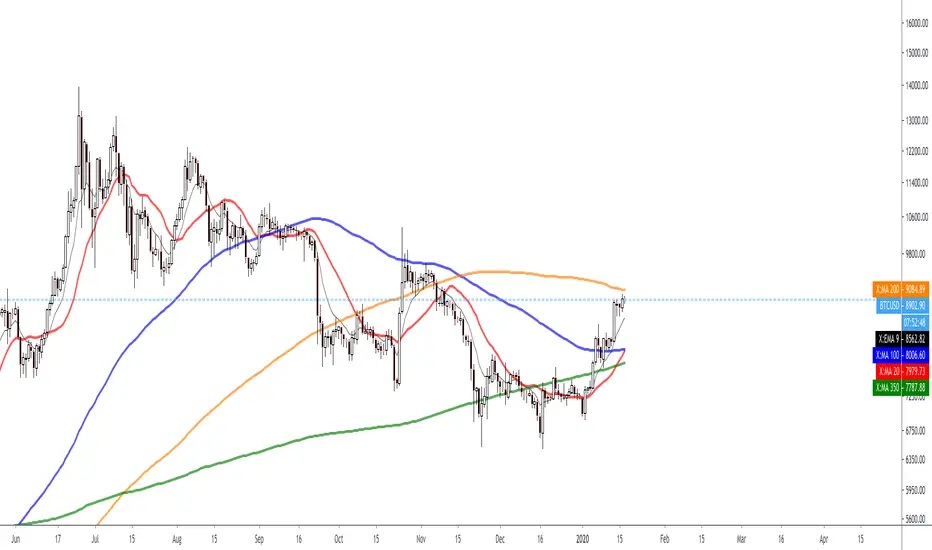
Chingas EMA/MA - Black BackgroundThose who love their Dynamic Support and Resistance will hopefully find some value with this indicator.
This is not the end all be all EMA/MA but something that I wanted for myself and figured some other traders may like to use it as well.
I have one for WHITE Background as well and I'll post that shortly.
By Default I have the following EMAs:
9
21
50
70
100
200
By default I have the following SMAs:
20
50
100
200
350
www.dropbox.com
www.dropbox.com
If you go into your settings and select INDICATOR NAME LABEL and INDICATOR LAST VALUE then you will be able to see a super easy and super clean representation on your scale for exactly which EMA/MA you want the value of.
www.dropbox.com
Obviously you can change the colors to whatever you want and you can change the source to whatever you want.
You can also change the length to whatever you want but the names are coded in. In other-words if you want to use a 99 EMA instead of a 100, you can change it to 99 from 100 BUT the name will always be 100.
Enjoy.

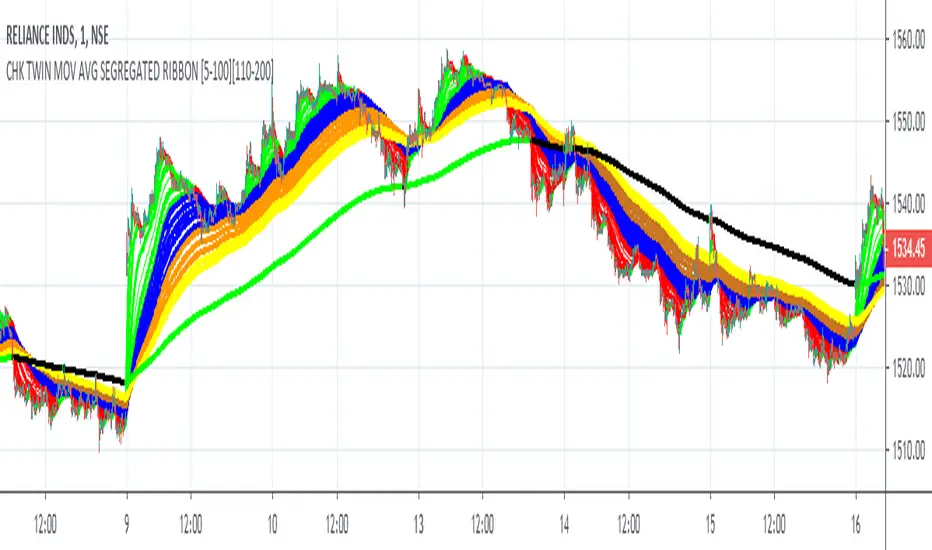
FALSE BREAKOUT NO PROBLEM !! CHK TWIN MOV AVG SEGREGATED RIBBON PROBLEM DEFINITION 1 : To Avoid False Breakouts
PROBLEM DEFINITION 2 : To Ascertain if the trend has changed when a Stock opens with a Gap up or Gap Down
## PROBABLE SOLUTION : Use a Moving Average with lot of latency
## PROBLEM WITH ABOVE SOLUTION : Misses on lot of trades, Late exits leads to drain on winning trades
S O L U T I O N
An Indicator which plots two different types of Moving Averages at the same time
For the MA length 5-100 a fast plot of choice
For the MA Length 110-200 a plot with a lag to ascertain the trend
And then ONE LAST MAN STANDING with even bigger MA length for a lagging indicator to save the day
This indicator gives one 9X9 = 81 Permutation Combinations to look at the markets
One can devise strategies basis if one particular MA Type has crossed another MA Type
Feel free to post the strategies you have come out with!
//// CREDITS AND ACKNOWLEDGEMENTS //////////////////////////////////////////////////////////////////
Following contributors helped the author ::
Credits to Neobutane for his Multiple Type Mov. Avg. Guppy at ......
hxxps://www.tradingview.c0m/script/UQAv1U0c-MA-Study-Different-Types-and-More-NeoButane/
Credits to Jose5770 for sharing Jurik MA code at .....
hxxps://www.tradingview.c0m/script/uqYvkHna-Trend-Direction-Force-Index/
Appreciate and Thank You for sharing your work.
//////////////////////////////////////////////////////////////////////////////////////////////////////
P.S You might notice in the code that the few plots are skipped. It is done to fasten the indicator without compromising
on the functionality
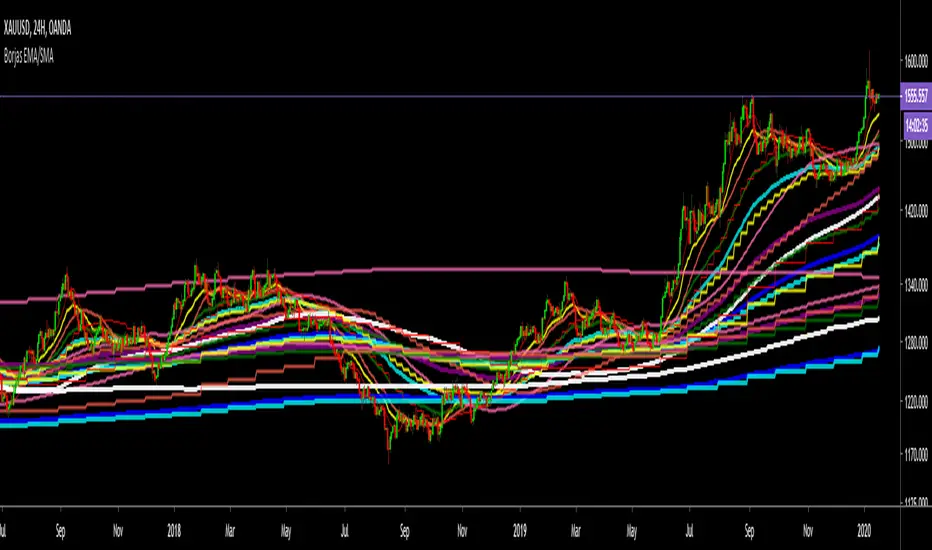
Borjas Tarh EMA/SMA Combo MTFBorjas Tarh EMA/SMA Combo MTF
Include 4 Sets of EMA s & SMA s which can apply to multiple Time Frames .
Each Moving Average can be edited or be toggled. So you can watch specific EMA s/ SMA s on other Time Frames .
© mrhashem
© Borjas Tarh Company
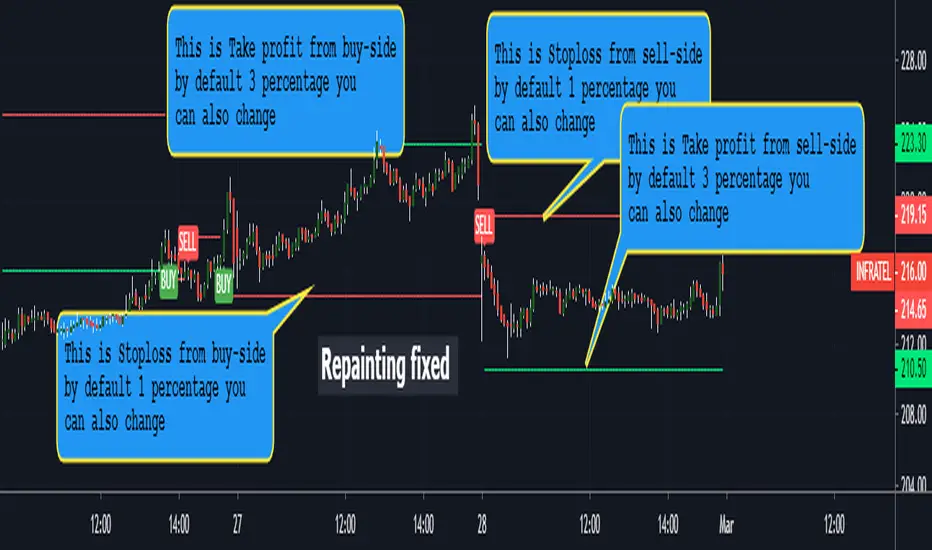
unRekt - KISS CrossKISS Cross is a moving average crossover and is part of the ''keeping it simple' series that have a similar color scheme. With this indicator you can select the moving average you'd like to use either SMA, EMA, WMA, or VWMA. Each moving average can be turned on or off and input changed. The first two MA's will change color on the cross from green to red depending on cross up or a cross down.

Functions Allowing Series As Length - PineCoders FAQ█ WARNING
Improvements to the following Pine built-ins have deprecated the vast majority of this publication's functions, as the built-ins now accept "series int" `length` arguments:
ta.wma()
ta.linreg()
ta.variance()
ta.stdev()
ta.correlation()
NOTE
For an EMA function that allows a "series int" argument for `length`, please see `ema2()` in the ta library by TradingView .
█ ORIGINAL DESCRIPTION
Pinescript requires many of its built-in functions to use a simple int as their period length, which entails the period length cannot vary during the script's execution. These functions allow using a series int or series float for their period length, which means it can vary on each bar.
The functions shared in this script include:
Rolling sum: Sum(src,p)
Simple moving average: Sma(src,p)
Rolling variance: Variance(src,p)
Rolling standard deviation: Stdev(src,p)
Rolling covariance: Covariance(x,y,p)
Rolling correlation: Correlation(x,y,p)
If p is a float then it is rounded to the nearest int .
How to Use the Script
Most of the functions in the script are dependent on the Sma function. The Correlation function uses the Covariance and Stdev functions. Be sure you include all the required functions in your script.
Make sure the series you use as the length argument is greater than 0, else the functions will return na . When using a series as length argument, the following error might appear:
Pine cannot determine the referencing length of a series. Try using max_bars_back in the study or strategy function.
This can be frequent if you use barssince(condition) where condition is a relatively rare event. You can fix it by including max_bars_back=5000 in your study declaration statement as follows:
study("Title",overlay=true,max_bars_back=5000)
Example
The chart shows the Sma , Stdev , Covariance and Correlation functions. The Sma uses the closing price as input and bars as period length where:
bars = barssince(change(security(syminfo.tickerid,"D",close ,lookahead=true)))
The Stdev uses the closing price as input and bars + 9 as period length. The Covariance and Correlation use the closing price as x and bar_index as y , with bars + 9 as period length.
Look first. Then leap.

CryptoBandsGuru MultiColor Bollinger BandsHere are my Bollinger Bands that come with 2 std dev bands and a variety of moving averages. The bands can have shading between the bands and the middle section can be shaded.
Moving Averages include:
SMA
EMA
Weighted
Hull
Symmetrical
Volume Weighted
Wilder
Right now my 2 favorites are the Hull with a std dev of .5 and the Wilder with a std dev of 1.7 and 2.0.
You can get some really good signals buy putting both on the same chart. The faster Hull will move above and below the slower Wilder and show good price action.

CHK TimeSeriesLagReductionFilter[MULTI MA]This script is an improvement on the idea published on " Time Series Lag Reduction Filter "
This script allows users to select the Moving Average of his choice. Helps precise entries and precise exits.
Since every Moving Average is different, play with the settings to get the best fit. If the "Lag Reduce" overshoots bring down the number.
CREDITS ::
TO theheirophant for this idea
TO NEOBUTANE for his MULTI TYPE MOV AVG GUPPY
Thank You NEOBUTANE and Theheirophant.
This is my first publication :)
Sharing few examples what this script can do

MACD AND SMA COMBINATION [MV]Hello everyone, This indicator based Multi-Indicator For Example MACD AND SMA.
how will come to buy signal?
When macd line crossingup signal line and sma above open bar
when will come Buy signal
or
When sma above open bar and macd line crossingup signal line
when will come Buy signal
how will come to Sell signal?
When macd line crossingdown signal line and sma below open bar
when will come sell signal
or
When sma below open bar and macd line crossingdown signal line
when will come Buy signal
if you have issues about this indicator comment there.
Thank you so much
LSMA - A Fast And Simple Alternative CalculationIntroduction
At the start of 2019 i published my first post "Approximating A Least Square Moving Average In Pine", who aimed to provide alternatives calculation of the least squares moving average (LSMA), a moving average who aim to estimate the underlying trend in the price without excessive lag.
The LSMA has the form of a linear regression ax + b where x is a linear sequence 1.2.3..N and with time varying a and b , the exact formula of the LSMA is as follows :
a = stdev(close,length)/stdev(bar_index,length) * correlation(close,bar_index,length)
b = sma(close,length) - a*sma(bar_index,length)
lsma = a*bar_index + b
Such calculation allow to forecast future values however such forecast is rarely accurate and the LSMA is mostly used as a smoother. In this post an alternative calculation is proposed, such calculation is incredibly simple and allow for an extremely efficient computation of the LSMA.
Rationale
The LSMA is a FIR low-pass filter with the following impulse response :
The impulse response of a FIR filter gives us the weight of the filter, as we can see the weights of the LSMA are a linearly decreasing sequence of values, however unlike the linearly weighted moving average (WMA) the weights of the LSMA take on negative values, this is necessary in order to provide a better fit to the data. Based on such impulse response we know that the WMA can help calculate the LSMA, since both have weights representing a linearly decreasing sequence of values, however the WMA doesn't have negative weights, so the process here is to fit the WMA impulse response to the impulse response of the LSMA.
Based on such negative values we know that we must subtract the impulse response of the WMA by a constant value and multiply the result, such constant value can be given by the impulse response of a simple moving average, we must now make sure that the impulse response of the WMA and SMA cross at a precise point, the point where the impulse response of the LSMA is equal to 0.
We can see that 3WMA and 2SMA are equal at a certain point, and that the impulse response of the LSMA is equal to 0 at that point, if we proceed to subtraction we obtain :
Therefore :
LSMA = 3WMA - 2SMA = WMA + 2(WMA - SMA)
Comparison
On a graph the difference isn't visible, subtracting the proposed calculation with a regular LSMA of the same period gives :
the error is 0.0000000...and certainly go on even further, therefore we can assume that the error is due to rounding errors.
Conclusion
This post provided a different calculation of the LSMA, it is shown that the LSMA can be made from the linear combination of a WMA and a SMA : 3WMA + -2SMA. I encourage peoples to use impulse responses in order to estimate other moving averages, since some are extremely heavy to compute.
Thanks for reading !

Hashem Correlation CoefficientCorrelation Coefficient
Core Code from: www.tradingview.com
This indicator Show Correlation between the Current Ticker & timeframe and a Customizable Ticker. After adding the indicator you can change the second ticker in the settings.
The Correlation Coeff is between -1 to 1 which 1 means 100% correlation and -1 means -100% correlation ( Inverse Correlation ).
The color of the area changes when:
Blue : CC > 0.5
Aqua : CC > 0.75
Purple : CC < -0.5
Red : CC < -0.75
8/8/8 Moving Averages
Total of 24 individual moving averages. There are 3 groups, and each group has 8 moving averages. Each group can be set the different sources and different moving average types(SMA, EMA, RMA, WMA).

SMA %The percentage difference from the close to the mean of SMA. Positive when above negative when below.

Fancy Moving Average [BigBitsIO]This script is for a single moving average with as many features as I can possibly fit into a single moving average. If you can think of more, or have questions regarding this script, please message me or contact me via social media.
Features:
- A single moving average (MA).
- Standard MA inputs.
- MA type.
- MA period.
- MA price.
- MA resolution (time frame).
- Visibility toggle.
- Fancy MA inputs.
- Toggle to show only candles included in the MA calculation ("Highlight inclusion") or display entire MA history.
- Toggle to show a ghost trail when Highlight inclusion is toggled on. Displays a shaded version of past MA history before the inclusion period (as seen on snapshot).
- Toggle to show forecast values for the MA.
- Other inputs related to forecasting:
- Forecast bias. (Neutral forecasts MA if the current price remains the same.)
- Forecast period.
- Forecast magnitude.
*** DISCLAIMER: For educational and entertainment purposes only. Nothing in this content should be interpreted as financial advice or a recommendation to buy or sell any sort of security or investment including all types of crypto. DYOR, TYOB. ***

MA - EMA - DMA - ICHIMOKU - BOLLINGER BANDS - SUPPORT RESISTANCE*** FREE ACCESS ***
JUST ADD THE SCRIPT
Multiple indicators in a single script
Moving Average, Exponential Moving Average, Displaced Moving Average, Ichimoku, Bollinger Bands and Support / Resistance
I hope that you will enjoy this script,
Take care
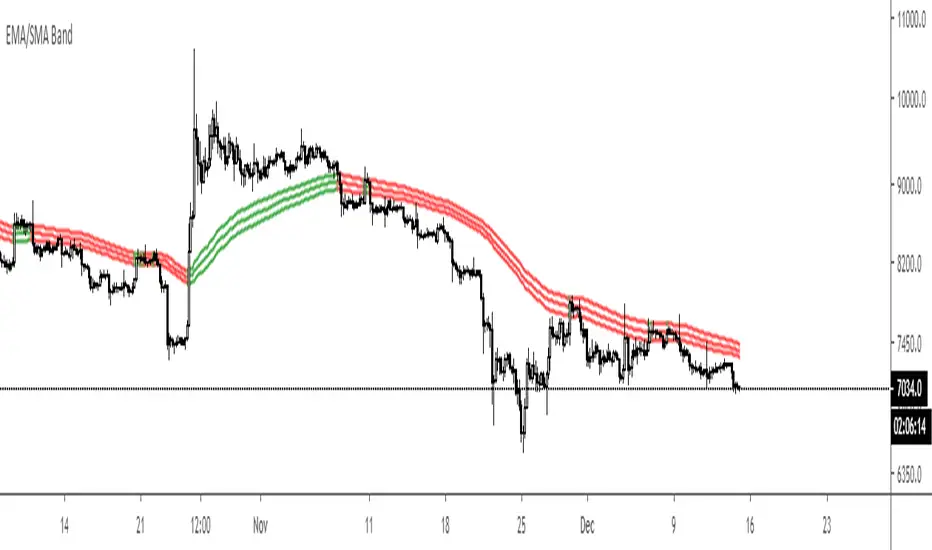
EMA/SMA BandPlot the source high, low and close of any given ema or sma. Support and resistance is defined as an area where price is likely to bounce or get rejected and since MA's are usually just one line, this band is meant to act as an area surrounding the original MA and therefore avoiding fake outs.