Day Trading Signals Trend & Momentum Buy/Sell [CocoChoco]Day Trading Signals: Trend & Momentum Buy/Sell
Overview
The indicator is a comprehensive day-trading tool designed to identify high-probability entries by aligning short-term momentum with long-term trend confluence.
It filters out low-volatility "choppy" markets using ADX and ensures you are always trading in the direction of the dominant higher-timeframe trend.
Important: Use on timeframes from 15 min to 2 hours, as the indicator is for day trading only.
How It Works
The script uses a three-layer confirmation system:
Trend Alignment: Uses a Fast/Slow SMA cross (10/50) on the current chart. Signal prints only if price closes above (for bullish) or below (for bearish) the 10-period SMA.
Higher Timeframe Confluence: The script automatically looks at a higher timeframe (1H for charts <=15m, and 4H for others) and checks if the price is above/below a 200-period SMA.
Momentum & Volatility: Signals are only triggered if the Stochastic Oscillator is rising/falling and the ADX is above 20, ensuring there is enough "strength" behind the move.
Visual Signals Buy/Sell
Green Label (Up Arrow): Bullish entry signal
Red Label (Down Arrow): Bearish entry signal.
Red "X": Exit signal based on a moving average crossover (trend exhaustion).
Visual Risk/Reward (1:1) Boxes: When a signal appears, the script automatically draws a projection of your Stop Loss (Red) and Take Profit (Green) based on the current ATR (Average True Range).
How to Use
Entry: Enter when a Label appears. Ensure the candle has closed to confirm the signal.
Stop Loss/Take Profit: Use the visual boxes as a guide. The default is 1.0 ATR for risk and 1.0 RR ratio, which can be adjusted in the settings.
Exit: Exit the trade either at the target boxes or when the Red "X" appears, indicating the trend has shifted.
Please note that this is just a tool, not financial advice. Perform your own analysis before entering a trade.
Sma50

Daily/MTF Moving Averages (EMA20, EMA55, SMA50, SMA100, SMA200)Script to plot common daily/alternative timeframe moving averages on when viewing securities at other resolutions.
There's lots of different MA scripts out there, but I couldn't find one that just represented the standard support/resistance indicators that were typical for my markets. So, this is the DIY. :)
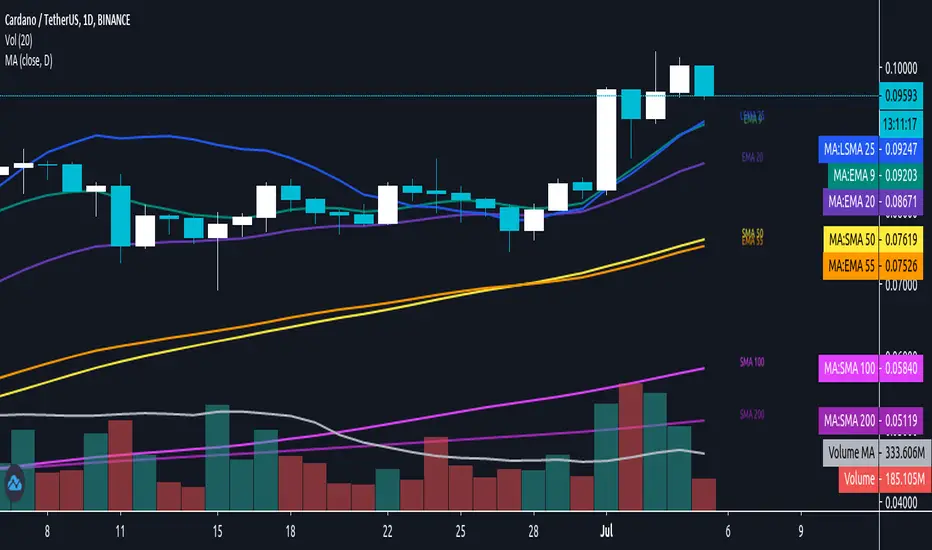
sma 50 100 200 multi Timframes actual daily weekly monthlysma 50-100-200
Just 3 sma from actual,daily,weekly and monthly timeframe
SMA 50 collector V2Hi everyone
The today script is an upgrade on steroids of my previous SMA 50 collector
Why this script ?
The SMA 50 is known to define a trend. If price is closing above, trend is bullish , if below, trend is bearish.
That's why I like to have all of them in all timeframes on my chart :)
Those are very relevant for all assets class : FOREX, INDEX, STOCKS, CRYPTO, ...
What's the update ?
I added new timeframes and developped a small optimization to get those labels placed on the right hand side of your screen.
"Is it really useful sir ?" Well, you certainly noticed that looking at a chart on tradingview mobile is not ideal (indicators overlapping, indicator names taking too much space and so on...)
When you'll deactivate the indicator name label display from tradingview, you can activate mine which will look way nicer on your mobile (and even Desktop).
This concept was greatly inspired by @scarf :
HOW TO USE IT ?
You can activate/deactivate the SMA50 you (don't) need in the style section of the indicator configuration UI. You'll just have to uncheck/check. Simple right :) ?
See y'all tomorrow for the next indicator or idea. The one for tomorrow should blow your mind as it certainly did when I discovered and optimized it
Enjoy
Dave
