Forex lot size calculation🔶What it is ?
Forex lot size calculation is an indicator to help traders to manage trading account better and avoid emotion when you're changing account from small to bigger capital.
This indicator calculates lot size to entry by calculation risk in percent that you're planing for a position and your account balance also.
Our purpose is, keep your mind always "Empty" during trading even you're managing 100k$, 200k$ and more, espeically when you're changing from small account to bigger account.
The diffirence here is only Lot size you will input, we don't need to focus on how many money in dollors will we lost after a position. Each position, that's 1%, 2% balance , just like that. From that point, we can control emotion better and trade more effectively.
🔶 Who can use it ?
1. All traders who are using NCI, ICT , MACD system and other systems...
2. All traders who are trading on any timeframe
3. All traders who are trading on Forex market
4. All traders who are new or experienced traders
5. All traders who are swing or scalping traders
🔶 The purpose of indicator
1. Calculate lot size for all forex pairs exactly to trade on other platform like MT4/5, Ctrader and even Tradingview.
2. Exchange from risk by percent of account to lot size
3. Helping you to manage trading accounts easier
4. Always "Empty your mind" during Trading
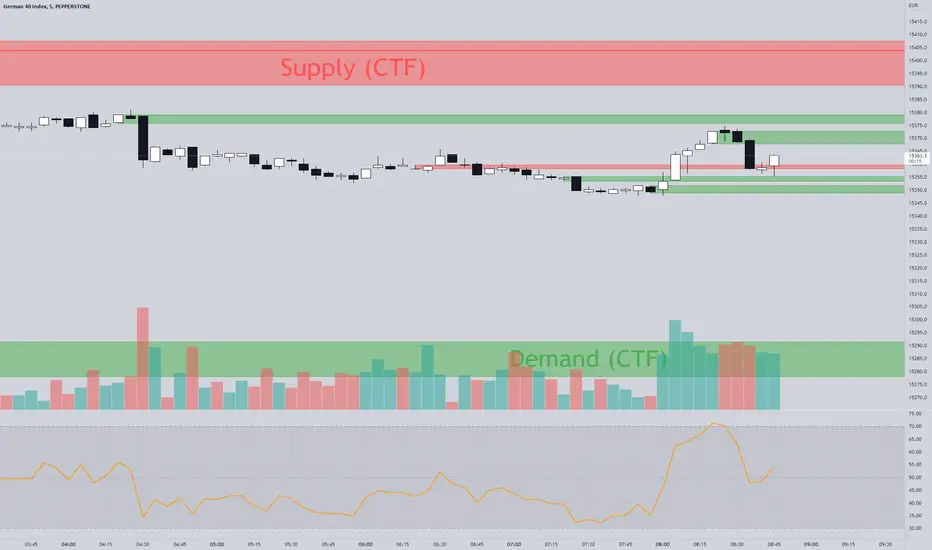
🔶 How will indicator appear on chart
After you added it on chart, indicator will appear as table at your bottom right of chart. You can change it to Top-center as above chart by setting that I will guide you right on below.
In general, you can see three data :
1. Acc size $: That's your account balance you already input
2. %Risk : Here is risk by percent that you're planing to trade
3. LOT SIZE : Here is value after calcuation to help you can know how many lot size to entry.
Indicator will show you as three colors also :
GREEN : You're taking risk at a safe level that's less than 1%your account. You normally can trade better and manage trade easier with risk like that.
WHITE : You're taking risk at a normal level that's from 1 - 2% your account. You should becareful during taking this risk because it is only for experience traders.
RED : You're taking risk at a dangerous level that's greater than 2% your account.
This type of risk is only for top trader who can earn profit from mange consistency for a long time. Plus, with this type of risk, you will be rejected by prop firm companies easier because of gambling rules.
🔶 INPUT value
There're 2 groups for trader to input and use this indicator :
1. Trading input :
You need to input data to calcuate lot size here
- Your account balance : here is your initial account balance that you deposit
- Acc risk % : Here is risk by percent you're planing for each position.
- Stop loss by pips : Here is stop loss by pips for your position.
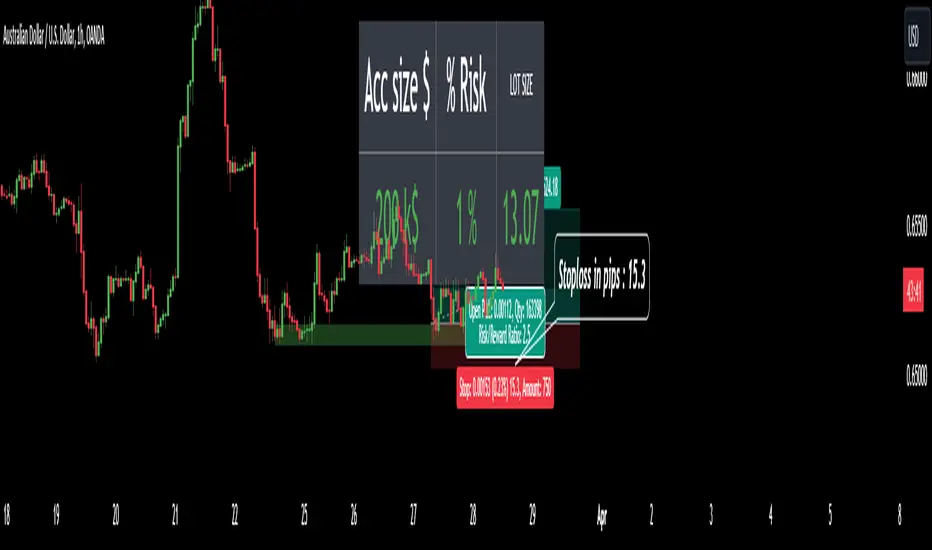
Explanation about stoploss by pips in Forex
Please help to refer to my chart above, that's a buying position in Tradingview. Tradingview measured all needed data in pips for you.
For example : My buying position on have chart having stop loss value is 15.3 pips.
I just need to input stoploss here as 15.3.
2. Display setting
Here is the place we will set the text size and location of table.
- Font size : The size of texts in this indicator. You can choose from tiny to Huge size
- Location : The position of indicator on chart. You can put it from bottom to top and left to right as your favorite
🔶 How to use indicator
After setting indicator, you need to input all data to Trading input group :
1. Your account balance
2. Acc risk %
3. Stop loss by pips
And then click to OK.
Indicator will calculate and give out LOT SIZE for you to entry.
It will remember your account balance and risk %, so you just need to input stop loss for your diffirence trades.
As chart above, I input my initial account as 200k$ and I normally take 1% risk for each position.
I want to buy at green box on chart above with SL is around 15.3 pips on AUDUSD.
Indicator helped to calculate lot size as 13.07 lot to trade.
I hope this indicator help you to trade and manage account better.
Smartmoneyconcepts
Smart Money Concepts [UAlgo]🔶 Description:
Smart Money Concepts (SMC) refer to a trading strategy that revolves around understanding and following the actions of institutional investors, such as banks and hedge funds, who are considered the “smart money” in the market. The concept is based on the idea that these institutions have more information and resources, and thus their market activities can indicate future market movements.
This script designed to be a tool that will automatically provide many features related to SMC concept for investors, offering a market structure analysis that includes the identification of order blocks, breaker blocks, and liquidity points. It also delineates premium and discount zones, highlights Fair Value Gaps (FVG), Volume Imbalance (VI) and Order Gap (OG) areas, providing users with a multifaceted view of market dynamics.
🔶 Key Features:
Market Structure Analysis : Simplifies the overview of market behavior, identifies market breakouts or trend continuation.
It detects the market structure as shown in the image below :
Order Blocks : Detects Order Blocks based on market structure analysis and volume characteristics. It draws these blocks and provides information such as volume.
Order Block Identification:
Breaker Blocks : Detects Breaker Blocks based on market structure analysis.
Breaker Block Identification:
When Order Block above is broken,
As you can see, it has now turned into a Bearish Breaker Block,
And it seems that the price is getting a reaction from this breaker block above.
Liquidity Sweeps : Tracks liquidity sweeps on both the buy and sell sides, offering traders a perspective on market momentum and potential shifts.
Multi-Timeframe Fair Value Gap (FVG), Volume Imbalance (VI), Order Gaps (OG) Detection : Detects Fair Value Gap (FVG), Volume Imbalance (VI) and Order Gaps (OG) based on different criteria such as price movements and volume characteristics. It marks these gaps/voids and provides visual cues for analysis.
Examle for FVG:
Premium & Discount Zone Analysis : Analyzes premium and discount zones, showing prices within these zones and highlighting equilibrium (0.5) levels.
Customizable Options : Provides various input parameters for customization, such as market structure length, sensitivity settings, display preferences, and mitigation methods.
Previous Key Levels : Identifies previous key levels include previous highs, lows, equilibrium points, and open prices across different timeframes such as daily, weekly, and monthly.
🔶 Disclaimer:
Use with Caution: This indicator is provided for educational and informational purposes only and should not be considered as financial advice. Users should exercise caution and perform their own analysis before making trading decisions based on the indicator's signals.
Not Financial Advice: The information provided by this indicator does not constitute financial advice, and the creator (UAlgo) shall not be held responsible for any trading losses incurred as a result of using this indicator.
Backtesting Recommended: Traders are encouraged to backtest the indicator thoroughly on historical data before using it in live trading to assess its performance and suitability for their trading strategies.
Risk Management: Trading involves inherent risks, and users should implement proper risk management strategies, including but not limited to stop-loss orders and position sizing, to mitigate potential losses.
No Guarantees: The accuracy and reliability of the indicator's signals cannot be guaranteed, as they are based on historical price data and past performance may not be indicative of future results.
Mental Health Monitoring🔶What it is ?
NCI_Mental Health is a reminder to help traders to manage psychology during analyzation.
This indicator calculates and displays your analyzation time and give you alert about your current mental status to continue analyzing or close chart to avoid being manipulated my market.
Our purpose is, keep your mind always "Empty" during analyzation. Counting opening chart will help you to control analyzation time and empty your mind better.
🔶 Who can use it ?
1. All traders who are using NCI, ICT , MACD system and other systems...
2. All traders who are trading on any timeframe
3. All traders who are trading on any market like stock, crypto, forex, gold, indices...
4. All traders who are new or experienced traders
5. All traders who are swing or scalping traders
🔶 The purpose of indicator
This indicator will give you alert and information about your mental health to know :
1. When you need to stop analyzation
2. When you can continue analyzing chart without any worries
3. Choosing your best emotion period to analyze to give out the best decision
4. Always "Empty your mind" during analyzation
🔶 How will indicator appear on chart
After you added it on chart, indicator will appear at your top right corner of chart. You can change it to Top-center as above chart by setting that I will guide you right on below.
In general, you can see two data :
1. Analyzation time : That's period that you used to analyze now by seconds and minutes
2. Metal status : Your mental status during analyzation
We will have 3 status as :
Good- You're on a very good status to start analyzing. This infomation will be shown as green color. We can remember color better than words so I added more color.
Normal - Your brain are on a normal status that you still continue analyzing.
This infomation will be shown as white color.
MANIPULATED - Your brain is very TIRED and you must close chart to take a rest.
This infomation will be shown as red color.
🔶 How to use indicator
You should focus on Metal status mostly with below guidance :
1. Good: You're on a nice status to give out the best decision. Normally, you should analyze a chart less than 3 minutes as default to always stay on the best status during analyzation.
2. Normal : It is better to prepare to take a rest. You can continue analyzing without any worries.
3. MANIPULATED : You will be manipulated by market easily to give out the wrong decisions.
You need to close chart now.
🔶 INPUT value
1. Minute : Analyzation time as minute value
2. Second : Analyzation time as second value
3. Your Alert message: A message to remind yourself if analyzation time is ended.
4. Font size : The size of texts in this indicator. You can choose from tiny to Huge size
5. Location : The position of indicator on chart. You can put it from bottom to top and left to right as your favorite.
🔶 Setting ALERT
If you prefer to receive a remind from Indicator than checking Mental status on indicator table
You can set alert by Tradingview with below steps :
1. Click to Alert on top middle of chart (tool bar)
2. At Condition, choose NCI mental health
3. Click to Create
Indicator will send you alert if your analyzation time now is over your Input value.
You should close chart and stop analyzation to avoid giving wrongly decision.
Warm regards,
Jayce

Inversion Fair Value Gap Screener | Flux Charts💎 GENERAL OVERVIEW
Introducing our new Inverse Fair Value Gap Screener! This screener can provide information about the latest Inverse Fair Value Gaps in up to 5 tickers. You can also customize the algorithm that finds the Inverse Fair Value Gaps and the styling of the screener.
Features of the new Inverse Fair Value Gap (IFVG) Screener :
Find Latest Inverse Fair Value Gaps Across 5 Tickers
Shows Their Information Of :
Latest Status
Number Of Retests
Consumption Percent
Volume
Customizable Algorithm / Styling
📌 HOW DOES IT WORK ?
A Fair Value Gap generally occur when there is an imbalance in the market. They can be detected by specific formations within the chart. An Inverse Fair Value Gap is when a FVG becomes invalidated, thus reversing the direction of the FVG.
IFVGs get consumed when a Close / Wick enters the IFVG zone. Check this example:
This screener then finds Fair Value Gaps across 5 different tickers, and shows the latest information about them.
Status ->
Far -> The current price is far away from the IFVG.
Approaching ⬆️/⬇️ -> The current price is approaching the IFVG, and the direction it's approaching from.
Inside -> The price is currently inside the IFVG.
Retests -> Retest means the price tried to invalidate the IFVG, but failed to do so. Here you can see how many times the price retested the IFVG.
Consumed -> IFVGs get consumed when a Close / Wick enters the IFVG zone. For example, if the price hits the middle of the IFVG zone, the zone is considered 50% consumed.
Volume -> Volume of a IFVG is essentially the volume of the bar that broke the original FVG that formed it.
🚩UNIQUENESS
This screener can detect latest Inverse Fair Value Gaps and give information about them for up to 5 tickers. This saves the user time by showing them all in a dashboard at the same time. The screener also uniquely shows information about the number of retests and the consumed percent of the IFVG, as well as it's volume. We believe that this extra information will help you spot reliable IFVGs easier.
⚙️SETTINGS
1. Tickers
You can set up to 5 tickers for the screener to scan Fair Value Gaps here. You can also enable / disable them and set their individual timeframes.
2. General Configuration
FVG Zone Invalidation -> Select between Wick & Close price for FVG Zone Invalidation.
IFVG Zone Invalidation -> Select between Wick & Close price for IFVG Zone Invalidation. This setting also switches the type for IFVG consumption.
Zone Filtering -> With "Average Range" selected, algorithm will find FVG zones in comparison with average range of last bars in the chart. With the "Volume Threshold" option, you may select a Volume Threshold % to spot FVGs with a larger total volume than average.
FVG Detection -> With the "Same Type" option, all 3 bars that formed the FVG should be the same type. (Bullish / Bearish). If the "All" option is selected, bar types may vary between Bullish / Bearish.
Detection Sensitivity -> You may select between Low, Normal or High FVG detection sensitivity. This will essentially determine the size of the spotted FVGs, with lower sensitivities resulting in spotting bigger FVGs, and higher sensitivities resulting in spotting all sizes of FVGs.

Market Structures Screener | Flux Charts💎 GENERAL OVERVIEW
Introducing our new Market Structures Screener! This screener can provide information about the latest market structures in up to 5 tickers. You can also customize the styling of the screener.
Features of the new Market Structures Screener :
Find Latest Market Structures Across 5 Tickers
Break Of Structure (BOS)
Change of Character (CHoCH)
Change of Character+ (CHoCH+)
Customizable Algoritm / Styling
📌 HOW DOES IT WORK ?
Sometimes specific market structures form and break as the market fills buy & sell orders. Formed Change of Character (CHoCH) and Break of Structure (BOS) often mean that market will change direction, and they can be spotted by inspecting low & high pivot points of the chart.
This screener then finds market structures across 5 different tickers, and shows the latest information about them.
🚩UNIQUENESS
Formed market structures can be strong hints about the current direction and the state of the market, and our screener has the ability to detect Change Of Character structures of the market with higher sensitivity (CHoCH+), so you will miss less hints. This screener will then show the elapsed time of the found BOS, CHoCH and CHoCH+ structures.
⚙️SETTINGS
1. Tickers
You can set up to 5 tickers for the screener to scan market structures here. You can also enable / disable them and set their individual timeframes.

[AlbaTherium] MTF Internal Ranges Analysis - IRA-Phoenix for SMCIntroduction:
The MTF Internal Ranges Analysis - IRA - Phoenix acts as an extension to the original main SMC Indicator by AlbaTherium . This add-on provides insights into multi-timeframe internal structure points, swing structure points, POIs (Points of Interest), and order blocks (OB). By integrating this enhancement, your multi-timeframe analyses become more streamlined, expediting the process and minimizing chart workload .
This tool represents an advanced smart money technical analysis aimed at enhancing your trading experience. It introduces four pivotal concepts:
Main Features:
Multiple Timeframes and Confluences,
SCOB Internal Order Block.
Demand to Supply (D2S) or Supply to Demand (S2D) across Multiple timeframes
SCOB on LTF and SCM on HTF across same Candle
By combining these concepts all in one, traders can find confluences zones across multiple timeframes and gain a comprehensive understanding of market dynamics, theses confluences zones empower order block skills and potentiality, showcasing them as essential, crucial, powerful, strategic, and pivotal, one of the pillars in smart money concepts trading strategy to make more informed decisions.
Settings Overview:
Select timeframe {Select or current chart}
Inside bar ranges
Internal structure as Internal zigzag {turn on/ off / unconfirmed(live) zigzag}
Single Candle Mitigation Pattern {turn on/ off / confirmed / unconfirmed}
Single Candle Order Block Pattern {turn on/ off / confirmed / unconfirmed}
Demands and Supplies (D&S) {turn on/ off / confirmed / unconfirmed}
OB Mitigation {touch/ extended}
Understanding the Features:
Chapter 1: Multiple Timeframes and Confluences
Our Multi-timeframe analysis approach enables traders to analyze market trends and volatility across different timeframes. Confluences, where signals align across multiple timeframes, provide strong indications for trading opportunities.
Practical Example:
- With MTF IRA - Phoenix , traders can seamlessly transition between different timeframes while maintaining a cohesive analysis. For instance, traders can monitor the M15, H1, or M5 charts while focusing on entry on the M1 timeframe, enabling a holistic view of market trends and opportunities .
Chapter 2: SCOB Internal Order Block across Multiple Timeframe
SCOB Internal Order Block (SCOB IOB) highlights critical zones in price action, showcasing the dominance of aggressive buyers or sellers on orders blocks. As confluences accumulate across multiple timeframes, the strength of the order block intensifies, presenting entry opportunities.
Practical Example:
You have the ability to detect zones where price ranges have formed; these areas are highly sought after for taking buying as well as selling positions, especially when these areas are reflected across 1 or 3 timeframes.
The only practical way to see theses confluences is to use this Indicator, see the example below
Chapter 03: Demand to Supply (D2S) or Supply to Demand (S2D) across Multiple timeframes
The Demand to Supply or Supply to Demand feature within MTF Internal Ranges Analysis - IRA - Phoenix offers a nuanced analysis of price action dynamics across various timeframes. By identifying shifts in supply and demand zones, traders gain valuable insights into market sentiment and potential price reversals.
This feature enables traders to anticipate changes in market direction by recognizing the interplay between demand and supply across different timeframes. By understanding how price reacts at key support and resistance levels, traders can make informed decisions and capitalize on emerging trends.
The Demand to Supply or Supply to Demand feature enhances the indicator's usefulness by providing traders with actionable information to navigate complex market conditions effectively. With this comprehensive analysis, traders can better manage risk and optimize trading strategies across multiple timeframes.
Real-world Example:
Chapter 04: SCOB on LTF and SCM on HTF across same Candle
with MTF Internal Ranges Analysis - IRA - Phoenix , explores the concepts of SCOB (Single Candle Order Block) on Lower Timeframes (LTF) and SCM (Single Candle Mitigation) on Higher Timeframes (HTF).
SCOB on LTF refers to the identification and analysis of single candle order blocks within shorter timeframes. These blocks represent critical price levels where significant buying or selling activity occurred within a single candlestick. By recognizing SCOB patterns, traders can pinpoint key areas of market interest and anticipate potential price movements.
On the other hand, SCM on HTF involves analyzing single candle mitigation entries within longer timeframes. This technique aims to capitalize on price reversals or shifts in market sentiment indicated by single candlestick patterns. By incorporating SCM analysis, traders can gain insights into broader market trends and make strategic trading decisions accordingly.
the intricacies of SCOB on LTF and SCM on HTF, offering traders valuable tools to enhance their analysis and decision-making processes across different timeframes. Through a comprehensive understanding of these concepts, traders can identify high-probability trading opportunities and navigate the markets with confidence.
Real-world Example:
SCOB on M5 and SCM on M15 generate a powerful order block.
Conclusion:
MTF Internal Ranges Analysis - IRA - Phoenix for Smart Money Concepts is a valuable asset for traders seeking to add more insights in today's dynamic markets especially for Intraday Traders. By focusing on concepts like "Multiple timeframes and Confluences, with one single timeframe u can analyze all timeframes", "SCOB Internal Order Block. With its innovative features and user-friendly interface, whether you're a seasoned trader or just starting your journey, MTF IRA - Phoenix can help you navigate through the complexities of price action and make more informed trading choices.
This document provides an extensive overview of MTF Internal Ranges Analysis - IRA - Phoenix, emphasizing its importance in comprehending market dynamics and utilizing essential smart money concepts trading principles.

ICT Killzones Toolkit [LuxAlgo]The ICT Killzones Toolkit is a comprehensive set of tools designed to assist traders in identifying key trading zones and patterns within the market.
The ICT Killzones Toolkit includes the following Price Action components:
ICT Killzones with Pivot Highs/Lows
Order Blocks
Breaker Blocks
Fair Value Gaps
Market Structure Shifts
By combining these components, the ICT Killzones Toolkit provides traders with a comprehensive framework for analyzing the market and identifying setups of interest. Leveraging these tools effectively can enhance traders' decision-making process and improve killzones interpretability.
🔶 USAGE
In forex/futures trading, timing is crucial. ICT Killzone are specific periods when there's a higher chance of finding setups of interest. Mastering these time intervals can offer significant advantages to traders who know how to use them effectively.
The image above highlights a potential setup of interest when using the ICT Killzones Toolkit.
As another example for utilizing the ICT Killzones Toolkit, we can see in the image above when price retests setups generated from killzones such as Order Blocks or Fair Value Gaps, a potential strategy could be to look for entries on those & take profits as the next killzone appears.
🔹 Order Blocks
Order Blocks are sections on a price chart where notable buying or selling activity has occured, often signaling interest zones for institutional traders. This toolkit's Order Blocks component pinpoints these areas within the Killzone, which may act as potential support or resistance levels.
🔹 Breaker Blocks
Breaker Blocks are zones built from mitigated order blocks, and highlight zones on the chart where price has previously stalled or reversed. These areas may act as significant barriers to price movement in the future, and the Breaker Blocks component helps traders identify them for potential trading opportunities.
🔹 Fair Value Gaps
Fair value gaps are especially favored by price action traders and arise from market inefficiencies or imbalances, typically when buying and selling are unequal. These gaps often attract price movement before resuming in the same direction. the Fair Value Gaps component of the toolkit helps traders identify and analyze them.
🔹 Market Structure Shifts
Market Structure Shifts refer to significant changes in the overall structure of the market, such as shifts in trend direction, volatility, or trading activity. These shifts can provide valuable insights into market sentiment and potential trading opportunities, and the Market Structure Shifts component helps traders identify and interpret them.
Overall, the ICT Killzone Toolkit combines these components to provide traders with a comprehensive framework for analyzing the markets and identifying high-probability trading setups.
🔶 SETTINGS
🔹 ICT Killzones
Asian, London Open, New York, and London Close: toggles the visibility of specific Killzones, allowing users to customize time periods and Killzone colors.
Killzone Lines : Top/Bottom, Mean and Extend Top/Bottom: toggles the visibility of the Killzone's pivot high and low lines, mean (average) line, and allows users to extend the pivot lines.
Killzone Labels: Toggles the visibility of the Killzone labels.
Display Killzones within Timeframes Up To: Toggles the visibility of the Killzones up to selected Timeframes.
Open Price, Separator, Label, and Color: toggles the visibility of the open price of the Killzones or for the day, week, or month. If the day, week, or month is selected, a separator will be displayed to highlight the beginning of each respective period. Additionally, users can customize the color and toggle the label as needed.
🔹 Order Blocks & Breaker Blocks
Order Blocks | Breaker Blocks: toggles the visibility of the order blocks & breaker blocks.
Swing Detection Length: lookback period used for the detection of the swing points used to create order blocks & breaker blocks.
Mitigation Price: allows users to select between closing price or wick of the candle.
Use Candle Body in Detection: allows users to use candle bodies as order block areas instead of the full candle range.
Remove Mitigated Order Blocks & Breaker Blocks: toggles the visibility of the mitigated order blocks & breaker blocks.
Extend Order Blocks & Breaker Blocks: enables processing of the order blocks & breaker blocks beyond the boundaries of the killzones.
Display Order Blocks & Breaker Blocks: enables the display of the first, last, or all occurrences of the order blocks & breaker blocks.
Order Blocks : Bullish, Bearish Color: color customization option for order blocks.
Breaker Blocks : Bullish, Bearish Color: color customization option for breaker blocks.
Show Order Blocks & Breaker Blocks Text: toggles the visibility of the order blocks & breaker blocks labels.
🔹 Market Structure Shifts
Market Structure Shifts: toggles the visibility of the market structure shifts.
Detection Length: market structure shift detection length.
Display Market Structure Shifts: enables the display of the first, last, or all occurrences of the market structure shifts.
Market Structure Shifts : Bullish, Bearish Color: color custumization option for market structure shifts.
Show Market Structure Shifts Text: toggles the visibility of the market structure shifts labels.
🔹 Fair Value Gaps
Fair Value Gaps: toggles the visibility of the fair value gaps.
Fair Value Gap Width Filter: filtering threshold wile detecting fair value gaps.
Remove Mitigated Fair Value Gaps: removes mitigated fair value gaps.
Extend Fair Value Gaps: enables processing of the fair value gaps beyond the boundaries of the killzones.
Display Fair Value Gaps: enables the display of the first, last, or all occurrences of the fair value gaps.
Bullish Imbalance Color: color customization option.
Bearish Imbalance Color: color customization option.
Show Fair Value Gaps Text: toggles the visibility of the fair value gaps labels.
🔶 RELATED SCRIPTS
Smart-Money-Concepts
Order-Blocks-Breaker-Blocks
Thanks to our community for recommending this script. For more conceptual scripts and related content, we welcome you to explore by visiting >>> LuxAlgo-Scripts .

Order Blocks Screener | Flux Charts💎 GENERAL OVERVIEW
Introducing our new Order Blocks Screener! This screener can provide information about the latest order blocks in up to 5 tickers. You can also customize the algorithm that finds the order blocks and the styling of the screener.
Features of the new Order Blocks Screener :
Find Latest Order Blocks Accross 5 Tickers
Latest Status, Restests, Bullish & Bearish Volume
Customizable Algoritm / Styling
📌 HOW DOES IT WORK ?
Order blocks occur when there is a high amount of market orders exist on a price range. It is possible to find order blocks using specific formations on the chart.
The high & low volume of order blocks should be taken into consideration while determining their strengths. The determination of the high & low volume of order blocks are similar to FVGs, in a bullish order block, the high volume is the last 2 bars' total volume, while the low volume is the oldest bar's volume. In a bearish order block scenerio, the low volume becomes the last 2 bars' total volume.
This screener then finds order blocks accross 5 different tickers, and shows the latest information about them.
Status ->
Far -> The current price is far away from the order block.
Approaching ⬆️/⬇️ -> The current price is approaching the order block, and the direction it's approaching from.
Inside -> The price is currently inside the order block.
Retests -> Retest means the price to invalidate the order block, but failed to do so. Here you can see how many times the price retested the order block.
For the bullish / bearish volume, check the "How Does It Work" section.
🚩UNIQUENESS
This screener can detect latest order blocks and give information about them for up to 5 tickers. This saves the user time by showing them all in a dashboard at the same time. The screener shows the number of the retests of the order block as an unique trait. Another unique ability of the screener is that it shows the latest valid order block's bullish and bearish volume in the dashboard.
⚙️SETTINGS
1. Tickers
You can set up to 5 tickers for the screener to scan order blocks here. You can also enable / disable them and set their individual timeframes.
2. General Configuration
Zone Invalidation -> Select between Wick & Close price for Order Block Invalidation.
Swing Length -> Swing length is used when finding order block formations. Smaller values will result in finding smaller order blocks.

TradesAI - Elite (Premium)This is an all-inclusive, premium indicator that focuses mainly on price action analysis, a form of looking at raw price data and market structure to analyze and capture areas of interest where price could react.
This indicator is a perfect trading companion that saves you a lot of time in trading price action. Some of the popular methods that use price action analysis are "Smart Money Concepts (SMC)", "Inner Circle Trader (ICT)", and "Institutional Trading".
🔶 POWERFUL TOOLS
The indicator combines three main tools as a trading suite:
Trendlines
Market Structure Breakouts (MSB)
Order Blocks (OBs) and Reversal Order Blocks (ROBs)
These 3 main tools are interconnected together. Below we go over each, and then explain how and why they are brought in together. Please also note that the indicator's settings have tooltips next to most of them, with more detailed information.
🔶 TRENDLINES
This indicator automatically draws the most relevant Trendlines from pivot high/pivot low (based on the defined settings) as origins, while keeping track of candle closes across these Trendlines to adjust or invalidate accordingly.
The indicator will draw all possible Trendlines up to the maximum allowed by TradingView's PineScript. It uses a bullish pivot high candle to draw downtrends, and a bearish pivot low candle to draw uptrends. The algorithm will draw the most suitable active Trendlines from those origin points.
The indicator takes the origin point as the first point of the Trendline, then starts looking for the immediate next same-type candle (bullish to bullish or bearish to bearish), to draw the Trendline between the origin candle and this newer candle.
An uptrend is a ray connecting two bearish candles, as long as the second candle has a Low higher than the low of the origin (first) candle. A downtrend is a ray connecting two bullish candles, as long as the second candle has a high lower than the high of the origin (first) candle.
Upon drawing, the indicator then starts monitoring and adjusting this Trendline, by keeping the origin always the same but changing the second point. The goal is to keep reducing the slope of the Trendline till it is at 0 degrees (horizontal line). That then makes the Trendline "final". Note that you have the option to keep all Trendlines or just show the final, in the settings.
So, the algorithm has three states for the Trendlines:
Initial: not tested, meaning price hasn't yet broken through it and closed a candle beyond it, to cause a re-adjustment of this Trendline.
Broken: a candle hard closed (opened and closed) across it but still, the direction of the trend is maintained with a new Trendline from the same origin – could be replaced (or kept on the chart as a "backside", which is what we call a broken Trendline to be tested from the opposite side) with a new Trendline from the same origin, to the newest candle that caused the break to happen, as then it becomes the new second point of that Trendline.
Final: a candle hard closed (opened and closed) across it and can't draw a new Trendline from the same origin maintaining the direction of the trend (so an uptrend becomes a downtrend or a downtrend becomes an uptrend at this point, which is not allowed). This marks the end of the Trendline adjustment for that origin.
To summarize the Trendlines algorithm, imagine starting from a candle and drawing the Trendline, then keep re-adjusting it to make its slope less and less, till it becomes a horizontal line. That's the final state.
Here is a step-by-step scenario to demonstrate the algorithm:
Notice how first an Uptrend (green ray) is drawn between point A origin pivot (picked by our smart algorithm) and point B, both marked by green arrows:
Uptrend then turned into backside (where it flips from diagonal support to resistance where liquidity potentially resides):
Then a new uptrend is drawn from the same point A origin pivot to a new point B matching the filters in settings.
Finally, it turns also into a backside and is considered final because no more uptrends could be drawn from the same point A origin point.
Unlike traditional Trendline tools, this indicator takes into account numerous rules for each candlestick to determine valid support and resistance levels, which act as liquidity zones.
Unlike conventional Trendline tools, this indicator allows the user to define the pivot point left and right length to capture the proper ones as origins, then automatically recognizes and extends lines from them as liquidity zones where a reaction is expected. Moreover, the indicator monitors those Trendlines in real-time to switch them from buying to selling zones, and vice-versa, as the price structure changes.
Features
Log vs. Linear scale switch to show different Trendlines accordingly. When updating the Trendlines, or deciding whether Touches/Hard Closes are met, it makes a difference.
Ability to show all forms of Trendlines, final Trendlines or just backside Trendlines.
Why is it used?
For experienced traders, it offers the advantage of time efficiency, while new traders can bypass the steep learning curve of drawing Trendlines manually, which could practically be drawn between any two candlesticks on the chart (many variations).
🔶 MARKET STRUCTURE BREAKOUT (MSB)
The Market Structure Breakouts (MSB) tool is a trading tool that detects specific patterns on trading charts and provides ‘take profit’ regions based on the extended direction of the identified pattern. A breakout is a potential trading opportunity that presents itself when an asset's price moves away from a zone of accumulation (i.e. above a resistance level or below a support level) on increasing volume. The most famous form of market structure breakout is double/triple tops/bottoms, or what is referred to as W or M breakouts.
See this example below of how our MSB smart algorithm picked the local bottom of INDEX:BTCUSD
Here is a step-by-step scenario to demonstrate the algorithm:
First, the algorithm picks the pivot points according to our Machine Learning (ML) model, which uses Average True Range (ATR) and Moving Averages of various types to decide. It will then signal a Market Structure Breakout (MSB):
You may either short (sell) this MSB towards the targets (dotted green lines) and/or buy (long) at the targets (dotted green lines). Usually, these targets provide scalp moves, according to our model, but they may also act as strong reversal points on the chart.
Unlike standard indicators, the MSB tool identifies patterns that may not appear in every time frame due to specific conditions that need to be met, including Average True Range (ATR) and Moving Averages at the time of creation. Once these patterns are identified, the tool gives ‘take profit’ regions in the direction of the trading pattern and even allows for trading in the opposite direction (contrarian/counter-trend scalps) once those regions are reached. A confirmed breakout has the potential to drive the price to these specific targets, calculated based on our Machine Learning (ML) model. The Targets are the measured moves placed from the breakout point.
Features
Log vs. Linear scale switch to show different MSBs accordingly based on the ratios.
Detects trading patterns with specific conditions.
Ability to specify how sensitive the pivot points are for capturing market structure breakouts.
Provides take profit regions in the extended direction of the pattern.
Allows for versatile trading styles by permitting trades in the opposite direction (contrarian or counter-trend) once the take profit region is reached.
Highlights 2 levels of interest for potential trade initiation (or as targets of the MSB move).
🔶 ORDER BLOCK (OB) and REVERSAL ORDER BLOCK (ROB)
Before diving deeper into OBs and ROBs, you may consider the following chart for a general understanding of price ladders, and how they break. This is a bearish price ladder leaving Lower Lows and Lower Highs after an initial Low and High (L->H->LL->LH). Bullish ladders are the opposite (H->L->HH->HL).
In this bearish ladder case, notice the numbers representing the highs made (being lower). While this is a clean structure, markets don't always create such clean ladders, but you may switch to a higher timeframe to see it in a clearer form (usually, you will be able to spot it there).
In SMC or ICT concepts, the "Break Of Structure (BOS)" is pretty much creating a new lower low (LL) for the bearish ladder (and the creation of a higher high (HH) for the bullish ladder). By doing so, markets are grabbing liquidity below these levels and could either continue the ladder or stop/flip it. This gives you the context of how the ladder prints.
Price usually ends the ladder with a "Change of Character (CHoCH)", which represents a BOS (to grab liquidity) followed by an aggressive move in the opposite direction, which could lead the market to close the gaps and balance out. It is considered a good practice to then target liquidity in the opposite direction when a CHoCH happens, meaning for a bearish ladder you may target the pivots marked by 3, 2 and 1 at the top (start of the ladder).
Now we move to Order Blocks (OBs) and Reversal Order Blocks (ROBs). Think of them as sniper zones or micro ladders inside the bigger ladder/structure.
Order Blocks are usually used as zones of support and resistance on a trading chart where liquidity is present, or what some traders call "potential institutional interest zones". Order Blocks can be observed at the beginning of these strong moves of BOS or the CHoCH, leaving behind a zone (one or more candles) to be revisited later to balance the market. Therefore, these are interesting levels to place Limit/Market orders (sell the peaks or buy the valleys) instead of doing so at the swing highs or swing lows of the ladder (where BOS or CHoCH happened). The idea here is that the price could go deep into the ladder's step (peak or valley), and by doing so, it usually goes to these zones.
A bullish Order Block (Valley-OB) is the last bearish candle of a downtrend before a sequence of bullish candles (thus forming a "Valley"). A bearish Order Block (Peak-OB) is the last bullish candle of an uptrend before a sequence of bearish candles (thus forming a "Peak"). Our indicator captures the full range zones of the OB meaning not only the last candle but the sequence of same-type candles immediately next to it, which creates a zone, thus the name "OB/ROB Zone". Not only does the tool mark those levels on the chart, but it also has a smart tracking algorithm to remove the appropriate levels dynamically. It will monitor, candle by candle, what is happening to all the OBs/ROBs, and update them according to how they are being tested/visited (eg. weak testing being a touch, and strong testing being a touch of the same colour candle).
Bullish Valley-OB:
Bearish Peak-OB:
The indicator follows our concept of "Zone Activation" to determine whether to mark zones with dashed or solid lines.
If we take a bearish Peak-OB as an example, notice how it first gets drawn with a dashed red line (as the algorithm monitors how far the price moved away from the zone):
As price moves away (distance based on our Machin Learning (ML) model), it turns into solid lines:
Some people prefer to enter market orders or limit (pending) orders close to the zone, while others wait for it to hit. You may wait for these zones to turn into solid lines (meaning that the price made a decent move away from it before revisiting it). It depends on your trading strategy.
When Order Block (OB) zones break instead of holding the ladder, they turn into what we call Reversal Order Blocks (ROB); our algorithm of flipping these zones where price could react from the other side of the OB. Our algorithm monitor and highlight the most suitable ones to trade, based on +30 conditions and variables by our Machine Learning (ML) models. Examples of ROBs in the SMC or ICT trading community are a "Breaker Block", a "Mitigation Block" or a "Unicorn Setup". However, our algorithm filters the zones based on many factors such as ratios of price movement before, inside and after these zones, along with many other factors.
The algorithm monitors the ratios of how price moved into and away from the OB/ROB, as well as the type of move happening, to then filter the ones that are considered of high probability to break/not do a reaction.
A bullish Valley-OB (green) turns into a bearish Valley-ROB (neon red) where you may short (sell), while a bearish Peak-OB (red) turns into a bullish Peak-ROB (neon green) where you may long (buy).
Example of a bullish Valley-OB that turned into a bearish Valley-ROB:
Features
Log vs. Linear scale switch to show OBs/ROBs accordingly based on the ratios and the price action around these zones (before and after creation).
Uses our Machine Learning (ML) model to determine relevant Order Blocks (OBs) to show or hide based on price action.
Considers distribution and accumulation candles to find relevant Order Blocks.
Various types of triggers to mark those Order Blocks and their zones: breakout, close, hard close (open and close) or full close (low, high, open and close).
Monitors the 1:1 expansion of price from key areas of interest, which would change the importance of the zones through our concept of “Zone Activation”.
Allows for customization in the settings to display different types of Order Blocks (e.g., tested or untested).
Marking and invalidating levels based on many variables, including single or multiple candle zones, touching/closing beyond specific levels, weak/strong testing criteria, price tolerance % (near a level), and many more.
Provides color-coded visual representation for easier interpretation.
Why is it used?
Order Blocks (OB) and Reversal Order Blocks (ROB) represent the building blocks of price ladders, in conjunction with Swing Highs and Swing Lows. By identifying where liquidity is potentially present, they become common targets for big market players. Additionally, they provide clear invalidation points based on various types of candle closes, such as hard closes or simply a candle close.
One strategy that could be used is to open positions at these OB or ROB Levels as long as the chart maintains the trend (ladder), for a potentially higher win rate (or against it for a quick scalp). Be mindful of the breaking of a ladder or the building of a new one. A ladder breaks with a hard close (open and close) of a candle across the closest two levels; a ladder builds by not breaking back down across the levels it has tested. By definition, strong ladders will have a few untested levels and come back to wick them but still retain the structure of the laddering direction (trending with Lower Lows + Lower Highs or Higher Lows + Higher Highs).
🔶 COMBINING ALL TOOLS
In summary, Trendlines could be great tools to give you a general context of whether the price is laddering up or down. Once you spot the ladder, your goal is to either trade in its direction (not to go against the trend) or to counter-trend trade (contrarian). To do so, you could use the MSB tool to spot these BOS/CHoCH. And to give you more precise entries, you may rely on the OB/ROB zones which usually mesh over the ladder, to provide a sniper entry!
🔶 RISK DISCLAIMER
Trading is risky, and most day traders lose money. The risk of loss in trading can be substantial. Decisions to buy, sell, hold or trade in securities, commodities and other investments involve risk and are best made based on the advice of qualified financial professionals. Past performance does not guarantee future results. All content is to be considered hypothetical, selected after the fact, in order to demonstrate our product and should not be construed as financial advice. You should therefore carefully consider whether such trading is suitable for you in light of your financial condition.

Market Structure with Inducements & Sweeps [LuxAlgo]The Market Structure with Inducements & Sweeps indicator is a unique take on Smart Money Concepts related market structure labels that aims to give traders a more precise interpretation considering various factors.
Compared to traditional market structure scripts that include Change of Character (CHoCH) & Break of Structures (BOS) -- this script also includes the detection of Inducements (IDM) & Sweeps which are major components of determining other structures labeled on the chart.
SMC & price action traders have historically considered this a more accurate representation of market structure by including these components.
🔶 USAGE
Below we can see a diagram for how market structure is displayed within the Market Structure with Inducements & Liquidity indicator.
Change of Characters (CHoCH) are based on swing points detection, while Break of Structures (BOS) are based on trailing maximum & minimums from the detected Change of Characters. We do this for a more dynamic & timely display of market structure.
🔹 Inducements (IDM)
Traders that consider inducements as a part of their analysis of Change of Characters & Break of Structures can more easily avoid fakeouts within trends as shown below.
In this script IDM's are always required between each market structures.
🔹 Sweeps of Liquidity (x)
SMC traders looking to properly analyze market structure need to look for sweeps of liquidity to ensure levels that are wicked are noted as sweeps, while levels that are fully closed above / below are labeled as confirmed market structures.
In the chart below we can see a Sweep of Liquidity which typically can occur on the longer term price action and indicate a potential reversal.
Notably, since labels such as CHoCH or BOS's can occur at the same level as a Sweep of liquidity, we have allowed the indicator to display the market structure label at the current bar in the event this happens.
The Sweeps of Liquidity are also based on trailing maximum / minimum, which allows for a continuous evaluation of areas for liquidity sweeps to occur.
This can be helpful for traders looking for longer term & shorter term sweeps.
🔶 SETTINGS
CHoCH Detection Period: Detection period for CHoCH's, higher values will return longer term CHoCH's.
IDM Detection Period: Detection period for IDM's, higher values will return longer term IDM's.
Thank you all for 500k followers on TradingView! Enjoy!

Fibonacci Inversion Fair Value Gaps | Flux Charts💎 GENERAL OVERVIEW
Introducing our new Fibonacci Inversion Fair Value Gaps (IFVG) indicator! Inverse Fair Value Gaps occur when a Fair Value Gap becomes invalidated. They reverse the role of the original Fair Value Gap, making a bullish zone bearish and vice versa. This indicator plots the Fibonacci retracement levels of the IFVG, which often act like support & resistance levels.
Features of the new Fibonacci IFVGs Indicator :
Renders Bullish / Bearish IFVG Zones
Renders Fibonacci Retracement Levels Of IFVGs
Combination Of Overlapping FVG Zones
Variety Of Zone Detection / Sensitivity / Filtering / Invalidation Settings
High Customizability
🚩UNIQUENESS
This indicator stands out with its ability to render up to 3 Fibonacci retracement levels of IFVGs. Fibonacci retracement levels are widely used within trading, and we wanted to implement them for IFVG zones. You can also customize the FVG Filtering method, FVG & IFVG Zone Invalidation, Detection Sensitivity etc. according to your needs to get the best performance from the indicator.
📌 HOW DOES IT WORK ?
A Fair Value Gap generally occur when there is an imbalance in the market. They can be detected by specific formations within the chart. An Inverse Fair Value Gap is when a FVG becomes invalidated, thus reversing the direction of the FVG.
This indicator renders 0.618, 0.5 and 0.382 (can be changed from the settings) Fibonacci retracement levels of the IFVGs, which often act as support and resistances. Check this example :
⚙️SETTINGS
1. General Configuration
FVG Zone Invalidation -> Select between Wick & Close price for FVG Zone Invalidation.
IFVG Zone Invalidation -> Select between Wick & Close price for IFVG Zone Invalidation. This setting also switches the type for IFVG consumption.
Zone Filtering -> With "Average Range" selected, algorithm will find FVG zones in comparison with average range of last bars in the chart. With the "Volume Threshold" option, you may select a Volume Threshold % to spot FVGs with a larger total volume than average.
FVG Detection -> With the "Same Type" option, all 3 bars that formed the FVG should be the same type. (Bullish / Bearish). If the "All" option is selected, bar types may vary between Bullish / Bearish.
Detection Sensitivity -> You may select between Low, Normal or High FVG detection sensitivity. This will essentially determine the size of the spotted FVGs, with lower sensitivies resulting in spotting bigger FVGs, and higher sensitivies resulting in spotting all sizes of FVGs.
Show Historic Zones -> If this option is on, the indicator will render invalidated IFVG zones as well as current IFVG zones. For a cleaner look at current IFVG zones which are not invalidated yet, you can turn this option off.
2. Fibonacci Retracement Levels
You can enable / disable up to 3 different Fibonnaci Retracement levels at this group of settings. You can also switch their line styles between solid, dashed and dotted as well as changing their colors.

Price Action Toolkit | Flux Charts💎 GENERAL OVERVIEW
Introducing our new Price Action Toolkit indicator! Price Action Toolkit integrates key level strategy , traditional supply-demand analysis , and market structures to help traders in their decisions. Now with features that are available to use in multiple timeframes!
Features of the new Price Action Toolkit indicator :
Volumized Fair Value Gaps (FVGs)
Volumized Order & Breaker Blocks
Identification of Market Structures
Equal Highs & Lows
Buyside & Sellside Liquidity
Premium & Discount Zones
MTF Highs & Lows (Daily, Weekly, Monthly, Pre-Market)
Customizable Settings
📌 HOW DOES IT WORK ?
We believe that the analytical elements that are within this indicator work best when they co-exist with each other on the chart. Trading often requires taking multiple elements into consideration for better accuracy on market analysis. Thus, we combined some of the useful strategies in one indicator for ease of use.
1. Volumized Fair Value Gaps
Fair value gaps often occur when there is an imbalance in the market, and can be spotted with a specific formation on the chart.
The volume when the FVG occurs plays an important role when determining the strength of it, so we've placed two bars on the FVG zone, indicating the high & low volumes of the FVG. The high volume is the total volume of the last two bars on a bullish FVG, while the low volume is - of the FVG. For a bearish FVG, the total volume of the last two bars is the low volume. The indicator can also detect FVGs that exist in other timeframes than the current chart.
2. Volumized Order Blocks
Order blocks occur when there is a high amount of market orders exist on a price range. It is possible to find order blocks using specific formations on the chart.
The high & low volume of order blocks should be taken into consideration while determining their strengths. The determination of the high & low volume of order blocks are similar to FVGs, in a bullish order block, the high volume is the last 2 bars' total volume, while the low volume is the oldest bar's volume. In a bearish order block scenerio, the low volume becomes the last 2 bars' total volume.
3. Volumized Breaker Blocks
Breaker blocks form when an order block fails, or "breaks". It is often associated with market going in the opposite direction of the broken order block, and they can be spotted by following order blocks and finding the point they get broken, ie. price goes below a bullish order block.
The volume of a breaker block is simply the total volume of the bar that the original order block is broken. Often the higher the breaking bar's volume, the stronger the breaker block is.
4. Market Structures
Sometimes specific market structures form and break as the market fills buy & sell orders. Formed Change of Character (CHoCH) and Break of Structure (BOS) often mean that market will change direction, and they can be spotted by inspecting low & high pivot points of the chart.
5. Equal Highs & Lows
Equal Highs & Lows occur when there is a significant amount of difference between a candle's close price and it's high / low value, and it happens again in a specific range. EQH and EQL usually mean there is a resistance that blocks the price from going further up / down.
6. Buyside & Sellside Liquidity
Buyside & Sellside Liquidity zones are where most traders place their take-profits and stop-losses in their long / short positions. They are spotted by using high & low pivot points on the chart.
7. Premium & Discount Zones
The premium zone is a zone that is over the fair value of the asset's price, and the discount zone is the opposite. They are formed by the latest high & low pivot points.
8. MTF Highs / Lows
MTF Highs / Lows are actually pretty self-explanatory, you can enable / disable Daily, Weekly, Monthly & Pre-Market Highs and Lows.
🚩UNIQUENESS
Our new indicator offers a comprehensive toolkit for traders, combining multiple analytical elements with customizable settings to aid in decision-making across different market conditions and timeframes. The volumetric information of both FVGs and Order & Breaker Blocks will be present in your chart to serve you greater detail about them. The indicator also efficiently identifies market structures, liquidity zones and premium & discount zones to give you an insight about the current state of the market. And finally with the use of multiple timeframes , you can easily take a look at the bigger picture. We recommend reading the "How Does It Work" section of the descripton to get a better understanding about how this indicator is unique to others.
⚙️SETTINGS
1. General Configuration
Show Historic Zones -> This will show historic Fair Value Gaps, Order & Breaker Blocks and Sellside & Buyside liquidities which are expired.
2. Fair Value Gaps
Enabled -> Enables / Disables Fair Value Gaps
Volumetric Info -> The volumetric information of the FVG Zones will be rendered if activated.
Zone Invalidation -> Select between Wick & Close price for FVG Zone Invalidation.
Zone Filtering -> With "Average Range" selected, algorithm will find FVG zones in comparison with average range of last bars in the chart. With the "Volume Threshold" option, you may select a Volume Threshold % to spot FVGs with a larger total volume than average.
FVG Detection -> With the "Same Type" option, all 3 bars that formed the FVG should be the same type. (Bullish / Bearish). If the "All" option is selected, bar types may vary between Bullish / Bearish.
Detection Sensitivity -> You may select between Low, Normal or High FVG detection sensitivity. This will essentially determine the size of the spotted FVGs, with lower sensitivies resulting in spotting bigger FVGs, and higher sensitivies resulting in spotting all sizes of FVGs.
3. Order Blocks
Enabled -> Enables / Disables Order Blocks
Volumetric Info -> The volumetric information of the Order Blocks will be rendered if activated.
Zone Invalidation -> Select between Wick & Close price for Order Block Invalidation.
Swing Length -> Swing length is used when finding order block formations. Smaller values will result in finding smaller order blocks.
4. Breaker Blocks
Enabled -> Enables / Disables Breaker Blocks
Volumetric Info -> The volumetric information of the Breaker Blocks will be rendered if activated.
Zone Invalidation -> Select between Wick & Close price for Breaker Block Invalidation.
5. Timeframes
You can set and enable / disable up to 3 timeframes. Note that only higher timeframes than the current chart will work.
6. Market Structures
Break Of Structure ( BOS ) -> If the current structure of the market is broken in a bullish or bearish direction, it will be displayed.
Change Of Character ( CHoCH ) -> If the market shifts into another direction, it will be displayed.
Change Of Character+ ( CHoCH+ ) -> This will display stronger Change Of Characters if enabled.
7. Equal Highs & Lows
EQH -> Enables / Disables Equal Highs.
EQL -> Enables / Disables Equal Lows.
ATR Multiplier (0.1 - 1.0) -> Determines the maximum difference between highs / lows to be considered as equal. Lower values will result in more accurate results.
8. Buyside & Sellside Liquidity
Zone Width -> Determines the width of the liquidity zones, 1 = 0.025%, 2 = 0.05%, 3 = 0.1%.
9. Premium & Discount Zones
Enabled -> Enables / Disables Premium & Discount Zones.
10. MTF Highs / Lows
You can enable / disable Daily, Weekly, Monthly & Pre-Market Highs and Lows using this setting. You can also switch their line shapes between solid, dashed and dotted.

True SMCThe True SMC Indicator is specifically designed for structure mapping and the identification of high-probability Order Blocks. Excelling in distinctly recognising four types of Order Blocks, it provides traders with a direct and efficient method to dissect market movements and identify strategic entry points with precision
🔶 Understanding Structure Mapping
This indicator introduces a unique approach to analysing market structure, focusing on liquidity, which is termed 'Inducement'. Inducement is crucial for identifying key structural markers in the market, such as Higher Highs (HH), Higher Lows (HL), Lower Lows (LL), and Lower Highs (LH).
Inducement acts like a trap set near a supply or demand zone. It entices impatient buyers or sellers into the market before the actual zone is reached, thereby creating liquidity. For an inducement to be considered valid, it must represent a valid pullback.
A valid scenario occurs when the price sweeps or closes beyond the high or low of the previous candle; in this case, the candle's color, whether bullish or bearish, is not relevant, and both scenarios are considered valid. Inside bars are ignored as they do not meet this criterion. The indicator assists in this process by automatically highlighting valid pullbacks with a distinctive gray round label.
This feature is not just a visual aid but also a crucial tool in effortlessly understanding market movements, providing a clear visual representation of ongoing market trends.
🔶 Understanding How Order Block is working
Our indicator incorporates four distinct types of Order Blocks, each designed for specific roles in market analysis. Among these, the **OB-IDM** and **OB-EXT** are regarded as high-probability Order Blocks, and our primary focus is on these two for market entry.
IDM Order Block (OB-IDM): IDM Order block (OB-IDM) is basically the first Order Block that shows up after the IDM level is passed. Think of it as the closest OB you find below the current IDM.
Extreme Order Block (OB-EXT): OB-EXT is the first and lowest Order Block that you'll find between a Major Low and a Major High.
Single Candle Order Block (SCOB): Single candle mitigation is very Powerful way to add multiple entries in you're winning trades.
Smart Money Trap (SMT): The SMT consists of all the Order Blocks that lie between the Extreme and OB-IDM. It acts as a cautionary signal, indicating potential traps for Smart Money Concept traders. It is essential to recognize that the SMT does not provide additional confirmation for trading. Instead, it highlights areas where traders should exercise extra caution. Trading decisions should be based on clear confirmations, such as inducements or liquidity sweeps, rather than solely on the SMT.
🔶 How to Use the True SMC Indicator:
The True SMC Indicator is designed to enhance your trading strategy by identifying key order blocks and market signals. Below is a guide on how to utilize the various elements of the True SMC Indicator:
OB IDM (Order Block Inducement):
Usage : This is a decisional order block crucial for identifying trade entries. It is particularly effective for pinpointing potential reversal zones.
Alerts: Setting up alerts on OB IDM is recommended to be notified when the price reaches this critical area, thus facilitating prompt and informed trading decisions.
OB-EXT (Extreme Order Block):
Usage : OB-EXT serves as an extreme and high-probability order block for trade entries, ideal for identifying strategic entry points at potential reversal points.
Alerts: Activating alerts on OB-EXT will keep you informed about price approaches, aiding in the preparation of your trade setups.
SCOB (Single Candle Order Block):
Usage : SCOB is ideal for scaling into a position. It should be employed for adding to positions when the market reacts to OB IDM or OB-EXT, indicating a potential reversal.
SMT (Smart Money Trap):
Usage Caution: The SMT should be approached with caution as it represents a potential trap. It is advised to avoid trading directly at SMT zones. Instead, use these zones to gauge market sentiment and make informed decisions.
This structured approach to using the True SMC Indicator will help you in making more precise and strategic trading decisions, enhancing your overall market analysis.
🔶 Example of usage:
Market Structure Diagram
This diagram illustrates the key structural markers in the market such as Higher Highs (HH), Higher Lows (HL), Lower Lows (LL), and Lower Highs (LH). It provides a visual guide to understanding the underlying market structure.
Example from a Real Chart: This chart is a prime example of how our indicator is used to dissect and highlight market structure in a live trading environment. It vividly demonstrates the 'Inducement' concept in action, pinpointing key structural points like HH, HL, LL, and LH in real-time market trends.
Valid Pullback
Illustration of a Valid Pullback: This image showcases a typical scenario where the price sweeps beyond the previous candle's high or low, marking a valid pullback. Notice the distinctive gray round label indicating the point of inducement.
IDM Order Block (OB-IDM)
This diagram illustrates the IDM Order Block (OB-IDM), highlighting its position as the first OB following the IDM level. It represents the nearest OB below the current IDM level.
IDM Order Block in Action This real chart example showcases the OB-IDM in a live market scenario, demonstrating how it appears and functions in practical trading.
Extreme Order Block (OB-EXT)
The diagram depicts the OB-EXT, which is identified as the first and lowest Order Block between a Major Low and a Major High.
OB-EXT in Real Market: This chart example highlights the OB-EXT, showing its position and significance in market analysis between major market points.
Single Candle Order Block (SCOB)
The accompanying chart demonstrates the SCOB in a live trading environment, illustrating its effectiveness in trade optimization.
Smart Money Trap (SMT)
This real chart provides insight into how the SMT is used in actual trading, marking areas for increased caution and illustrating its role in a comprehensive trading strategy.
🔶 Additional Features
Easy-to-Follow Trend Display : The script employs a Color Coded candle system, simplifying trend recognition.
Any Alert function call = It can be configured for a range of trading events, allowing you to stay informed about key market movements. In the settings, you can choose to enable or disable alerts for events such as BOS Sweep, CHock, CHock Sweep, IDM, IDM Sweep, OB IDM, OB EXT, and PDH/PDL.
Automatic resolving of ChoCh-IDM and IDM-BoS conflicts = The indicator is equipped to automatically resolve conflicts that arise between ChoCh-IDM and IDM-BoS. It intelligently identifies situations where there might be an IDM instead of a ChoCh, or a BoS instead of an IDM, ensuring accurate readings and analysis.
Anywhere Structure Mapping : The tool simplifies market analysis by enabling you to draw structures from any chosen moment. Simply adjust the slider to your desired point and instantly trade based on the internal structure revealed. This feature offers an intuitive and efficient way to understand and navigate market dynamics.
🔶 Conclusion
The True SMC Indicator distinguishes itself from other market analysis tools through its specialised focus on structure mapping and high-probability Order Blocks. Unlike generic indicators, it expertly identifies and categorizes four distinct types of Order Blocks, including IDM and Extreme Order Blocks, which are crucial for high-accuracy trade entries. Its unique approach in analysing market structure centers on 'Inducement,' a key concept for pinpointing vital market structural markers. This feature, combined with its ability to alert traders to both promising entry points and potential Smart Money Traps, equips users with a comprehensive tool for a nuanced understanding of market dynamics and strategic trade execution. Such targeted capabilities make the True SMC Indicator an invaluable asset for traders seeking precision and efficiency in their market analysis.

[AlbaTherium] OptiStruct™ Premium for Smart Money Concepts An Insight into Structure Mapping and Order Block Identification with Smart Money Concepts
Introduction:
Structure Mapping & Demands and Supplies Premium serves as a fundamental pillar in the realm of Smart Money Concepts . This indicator adeptly charts the market structure based on a refined version of SMC while identifying Order Blocks. All the concepts embedded in this method are meticulously defined, offering users the ability to chart the market structure with precision and heightened confidence. With this indicator, there is no need for excessive questioning of the accuracy of your markings; it diligently strives to perform this task effectively. There are no hidden 'magic' properties underlying this indicator, ensuring that our users can independently verify each and every feature. It is this commitment to transparency that sets us apart and makes us unique in the market.
In this discussion, we delve into the intricacies of Break of Structure, Change of Character , and SMART MONEY TRAP . We also introduce the concepts of Extreme Order Blocks, Decisional Order Blocks , and Smart Money Trap Order Blocks .
Chapter 1: Understanding Structure Mapping:
Let's begin with some definitions:
- Inside bars are candles that lie within the range of a preceding candle.
- Pullbacks occur in an uptrend when the low of a preceding candle's range (excluding inside bars ) is breached, and the price continues to rise.
- Inducements (IDM) are price levels defined as the low of the latest pullback before the most recent high. They often act as liquidity points that the market revisits before continuing its move.
Break of Structure (BoS):
In an uptrend, after surpassing an IDM , the most recent high becomes a Confirmed structure high, or a Major High . If the price then closes above this Major High, a Bullish Break of Structure (Bullish BoS) is confirmed. Similarly, the lowest point between these movements becomes a Confirmed structure low or Major Low in a downtrend.
Change of Character (ChoCh):
In an uptrend, if the price falls below a Major Low, it indicates a shift in market bias from Bullish to Bearish, or a Bearish Change of Character .
Example of a bullish ChoCh:
Chapter 2: The Significance of Order Blocks:
Order Blocks (OB) play a pivotal role in Smart Money Concepts during entry points. Understanding what they represent and how to identify them is essential. For a Bullish/Bearish Order Block to be confirmed, specific conditions, including price imbalance and breaching the previous candle's high or low, must be met. We will delve into the finer details of identifying and trading Order Blocks, with an emphasis on the fact that price often reacts from Decisional Order Blocks, Extreme Order Blocks , and Smart Money Trap Order Blocks .
An OB is the initial candle range of a pullback that creates a Fair value gap.
These are zones where proactive traders enter the market, resulting in significant price changes indicated by Fair value gaps. It is believed that when the price revisits these zones in the future, it tends to bounce back. This property makes Order Blocks excellent potential entry points.
Order Blocks are categorized as follows:
- Extreme OB : The first and lowest OB between the Major Low and Major High.
- Decisional OB : The most recent OB lower than the current IDM.
- Smart Money Traps : All OBs between Extreme and Decisional OB.
- Demand above IDM / Supply below IDM
Chapter 3: Understanding SMART MONEY TRAP (SMT):
SMART MONEY TRAP is a concept that brings clarity to the distinction between Structure and Order Blocks within Smart Money Concepts and is a unique feature of this indicator. While many Smart Money Traders base their trades on Structure and Order Blocks, it's crucial to recognize that Order Blocks serve as an additional confirmation for buy or sell decisions. Blindly trading based on Order Blocks is not advisable. Instead, traders should exercise patience and await other confirmations like inducement or Liquidity sweep before executing trades on Order Blocks. We will illustrate how this concept works in practice.
In the example above, the market made a high wick up, taking out the buy-side liquidity, then made a bearish ChoCh. We place our sell order on the order block above IDM. This presents a promising trading opportunity, with a stop loss placed above the OB and a take profit set at the low of previous structure.
Conclusion:
Structure Mapping & Demands and Supplies Premium as the epitome of Smart Money Concepts, presenting traders with a tool meticulously crafted for an exceptional user experience . This indicator integrates structural mapping and Order Blocks, providing not only a wealth of knowledge but a platform tailor-made for personalization to suit your unique style and preferences. By mastering the nuances of Impulsive Moves and Corrections, and expertly identifying and trading Order Blocks while considering the SMART MONEY TRAP, traders gain a distinct advantage in the ever-evolving financial markets.
This document serves as an enriching guide to Structure Mapping & Demands and Supplies Premium, accentuating its pivotal role within the Smart Money Concepts framework. We invite users to immerse themselves in an experience that transcends the ordinary, delving into the intricacies that define successful trading. As you navigate the complexities of the market, these detailed insights become your compass, providing a rich and customizable user experience that unlocks the full potential of Smart Money Concepts. Embrace these tools judiciously, and empower your daily analysis with a wealth of information that truly holds its weight in gold.

itradesize /\ Previous HTF x OHLC Box
FYI: It is an invite-only script, if you are interested in, please scroll down to see the Author's instructions.
Introducing an indicator which inspired by ICT concepts that use a model, based on what TTrades teaches in some of his DOL videos about how to get a proper bias.
Having a daily bias can be frustrating and this script could make it easy for you besides creating a ton of opportunities for scalpers as well as not only helpful for a daily bias, it can also help you to determine the actual H4 or H1 bias or even lower.
Always keep in mind: the higher the timeframe you use, the more accurate it can be.
You can use OHLC to determine the current or higher time frame bias as it can be used on any of them and properly gain a sentiment of a drawn of liquidity.
This model integrates the previous candle's open, high, low, and close values (or open, low, high close) in addition to their equilibrium to make it easier to identify where the price should go moreover they can be used as reference points for potential trading opportunities.
The 50% also known as equilibrium creates premium and discount zones within the previous candles. Using the former higher timeframe candle’s OHLC you can simply have an external range of liquidity and where the current price should it drawn to.
With this tool, you can achieve a proper trading framework as you can easily recognize the external & internal range of liquidity, so whether you are a scalper or a day trader you are able to rely on the indicator.
A bit of a candlestick analysis:
When the price wicks below means a potential bullish reversal is incoming.
When the price wicks above, then it means a potential bearish reversal is happening.
Closing below means lower prices. (Bearish trend)
Closing above means higher prices. (Bullish trend)
This indicator is an absolute monster for the OHLC guys.
How to use it?
- Analyse the trend on the higher timeframe, bullish trend is when the price continuously takes the previous candle’s high over and over again. Bearish trend is the total opposite.
- Wait for external liquidity to be taken.
- When it's happening there should be a displacement back to the range with an actual structure shift.
- Looking for an imbalance in the displacement.
- Aiming for an imbalance that is above 50% of the former move.
- Aggressive stop: below or above the candle which has an imbalance
- Conservative stop: below or above the former swing
Classic sell setup:
Classic buy setup:
The indicator has a ton of customizable features, the power of the tool is really in there, as you can find or refine your own model with it. Once you're familiar with your setup you will be really feeling the power of the tool, I promise.
Indicator Features:
• M5/M15/H1/H4/D Time frames
• OHLC bar with an offset (you can have a look at the current HTF bar developing or you can use it as a locked previous bar)
• Current time frame OHLC / OLHC box with extended lines to the current time
• Showing the previous time frame OHLC / OLHC box with extended lines and the ability to add labels. The color of the OHLC or OLHC box is based on the candle closing. If it's a bear candle, if it's a bull candle.
• Previous high time frame open / close lines with labels, customisable colours, label sizes
• It has a lot of customisable features, the power of the tool is really in there as you can find or refine your own model with it.
• Every box and bar automatically switches its colors based on the close of the candle whether it's a bear or a bull candle.
• The color of the labels is switching automatically based on the coloring of your chart.
• You can customize each and every box color - OHLC/OLHC based on your taste, and the open and closing lines of the previous HTF.
Additional Information:
You can combine it with my own model. If you are not familiar with it, you can find here .
Or you can combine it with other frameworks for extra confluences like combining it with Daye’s QT in some simple equation:
Open → Q1 , High → Q2, Low → Q3, Close → Q4
Open → Q1, Low → Q2, High → Q3, Close → Q4

SMC Structures and FVGThe SMC Structures and FVG indicator allows the user to easily identify trend continuations (Break Of Structure) or trend changes (CHange Of CHaracter) on any time frame. In addition, it display all FVG areas, whether they are bullish, bearish, or even mitigated.
Fair Value Gap :
The FVG process shows every bullish, bearish or even mitigated FVG liquidity area. When a FVG is fully mitigated it will directly be removed of the chart.
There is an history of FVG to show. By selecting specific number of FVG to show in the chart, the user can focus its analysis on lasts liquidity area.
Here's the rules for FVG color :
Green when it's a bullish FVG and has not been mitigated
Red when it's a bearish FVG and has not been mitigated
Gray when the bullish / bearish FVG has been mitigated
Removed when the FVG has been fully mitigated
Structures analysis:
The Structure process show BOS in grey lines and CHoCH in yellow lines. It shows to the user the lasts price action pattern.
The blue lines are the high value and the low value of the current structure.
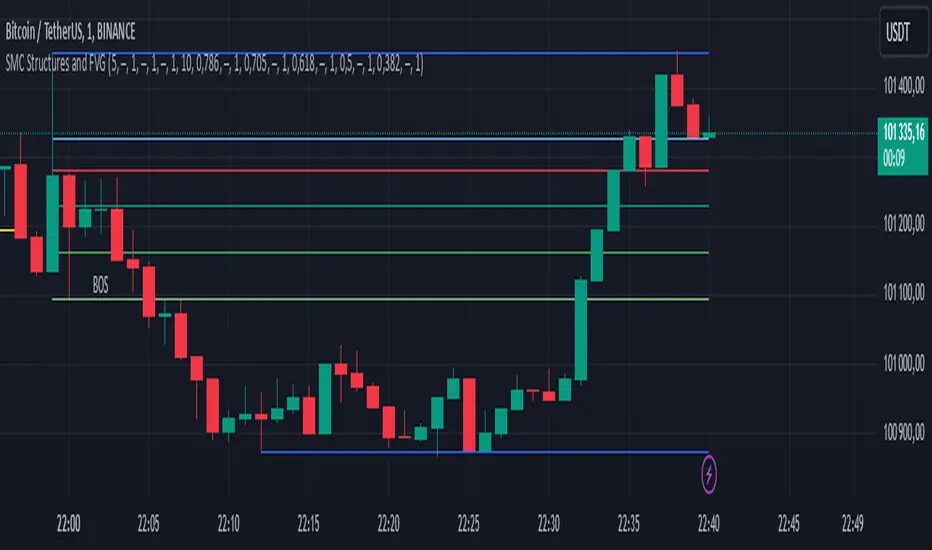
MTF Smart Money ConceptsOverview
This indicator displays major elements of Smart Money Concepts and price action trading with multi-timeframes(MTF) and layered market structures with color visualization.
What is Smart Money Concepts?
Smart Money Concepts(SMC) is one of the methodologies to interpret how financial market moves and to analyze it and execute trades, focusing on liquidity and order flow of financial institutions.
Smart money means the funds invested by large financial institutions such as banks, institutional traders/investors, market makers, hedge funds etc. contrary to retail traders/investors' money.
It is important to note that there is no proof or evidence that those institutions move the market as described in Smart Money Concepts.
Personally speaking, it is one of the interpretation of the market and another angle to view the market just like other technical analysis methodologies such as Elliott Wave Principle, Gann Theory, Wyckoff Method and even traditional price action trading.
Importance of MTF Analysis
MTF analysis(a.k.a Topdown analysis) is the foundation to technically analyze charts and the most fundamental skill in trading because lower timeframes are always influenced by upper timeframes where large financial institutions operate.
How to use
This indicator is designed to help traders analyze how the market moves in terms of SMC and price action with multi-timeframes and color visualization of the market structures, which makes this indicator unique and different from other indicators.
There is two key settings that you can use based on your trading style.
1.Upper timeframe selection
You have two options to determine upper timeframe; Auto mode and Manual mode.
When Auto mode selected, upper timeframe will be determined based on chart timeframe as follows.
Chart timeframe => Upper timeframe
1M=>15M
5M/15M=>1H
30M/1H=>4H
4H=>D
D=>W
W=>M
If you select Manual mode, you can fix an upper timeframe.
2.High/low settings
This affects all other settings of the indicator and most importantly designs the market structure.
This is the key setting to determine how you view the market as price action trading is all about highs and lows and story of how highs and lows have been created with the market structure.
You can specify left bars and right bars to identify swing highs/lows and these highs/lows become the basis to design the market structure and determine how SMC elements are displayed.
Example:
Left bar&right bar: 10
You can see bigger wave(magenta line) in the market structure(stepped line).
(Magenta line is a drawn object by manual)
Left bar&right bar: 4
With this setting, you can see smaller wave in the market structure.
Since market moves like wave as there is a lot of wave theories in financial investment/trading industry such as Elliott wave, Wolf wave etc., users can define market structure with this setting depending on what degree of wave they aim to trade.
Functions:
MTF Order Block
Concept
Order block is a block of orders where buying orders and selling orders are accumulated. Order blocks are created when the institutions move the market up and down, temporality placing orders in an opposite direction to the way they want to move, in order to match their own orders with counter-orders.
Visualization by the indicator
The indicator displays both chart timeframe's order blocks and upper timeframe's order blocks(MTF).
You can also select from two options how to display order blocks;
1. Show all order blocks
2. Show strong order blocks only
Note: Strong order blocks mean order blocks created at strong highs/lows. See also strong high/low below.
Alerts can be set when prices reach strong order blocks.
MTF Fair Value Gap(FVG)/Imbalance
Concept
Fair Value Gap(FVG)(Imbalance) is a void generated among three consecutive candlesticks.
FVG(s) is created when the market moves so rapidly generating buy side or sell side order imbalances.
FVG(s) is characterized by price action that prices tend to come back to the area where FVG(s) exists, filling in the space among the candlesticks.
Visualization by the indicator
The indicator displays both chart timeframe's FVG and upper timeframe's FVG.
MTF Liquidity Grab
Concept
Liquidity grab is price action to sweep liquidity for the institutions to move the market.
This price action often happens because the size of their orders is so huge and they need a bunch of counter-orders to match their orders. This is why prices sometimes come to areas where liquidity rest and swipe them before the market goes up/down.
Liquidity visualization
Where does liquidity rest?
The answer is above highs(buy side liquidity) and below lows(sell side liquidity).
Among all highs and lows, swing highs and lows are where liquidity is accumulated the most because swing highs and lows can be created only by the institutions, therefore massive liquidity is indicated.
Visualization by the indicator
The indicator displays liquidity dots so that users can easily identify where liquidity rests and liquidity grab of both a chart timeframe and an upper timeframe.
Alerts can be set when liquidity grab happens.
MTF Strong High/Low
Concept
Strong high/low literally means strong highs and lows among all highs and lows including swing highs and lows.
There is a few different definitions of strong high/low in price action trading and the definition in this indicator is as follows.
Strong high
A high that that breaks higher low or lower low
Strong low
A low that breaks lower high or higher high
Visualization by the indicator
The indicator displays strong highs and lows of both a chart timeframe and an upper timeframe.
MTF Market Structure Visualization
Concept
Market structure is a series of price movement with highs and lows which outlines the way the market directs. It is a basis to see trend occurrence, trend reversal and sideways and analyzing the market structures in multi-timeframes is the most fundamental technical skill in trading/investment.
Visualization by the indicator
The indicator displays market structures of both a chart timeframe and an upper timeframe and provide color visualization depending on bullish and bearish market structures.
The definition of bullish and bearish market structure is as follows.
Bullish market structure
When a price breaks a Lower High or Higher High
Bearish market structure
When a price breaks a Higher Low or Lower Low
Settings
All the functions above, colors and line settings are parameterized and can be turned on/off depending on users’ needs.
———————————————————————————
概要
Smart Money Concepts(SMC)およびプライスアクショントレードにおける重要な要素をマルチタイムフレームで表示することのできるインジケーターです。
相場構造(Market structure)をマルチタイムフレームで表示し、相場構造の強弱を色で可視化することができます。
Smart Money Concepts(スマートマネーコンセプト)とは?
Smart Money Concepts(以下SMC) は金融市場がどのように動くかを解釈し、分析し、取引を執行するための相場理論の一つであり、Liquidity(リクイディティ)および機関投資家のオーダーフロー(注文の流れ)に焦点を置いていることが特徴です。
Smart Money(スマートマネー)とは、銀行や機関投資家、マーケットメーカー、ヘッジファンドといった金融機関が動かす資金を意味し、個人投資家の資金と対をなす概念です。
重要な点は、実際に上記の金融機関がSmart Money Conceptsで語られているような相場の動かし方をしているかどうかを証明する明確なエビデンスはないということです。
個人的には、エリオット波動理論やギャン理論、ワイコフ理論、伝統的なプライスアクショントレーディングの方法論と同様に、マーケットの動きを解釈するための一つの方法論であり、マーケットの動きを別の角度から見る枠組みと捉えています。
マルチタイムフレーム(MTF)分析の重要性
MTF分析はチャートをテクニカルに分析する上での基礎であり、トレードにおいて最も重要なスキルです。なぜなら下位のタイムフレームは上記のような金融機関が資金運用を行う上位のタイムフレームの影響を常に受けるためです。
使い方
このインジケーターは、SMCまたはプライスアクショントレードの観点から、トレーダーがマーケットをマルチタイムフレームで分析することを支援するために開発しています。
相場構造(Market structure/マーケットストラクチャー)を方向性に応じて色で可視化することができるため、視覚的に相場の構造を判断できることがこのインジケータのユニークな点であり、他のインジケーターと異なる点です。
ユーザーのトレードスタイルに応じて、以下の二つの設定を行うことができます。
1.上位足の決定方法
ユーザーは上位足のタイムフレームを決定するにあたり、AutoモードとManualモードを選択することができます。
Autoモードを選択した場合、上位足はチャートのタイムフレームに応じて以下のように決定されます。
チャートタイムフレーム => 上位足タイムフレーム
1M=>15M
5M/15M=>1H
30M/1H=>4H
4H=>D
D=>W
W=>M
Manualモードを選択すると上位足のタイムフレームを固定することができます。
2.High/low(高値/安値) 設定
当設定はインジケーターの他の全ての機能に影響し、また最も重要である相場構造の定義に影響します。
当設定はユーザーがマーケットをどのように見るか(=どの程度の粒度)を決定する重要な設定です。なぜならプライスアクショントレードは、高値、安値とそれらが相場構造をどのように構築してきたかの一連の流れを分析することが全てだからです。
ユーザーは相場構造を決定付けるスイングハイ·スイングローを特定するためのバーの本数を設定することができます。ここで設定した内容が、相場構造を定義し、以下で説明するSMCの要素の表示を決定することになります。
例:
Left bar&right bar(左右のバーの数): 10
この場合、ステップラインで示した相場構造の中に大きな波(マゼンタの波)を見ることができます。
(マゼンタのラインは手動で描いたオブジェクト)
Left bar&right bar: 4
この設定では、上記に比べて小さい波を描いていることが確認できます。
相場理論の中にエリオット波動理論やウォルフ波動といった数多くの波動理論があることからわかるように、相場は波として動きます。どの粒度の波を狙うかというトレーダーのスタイルに応じて、設定を変更することができます。
機能
MTFオーダーブロック
コンセプト
オーダーブロックとは買い注文と売り注文が一連となって蓄積されたオーダー(注文)のブロックのことです。
オーダーブロックは機関投資家が相場を動かす際に、本来意図する方向とは一時的に逆に動かすことで、彼ら自身の注文をマッチングさせるための反対注文を発生させることで形成されます。
インジケーターによる表示
インジケーターはチャートタイムフレームのオーダーブロックと上位足のオーダーブロックの両方を表示することができます。
また、オーダーブロックの表示オプションとして、
1.全てのオーダーブロックを表示
2.Strong(ストロング)オーダーブロックのみを表示
を選択することが可能です。
注: StrongオーダーブロックはStrong High/Lowで形成されるオーダーブロックを指します。(下記参照)
また、オーダーブロック到達でのアラート設定も可能です。
MTFフェアーバリューギャップ(FVG)/インバランス
コンセプト
フェアーバリューギャップ(FVG)/インバランスとは連続する3つのローソク足の間に形成される溝(Gap)のことです。
フェアーバリューギャップはマーケットが非常に早く動いたことにより、買いオーダーと売りオーダーの需給バランスが崩れることによって発生します。
フェアーバリューギャップには、価格がフェアーバリューギャップが発生したエリアまで戻ってくる傾向があるという特徴が存在します。
インジケーターによる表示
インジケーターはチャートタイムフレームのフェアーバリューギャップと上位足のフェアーバリューギャップの両方を表示することができます。
MTF Liquidity Grab(リクイディティ·グラブ)
コンセプト
Liquidity(リクイディティ)とはマネー、つまり注文です。
Liquidity Grab(リクイディティ·グラブ)とは、機関投資家がマーケットを動かす際にLiquidityを取得するプライスアクションのことを指します。
このプライスアクションは、機関投資家が処理する注文サイズが非常に大きいため、自身の注文を出す際に大量の反対注文を必要とすることからしばしば発生します。
これが、価格がLiquidity(注文)の集まっているエリアに接近し、それら注文をスワイプ(狩り取る)した後に上昇·下落する理由です。
Liquidityの可視化
一般的にLiquidityは高値の上(buy side liquidity)、安値の下(sell side liquidity)に存在します。
全ての高値·安値の中で、スイングハイ·ローがliquidityが最も蓄積されているエリアということができます。なぜならスイングハイ·ローは機関投資家の注文によってのみ形成されるからです。
インジケーターによる表示
ユーザーがLiquidityポイントを簡単に識別できるようにLiquidityをドット表示することが可能です。またチャートタイムフレームと上位足の両方のLiquidity Grabを表示することができます。
Liquidity Grab発生時にアラートも設定可能です。
MTF Strong High/Low(ストロングハイ·ロー)
コンセプト
Strong high/lowは文字通り、強い高値·安値のことを指します。
トレーダーの間でいくつかの異なる定義が存在しますが、当インジケーターでの定義は以下の通りです。
Strong high
Higher low(ハイアーロー) または Lower low(ロワーロー)をブレイクした高値
Strong low
Lower higher (ロワーハイ) または Higher High(ハイアーハイ)をブレイクした安値
インジケーターによる表示
チャートタイムフレーム、上位足のStrong High/Lowを表示することが可能です。
相場構造可視化
コンセプト
相場構造(Market structure/マーケットストラクチャー)とは、相場の流れを成り立たせる高値と安値を元にした一連の値動きです。建物における骨組みに該当します。
トレンドの発生、転換、レンジを見極めるための基礎であり、マルチタイムフレームで相場構造を分析することは、投資·トレードにおいて最も重要なテクニカルスキルです。
インジケーターによる表示
チャートタイムフレームと上位足タイムフレーム両方の相場構造を表示することができます。
また、相場構造が強気の状態か弱気の状態かを色で可視化するため、上位足含めた相場の流れを視覚的に判断することが可能です。
相場構造の強弱の定義は以下の通りです。
強気の相場構造(Bullish market structure)
価格がLower HighまたはHigher Highをブレイクしたとき
弱気の相場構造(Bearish market structure)
価格がHigher LowまたはLower Lowをブレイクしたとき
設定
上記の全ての機能は色やライン設定含めパラメーターで設定が可能です。またユーザの必要に応じて表示·非表示を切り替えることができます。
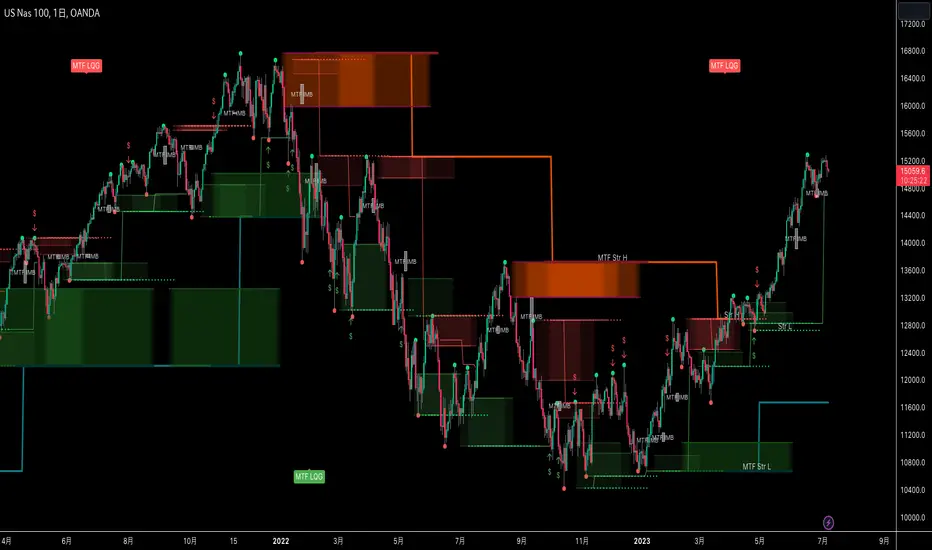
Price based concepts / quantifytools- Overview
Price based concepts incorporates a collection of multiple price action based concepts. Main component of the script is market structure, on top of which liquidity sweeps and deviations are built on, leaving imbalances the only standalone concept included. Each concept can be enabled/disabled separately for creating a selection of indications that one deems relevant for their purposes. Price based concepts are quantified using metrics that measure their expected behavior, such as historical likelihood of supportive price action for given market structure state and volume traded at liquidity sweeps. The concepts principally work on any chart, whether that is equities, currencies, cryptocurrencies or commodities, charts with volume data or no volume data. Essentially any asset that can be considered an ordinary speculative asset. The concepts also work on any timeframe, from second charts to monthly charts. None of the indications are repainted.
Market structure
Market structure is an analysis of support/resistance levels (pivots) and their position relative to each other. Market structure is considered to be bullish on a series of higher highs/higher lows and bearish on a series of lower highs/lower lows. Market structure shifts from bullish to bearish and vice versa on a break of the most recent pivot high/low, indicating weak ability to defend a key level from the dominating side. Supportive market structure typically provides lengthier and sustained trending environment, making it an ideal point of confluence for establishing directional bias for trades.
Liquidity sweeps
Liquidity sweeps are formed when price exceeds a pivot level that served as a provable level of demand once and is expected to display demand again when revisited. A simple way to look at liquidity sweeps is re-tests of untapped support/resistance levels.
Deviations
Deviations are formed when price exceeds a reference level (market structure shift level/liquidity sweep level) and shortly closes back in, leaving participating breakout traders in an awkward position. On further adverse movement, stuck breakout traders are forced to cover their underwater positions, creating ideal conditions for a lengthier reversal.
Imbalances
Imbalances, also known as fair value gaps or single prints, depict areas of inefficient and one sided transacting. Given inclination for markets to trade efficiently, price is naturally attracted to areas that lack proper participation, making imbalances ideal targets for entries or exits.
Key takeaways
- Price based concepts consists of market structure, liquidity sweeps, deviations and imbalances.
- Market structure shifts from bullish to bearish and vice versa on a break of the most recent pivot high/low, indicating weak ability to defend a key level from the dominating side.
- Supportive market structure tends to provide lengthier and sustained movement for the dominating side, making it an ideal foundation for establishing directional bias for trades.
- Liquidity sweeps are formed when price exceeds an untapped support/resistance level that served as a provable level of demand in the past, likely to show demand again when revisited.
- Deviations are formed when price exceeds a key level and shortly closes back in, leaving breakout traders in an awkward position. Further adverse movement compels trapped participants to cover their positions, creating ideal conditions for a reversal.
- Imbalances depict areas of inefficient and one sided transacting where price is naturally attracted to, making them ideal targets for entries or exits.
- Price based concepts are quantified using metrics that measure expected behavior, such as historical likelihood of supportive structure and volume traded at liquidity sweeps.
- For practical guide with practical examples, see last section.
Accessing script 🔑
See "Author's instructions" section, found at bottom of the script page.
Disclaimer
Price based concepts are not buy/sell signals, a standalone trading strategy or financial advice. They also do not substitute knowing how to trade. Example charts and ideas shown for use cases are textbook examples under ideal conditions, not guaranteed to repeat as they are presented. Price based concepts notify when a set of conditions are in place from a purely technical standpoint. Price based concepts should be viewed as one tool providing one kind of evidence, to be used in conjunction with other means of analysis.
Price based concepts are backtested using metrics that reasonably depict their expected behaviour, such as historical likelihood of supportive price movement on each market structure state. The metrics are not intended to be elaborate and perfect, but to serve as a general barometer for feedback created by the indications. Backtesting is done first and foremost to exclude scenarios where the concepts clearly don't work or work suboptimally, in which case they can't be considered as valid evidence. Even when the metrics indicate historical reactions of good quality, price impact can and inevitably does deviate from the expected. Past results do not guarantee future performance.
- Example charts
Chart #1 : BTCUSDT
Chart #2 : EURUSD
Chart #3 : ES futures
Chart #4 : NG futures
Chart #5 : Custom timeframes
- Concepts
Market structure
Knowing when price has truly pivoted is much harder than it might seem at first. In this script, pivots are determined using a custom formula based on volatility adjusted average price, a fundamentally different approach to the widely used highest/lowest price within X amount of bars. The script calculates average price within set period and adjusts it to volatility. Using this formula, the script determines when price has turned significantly enough and aggressively enough to constitute a relevant pivot, resulting in high accuracy while ruling out subjective decision making completely. Users can adjust length of market structure basis and sensitivity of volatility adjustment to achieve desired magnitude of pivots, reflected on the average swing metrics. Note that structure pivots are backpainted. Typical confirmation time for a pivot is within 2-3 bars after peak in price.
Market structure shifts
Generally speaking, traders consider market structure to have shifted when most recent structure high/low gets taken out, flipping underlying bias from one side over to the other (e.g. from bullish structure favoring upside to bearish structure favoring downside). However, there are many ways to approach the concept and the most popular method might not always be the best one. Users can determine their own market structure shift rules by choosing source (close, high, low, ohlc4 etc.) for determining structure shift. Users can also choose additional rules for structure shift, such as two consecutive closes above/below pivot to qualify as a valid shift.
Liquidity sweeps
Users can set maximum amount of bars liquidity levels are considered relevant from the moment of confirmed pivot. By default liquidity levels are monitored for 250 bars and then discarded. Level of tolerance can be set to anything between 100 and 1000 bars. For each liquidity sweep, relative volume (volume relative to volume moving average) is stored and added to average calculations for keeping track of typical depth of liquidity found at sweeps.
Deviations
Users can set a maximum amount of bars price has to spend above/below reference level to consider a deviation to be in place. By default set to 6 bars.
Imbalances
Users can set a desired fill point for imbalances using the following options: 100%, 75%, 50%, 25%. Users can also opt for excluding insignificant imbalances to attain better relevance in indications.
- Backtesting
Built-in backtesting is based on metrics that are considered to reasonably quantify expected behaviour of the main concept, market structure. Structure feedback is monitored using two metrics, supportive structure and structure period gain. Rest of the metrics provided are informational in nature, such as average swing and average relative volume traded at liquidity sweeps. Main purpose of the metrics is to form a general barometer for monitoring whether or not the concepts can be viewed as valid evidence. When the concepts are clearly not working optimally, one should adjust expectations accordingly or take action to improve performance. To make any valid conclusions of performance, sample size should also be significant enough to eliminate randomness effectively. If sample size on any individual chart is insufficient, one should view feedback scores on multiple correlating and comparable charts to make up for the loss.
For more elaborate backtesting, price based concepts can be used in any other script that has a source input, including fully mechanic strategies utilizing Tradingview's native backtester. Each concept and their indications (e.g. higher low on a bearish structure, lower high on a bullish structure, market structure shift up, imbalance filled etc.) can be utilized separately and used as a component in a backtesting script of your choice.
Structure feedback
Structure feedback is monitored using two metrics, likelihood of supportive price movement following a market structure shift and average structure period gain. If either of the two employed tests indicate failed reactions beyond a tolerable level, one should take action to improve feedback by adjusting the settings. If feedback metrics after adjusting the settings are still insufficient, the concepts are working suboptimally for the given chart and cannot be regarded as valid technical evidence as they are.
Metric #1 : Supportive structure
Each structure pivot is benchmarked against its respective structure shift level. Feedback is considered successful if structure pivot takes place above market structure shift level (in the case of bullish structure) or below market structure shift level (in the case of bearish structure). Structure feedback constitutes as one test indicating how often a market structure state results in price movement that can be considered supportive.
Metric #2 : Structure period gain
Each structure period is expected to present favorable appreciation, measured from one market structure shift level to another. E.g. bullish structure period gain is measured from market structure shift up level to market structure shift down level that ends the bullish structure period. Bearish structure is measured in a vice versa manner, from market structure shift down level to market structure shift up level that ends the bearish structure period. Feedback is considered successful if average structure period gain is supportive for a given structure (positive for bullish structure, negative for bearish structure).
Additional metrics
On top of structure feedback metrics, percentage gain for each swing (distance between a pivot to previous pivot) is recorded and stored to average calculations. Average swing calculations shed light on typical pivot magnitude for better understanding changes made in market structure settings. Average relative volume traded at liquidity sweep on the other hand gives a clue of depth of liquidity typically found on a sweeps.
Feedback scores
When market structure (basis for most concepts) is working optimally, quality threshold for both feedback metrics are met. By default, threshold for supportive structure is set to 66%, indicating valid feedback on 2/3 of backtesting periods on average. On top, average structure period gain needs to be positive (for bullish structures) and negative (for bearish structure) to qualify as valid feedback. When both tests are passed, a tick indicating valid feedback will appear next to feedback scores, otherwise an exclamation mark indicating suboptimal performance on either or both. If both or either test fail, market structure parameters need to be optimized for better performance or one needs to adjust expectations accordingly.
Verifying backtest calculations
Backtest metrics can be toggled on via input menu, separately for bullish and bearish structure. When toggled on, both cumulative and average counters used in backtesting will appear on "Data Window" tab. Calculation states are shown at a point in time where cursor is hovered. E.g. when hovering cursor on 4th of January 2021, backtest calculations as they were during this date will be shown.
- Alerts
Available alerts are the following.
- HH/HL/LH/LL/EQL/EQH on a bullish/bearish structure
- Bullish/bearish market structure shift
- Bullish/bearish imbalance created
- Bullish/bearish imbalance filled
- Bullish/bearish liquidity sweep
- Bullish/bearish deviation
- Visuals
Each concept can be enabled/disabled separately for creating a selection indications that one deems relevant for their purposes. On top, each concept has a stealth visual option for more discreet visuals.
Unfilled imbalances and untapped liquidity levels can be extended forward to better gauge key areas of interest.
Liquidity sweeps have an intensity option, using color and width to visualize volume traded at sweep.
Market structure states and market structure shifts can be visualized as chart color.
Metric table can be offsetted horizontally or vertically from any four corners of the chart, allowing space for tables from other scripts.
Table sizes, label sizes and colors are fully customizable via input menu.
- Practical guide
The basic idea behind market structure is that a side (bulls or bears) have shown significant weakness on a failed attempt to defend a key level (most recent pivot high/low). In the same way, a side has shown significant strength on a successful attempt to break through a key level. This successful break through a key level often leads to sustained lengthier movement for the side that provably has the upper hand, making it an ideal tool for establishing directional bias.
Multi-timeframe view of market structure provides crucial guidance for analyzing market structure states on any individual timeframe. If higher timeframe market structure is bullish, it doesn't make sense to expect contradicting lower timeframe market structure to provide significant adverse movement, but rather a normal correction within a long term trend. In the same way, if lower timeframe market structure is in agreement with higher timeframe market structure, one can expect a reliable trending environment to ensue as multiple points of confluence are in place.
Bullish structure can be considered constructive on a series of higher highs and higher lows, indicating strong interest from bulls to sustain an uptrend. Vice versa is true for bearish structure, a series of lower highs and lower lows can be considered constructive. When structure does not indicate strong interest to maintain a supportive trend (lower highs on bullish structure, higher lows on bearish structure), a structure shift and a turn in trend might be nearing.
Market structure shifts are of great interest for breakout traders who position for continuation. Structure shifts can indeed be fertile ground for executing a breakout trade, but breakouts can easily turn into fakeouts that leave participants in an awkward position. When price moves further away from the underwater participants, potential for snowball effect of covering positions and driving price further away is elevated.
Liquidity sweeps as a concept is based on the premise that pivoting price is evidence of meaningful depth of liquidity found at/around pivot. If liquidity existed at a pivot once, it is likely to exist there in the future as well. When price grinds against liquidity, it is on a path of resistance rather than path of least resistance. Pivots are also attractive placements for traders to set stop-losses, which act as fuel for price to move to the opposite direction when swept and triggered.
Behind tightly formed pivots are potentially many stop-loss orders lulled in the comfort of having many layers of levels protecting their position. Compression that leaves such clusters of unswept liquidity rarely goes unvisited.
As markets strive for efficient and proper transacting most of the time, imbalances serve as points in price where price is naturally attracted to. However, imbalances too are contextual and sometimes one sided trading is rewarded with follow through, rather than with a fill. Identifying market regimes give further clue into what to expect from imbalances. In a ranging environment, one can expect imbalances to fill relatively quick, making them ideal targets for entries and exits.
On a strongly trending environment on the other hand imbalances tend to stick for a much longer time. In such environments continuation can be expected with no fills or only partial fills. Signs of demand preventing fill attempts serve as additional clues for imminent continuation.

SMT Divergences [LuxAlgo]The SMT Divergences indicator highlights SMT divergences between the chart symbol and two user-selected tickers (ES and YM by default).
A dashboard returning the SMT divergences statistics is also provided within the settings.
🔶 SETTINGS
Swing Lookback: Calculation window used to detect swing points.
Comparison Ticker: If enabled, will detect SMT divergences between the chart prices and the prices of the selected ticker.
🔹 Dashboard
Show Dashboard: Displays statistics dashboard on the chart.
Location: Location of the dashboard on the chart.
Size: Size of the displayed dashboard.
🔶 USAGE
SMT Divergences are characterized by diverging swing points between two securities.
The detection of SMT Divergences is performed by detecting swing points using the user chart prices as well as the prices of the selected external tickers. If a swing point on the chart ticker is detected at the same time on external tickers, comparison is performed.
Due to the detection requiring swing point confirmation (3 candles by default), this indicator can better be used to study price behaviors on the occurrence of an SMT divergence.
The dashboard highlights the number of SMT divergences that occurred on a swing high and swing low between the chart ticker and the selected external tickers.
The returned percentage indicates the proportion of swing highs or swing lows that led to an SMT divergence.

Inversion GapsAn inverted fair value gap (FVG) occurs when candles start closing below a bullish FVG or above a bearish FVG and in this case, support FVGs become resistances and vice versa. This is a smart money concept introduced by ICT. While we a number of have indicators for FVGs, we don't have any for inversion FVGs. This indicator is just for that - it shows FVGs only after they're inverted.
The meat of it comes from being able to plot HTF inverted FVGs in LTF. In the above BTC chart, you can see M15 inverted FVGs plotted on M1 chart and you can see price respecting them. Mitigations can also be shown as lines (as you can see in the chart).
You can also setup alerts for formation and mitigation of such inversion FVGs.

Smart Money Concepts Probability (Expo)█ Overview
The Smart Money Concept Probability (Expo) is an indicator developed to track the actions of institutional investors, commonly known as "smart money." This tool calculates the likelihood of smart money being actively engaged in buying or selling within the market, referred to as the "smart money order flow."
The indicator measures the probability of three key events: Change of Character ( CHoCH ), Shift in Market Structure ( SMS ), and Break of Structure ( BMS ). These probabilities are displayed as percentages alongside their respective levels, providing a straightforward and immediate understanding of the likelihood of smart money order flow.
Finally, the backtested results are shown in a table, which gives traders an understanding of the historical performance of the current order flow direction.
█ Calculations
The algorithm individually computes the likelihood of the events ( CHoCH , SMS , and BMS ). A positive score is assigned for events where the price successfully breaks through the level with the highest probability, and a negative score when the price fails to do so. By doing so, the algorithm determines the probability of each event occurring and calculates the total profitability derived from all the events.
█ Example
In this case, we have an 85% probability that the price will break above the upper range and make a new Break Of Structure and only a 16.36% probability that the price will break below the lower range and make a Change Of Character.
█ Settings
The Structure Period sets the pivot period to use when calculating the market structure.
The Structure Response sets how responsive the market structure should be. A low value returns a more responsive structure. A high value returns a less responsive structure.
█ How to use
This indicator is a perfect tool for anyone that wants to understand the probability of a Change of Character ( CHoCH ), Shift in Market Structure ( SMS ), and Break of Structure ( BMS )
The insights provided by this tool help traders gain an understanding of the smart money order flow direction, which can be used to determine the market trend.
█ Any Alert function call
An alert is sent when the price breaks the upper or lower range, and you can select what should be included in the alert. You can enable the following options:
Ticker ID
Timeframe
Probability percentage
-----------------
Disclaimer
The information contained in my Scripts/Indicators/Ideas/Algos/Systems does not constitute financial advice or a solicitation to buy or sell any securities of any type. I will not accept liability for any loss or damage, including without limitation any loss of profit, which may arise directly or indirectly from the use of or reliance on such information.
All investments involve risk, and the past performance of a security, industry, sector, market, financial product, trading strategy, backtest, or individual's trading does not guarantee future results or returns. Investors are fully responsible for any investment decisions they make. Such decisions should be based solely on an evaluation of their financial circumstances, investment objectives, risk tolerance, and liquidity needs.
My Scripts/Indicators/Ideas/Algos/Systems are only for educational purposes!

Expansion IndexWhat is the expansion index?
The expansion index is a concept that charts the relative strength or weakness based on the comparison of recent price changes and overall prices changes for the period.
It can be used as an momentum oscillator and show overbought or oversold price conditions by measuring the relation between the sum of "strong" price changes (which can form trends).
The Expansion Index is most typically used on an 8 day timeframe. It changes on a scale from −100 to +100, with the overbought and oversold levels marked at +60 and −60, respectively.
What about this indicator?
This indicator basically shows the rate of expansion from zero, but also has other uses apart from finding over bought or over sold territory.
Scenarios:
Lets say you are identifying a contraction zone (low volume zone of candles), you can further confirm the contraction if the Index is at or near 0, in this case it might have more strength
and play out more accurately the contraction and expansion.
Once the Expansion begins and price expands from the 0 level you can determine if its overbought which would be around the 1.00 Level or Oversold which would be at around the -1.00 Levels, and a reversal can follow out.
With the rate of change line you can identify trends in market and when reversals will start.
This indicator is best used with contraction, expansion, and trend principles also known as the Forex Master Pattern, as it was for what this specific indicator was designed for.
Thanks to NNAMDERT for writing this indicator and giving full rights. :)

The Zone Seeker Supply and Demand - by Karoshi TradingThe Zone Seeker Supply and Demand - by Karoshi Trading
The Zone Seeker is based on the Supply & Demand Methodology.
Activating this indicator will mark all the zones of your chart.
Depending on your setting preferences, some zones will be showed or not.
The indicator code works as follow:
We will use the number of consecutive candles, body size compared to the wick and body length to calculate the zones.
Here is an example of the indicator.
1# Consecutive Candles
The indicator will search for minimum 2 consecutive candles of the same color. That means, that both candles has to close above the opening price of each candle (Bullish) or close below there opening prices (Bearish).
2# Body Size
After the first condition is met, the Code will now look into each candles of step #1.
Each of the candles should be equal or above 50% body, to meet the second requirement.
It will calculate the body size, compared to the full candle size to determine the percentage of the body itself.
3# Body Length
If the first two steps are positive, the code will jump into the 3rd phase of the indicator, the „Body Length“. With 2 options (ATR & MA) the code will calculate within a 14 candles period the average range of the candles. With that information, the code will now compare the average range to our candles from step #1.
The candles from step #1 has to be equal or bigger than 1.5 times the range/size of the average candle to met our last requirement.
4# Demand & Supply Zones
After all 3 requirements are met, the code will search for the last candle of the opposite color, to mark a zone. As example, if we have a demand zone with all conditions met, the indicator will search for the latest candle where the price closed below the opening price.
After finding such a candle, the indicator will mark the whole range of this candle (body + wick) and create a colored rectangle with a description in it. As example „Demand CTF“
CTF = Current Time Frame
5# Testing the Zones
As a test, we only count if the price went inside or touched the zone and left it and closed outside the zone. (You can choose by yourself if touched is on or off in the settings).
The code will not count each candle as a test, but each phase where the price went into the zone and closed outside the zone. As an example, if price went into a demand zone and closes 2 candles within the zone and the 3rd candle closes above the demand zone, that will count as one test.
Each test, will change the color of the zone, to keep in track of the freshness of the zones. After the 3rd test of a zone, the zone will be automatically deleted.
6# Flipping Zones
As a flipping zone is meant, that if the demand zone get broken to the downside by 2 or less candles it will automatically turn into a fresh supply zone. Important to know is, it will only occur if the candles closes below the demand zone. Same occurs for supply zones.
7# Multiple TimeFrames
It is possible, to choose one more time frame on top of the current time frame your are actually trading.
The code will separate both time frames, so you can choose how many zones you want to see in each time frame.
The supplementary time frame zones will be in 3 different grey colors, to destinguish the zones.
Also, overlapping zones will have a little info box, to avoid overlapping text.
On top of that, you can also show "all" time frames at once.
Current Time Frame = Colorized Zones
Supplementary Time Frames = Grey Zones