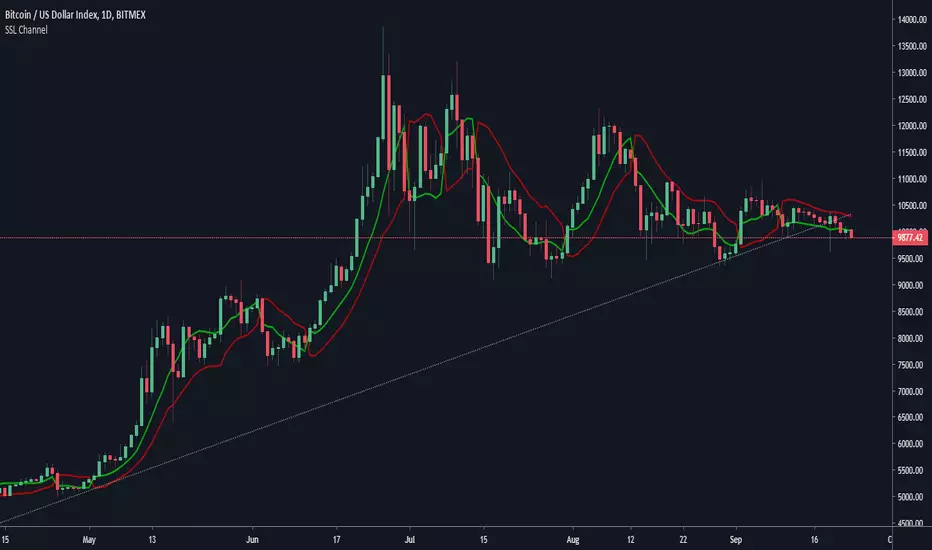
SSL Channel MTFSSL Channel with MTF support, This eliminates the noise of a basic SSL Channel script which is based on ErwinBeckers SSL Channel. So i have used a Multi Time Frame approach to have a clear confirmation of trend and reduce Noise and False signals unlike basic SSL Channel.
This script can be used to determine.
Support/Resistance
High/Low Breakout
Trend Direction
MA candles for Entry
The high and low sma are plotted as SSL CHANNEL when ever the high and low sma cross each other a direction change is observed.
The direction of SSL channel determines the trend of the price. The length of the channel can be changed as required a low value has a high noise and direction can be determined with low accuracy. Increasing the length of SSL channel has high accuracy trend confirmation.
The MTF SSL Channel uses plot from higher timeframe this helps in using SSL Channel as a Price Action Tool. Price when ever crosses over or below the channel determines a breakout. Price tries to move between the High SMA line and Low SMA Line of the SSL Channel rejection, breakouts can be easily observed on a lower timeframe using SSL Channel Plot from a higher timeframe.
I have used 5min/15min chart with MTF SSL from a 1Hr/4Hr and a length of 5 instead of 10. This helps quick direction changes over a period of 1hr to 4hr. Price is trapped within the High SMA and Low SMA lines of SSL Channel. In addition to SSL High Low and average mid line is plotted to additional reference.
Buy Sell Signals are plotted based on crossover of SMA High and Low.
Candle are Plotted Using a SMA with length of 5. This Candle Plot can be used to make an entry based on direction confirmation of SSL. keep in mind the direction of SSL Plot and the candle must be same. Preferably Entry can made above or below the midline of SSL Channel. The Candle Plot eliminates the Noise of traditional Japanese Candlesticks.
Additionally MACD Crossover and MACD Trend line confirmations can be used to confirm a Buy Sell and Entry signals
Alerts are also plotted accordingly.
Sslchannel

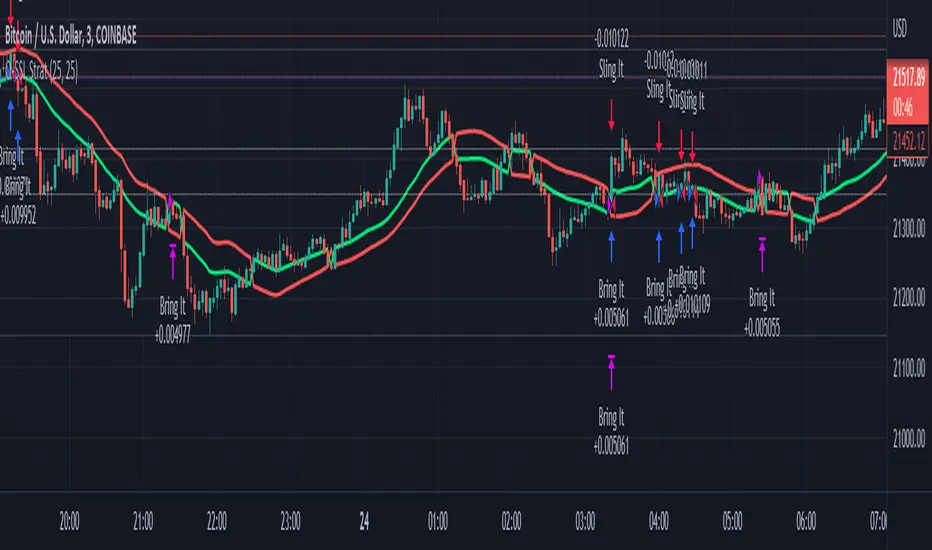
Crypto Notes Scalping Indicator by Mohsin
**Crypto Notes Indicator**
This custom trading indicator, named "Crypto Notes," is designed to assist traders in analyzing cryptocurrency price movements. It combines two key components: the SSL (Stochastic Support and Resistance) channel and a Moving Average.
**Indicator Components:**
1. **SSL Channel:**
- The SSL channel is a technical analysis tool that helps identify potential support and resistance levels in the cryptocurrency price chart.
- The indicator calculates two values: `sslDown` and `sslUp`, which represent potential support and resistance levels, respectively.
- The SSL channel is based on a user-defined period and length, allowing traders to customize the sensitivity of the support and resistance levels.
2. **Buy and Sell Signals:**
- Buy and sell signals are generated when the `sslUp` crosses above `sslDown` (a buy signal) or when `sslUp` crosses below `sslDown` (a sell signal).
- These signals help traders identify potential entry and exit points for their cryptocurrency trades.
3. **Moving Average (MA1):**
- The indicator also includes a customizable exponential moving average (EMA) with a length defined by the user.
- This moving average (MA1) can be used to smooth out price data and identify trends in the cryptocurrency's price movement.
**How to Use:**
1. **SSL Channel:** The SSL channel visually represents potential support and resistance levels on the price chart. Traders can observe price behavior concerning these levels to make trading decisions.
2. **Buy Signals:** Buy signals are labeled as "BUY" on the chart when `sslUp` crosses above `sslDown`. This is an indication of a potential bullish trend or an opportune time to enter a long position.
3. **Sell Signals:** Sell signals are labeled as "SELL" on the chart when `sslUp` crosses below `sslDown`. This suggests a potential bearish trend or an opportune time to exit a long position or consider shorting.
4. **Moving Average (MA1):** The customizable moving average (MA1) can help traders identify trends in the cryptocurrency's price movement. When MA1 is above the price, it may suggest an uptrend, and when it's below, it may suggest a downtrend.
**Customization:**
- Traders can adjust the indicator's parameters, such as the SSL channel period, length, and the length of the EMA (MA1), to suit their specific trading strategies and preferences.
**Disclaimer:** This indicator is a tool for technical analysis and does not provide financial advice. Trading cryptocurrencies involves risks, and users should conduct thorough research and risk management before making any trading decisions.
**Note:** It's essential to thoroughly test this indicator and incorporate it into a comprehensive trading strategy before using it for actual trading.
---
Please ensure you understand the indicator's functionality and consider using it alongside other tools and analysis methods as part of your trading strategy.

[DuDu95] SSL 4C MACD Laugerre RSI StrategyHello Guys! Nice to meet you all!
Before I start, my nickname has changed to 'DuDu95'!!
This is the Strategy introduced by youtube channel.
I made this based on the open source indicator by kevinmck100, vkno422, KivancOzbilgic. Thank you All!
### Entry Logic
1. Long Entry Logic
- close > SSL Hybrid baseline upper k (keltner channel)
- macd signal > 0 and current MACD value > previous MACD value
- Laguerre RSI < overbought Line.
2. short Entry Logic
- close < SSL Hybrid baseline lower k (keltner channel)
- macd signal < 0 and current MACD value < previous MACD value
- Laguerre RSI > overbought Line.
### Exit Logic
1. Long Exit Logic
- close < SSL Hybrid baseline lower k (keltner channel)
- macd signal < 0
2. short Entry Logic
- close > SSL Hybrid baseline upper k (keltner channel)
- macd signal > 0
### StopLoss
1. Can Choose Stop Loss Type: Percent, ATR, Previous Low / High.
2. Can Chosse inputs of each Stop Loss Type.
### Take Profit
1. Can set Risk Reward Ratio for Take Profit.
- To simplify backtest, I erased all other options except RR Ratio.
- You can add Take Profit Logic by adding options in the code.
2. Can set Take Profit Quantity.
### Risk Manangement
1. Can choose whether to use Risk Manangement Logic.
- This controls the Quantity of the Entry.
- e.g. If you want to take 3% risk per trade and stop loss price is 6% below the long entry price,
then 50% of your equity will be used for trade.
2. Can choose How much risk you would take per trade.
### Plot
1. Added Labels to check the data of entry / exit positions.
2. Changed and Added color different from the original one. (green: #02732A, red: #D92332, yellow: #F2E313)

SSL + Wave Trend StrategyStrategy incorporates the following features:
Risk management:
Configurable X% loss per stop loss
Configurable R:R ratio
Trade entry:
Based on strategy conditions below
Trade exit:
Based on strategy conditions below
Backtesting:
Configurable backtesting range by date
Trade drawings:
Each entry condition indicator can be turned on and off
TP/SL boxes drawn for all trades. Can be turned on and off
Trade exit information labels. Can be turned on and off
NOTE: Trade drawings will only be applicable when using overlay strategies
Alerting:
Alerts on LONG and SHORT trade entries
Debugging:
Includes section with useful debugging techniques
Strategy conditions
Trade entry:
LONG
C1: SSL Hybrid baseline is BLUE
C2: SSL Channel crosses up (green above red)
C3: Wave Trend crosses up (represented by pink candle body)
C4: Entry candle height is not greater than configured threshold
C5: Entry candle is inside Keltner Channel (wicks or body depending on configuration)
C6: Take Profit target does not touch EMA (represents resistance)
SHORT
C1: SSL Hybrid baseline is RED
C2: SSL Channel crosses down (red above green)
C3: Wave Trend crosses down (represented by orange candle body)
C4: Entry candle height is not greater than configured threshold
C5: Entry candle is inside Keltner Channel (wicks or body depending on configuration)
C6: Take Profit target does not touch EMA (represents support)
Trade exit:
Stop Loss: Size configurable with NNFX ATR multiplier
Take Profit: Calculated from Stop Loss using R:R ratio
Credits
Strategy is based on the YouTube video "This Unique Strategy Made 47% Profit in 2.5 Months " by TradeSmart.
It combines the following indicators to determine trade entry/exit conditions:
Wave Trend: Indicator: WaveTrend Oscillator by @LazyBear
SSL Channel: SSL channel by @ErwinBeckers
SSL Hybrid: SSL Hybrid by @Mihkel00
Keltner Channels: Keltner Channels Bands by @ceyhun
Candle Height: Candle Height in Percentage - Columns by @FreeReveller
NNFX ATR: NNFX ATR by @sueun123

Oscillating SSL Channel Strategy - 3m & 5m Time FramesThis script is pretty self-explanatory. I will suggest trying some different exits to get that win rate above 20% (I'd start with Take Profit and Stop Loss percentages).
Enjoy!
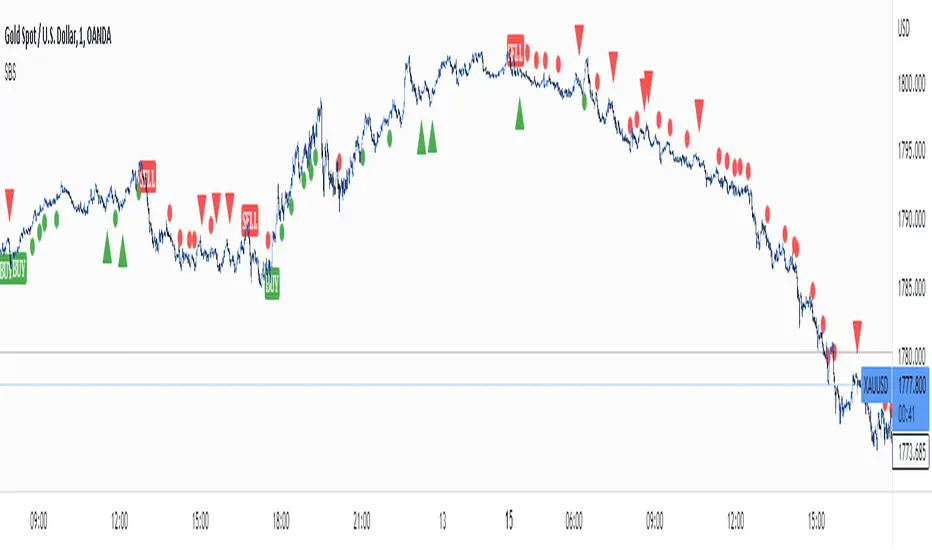
Simple Buy and Sell SignalsThis is a Simple Indicator which shows buy and sell signals based on MACD and SSL channel.
It is not a Holy Grail Indicator. It shows a lot of false signals when the market is Consolidation Zone.
So don't use this indicator to place trades based on signals given by the indicator.
Use this as a confluence along with your technical analysis
On lower timeframes there are a lot of signals so to eliminate false signals , get a signal on higher timeframe and place a trade in the direction of the trend on lower timeframe.
Hope you'll find this helpful. Enjoy👍.
SSL channel SubChartThis is an updated version of ErwinBeckers SSL Channel its been updated to version 4 of pine script and also made it as a subchart to keep the price chart clutter free.

SSL HYBRID AdvancedSSL HYBRID Advanced
SSL Hybrid is an Advanced version of the default SSL Hybrid by Mihkel00.
Multiple Indicators
MACD Crossover Signals
EMA 200
Bollinger Band
Bollinger Band Squeeze
ADX Crossover and ADX level
CCI Over Brought /Sold
Stochastic Over Brought /Sold
RSI Over Brought /Sold
CREDITS
QQE MOD byMihkel00
SSL Hybrid by Mihkel00
Waddah Attar Explosion by shayankm
Support Resistance LonesomeTheBlue
Indicators On Chart
QQE MOD is plotted as Dot below and above the candle and also as Background
QQE line is plotted and can be used as crossover to find trend. Flat movement of QQE is Sideways
Weak ADX is plotted as a Background color. Same can be verified using Bollinger band Squeeze.
EMA crossover can be plotted by selecting MTF MA(multi time frame moving average indicator) Area plot is provided.
CCI , Stochastic, RSI signals provided in the table option
WAE (volume indicator ) is shown in Table
EMA 200 is plotted and color Represents ADX level and direction. Plots on EMA 200 are ADX crossovers
MACD crossovers are represented by Triangles above and below Candles
Support Resistance levels are plotted (change settings)
Pivot Points are plotted (change settings)
Bollinger Bands Plotted
EMA 20 and EMA 50 plotted with AREA for additional confirmation
Buy: When the table option shows completely Blue signals in all indicators
Sell: When the table option shows completely Pink signals in all indicators
WARNING not recommended for lower time frames. Use at your own Risk.
Updates will be released shortly if any. please provide your suggestions to make it more functional indicator.

Waddah Attar Explosion V3 [NHK] -Bollinger - MACDWaddah Attar Explosion Version3 indicator to work in Forex and Crypto, This indicator oscillates above and below zero and the Bollinger band is plotted over the MACD Histogram to take quick decisions, Colors are changed for enhanced look. dead zone is plotted in a background area and option is provided to hide dead zone. One can easily detect sideways market movement using Bollinger band and volume. when volume is in between Bollinger band no trades are to be taken as volume is low and market moving in sideways
credits to: @shayankm and @LazyBear
Read the main description below...
- - - - - - - - - - - - - - - - - - - - - - - - - - - - - - - - - - - - - - -
This is a port of a famous MT4 indicator. This indicator uses MACD /BB to track trend direction and strength. Author suggests using this indicator on 30mins.
Explanation from the indicator developer:
"Various components of the indicator are:
Dead Zone Line: Works as a filter for weak signals. Do not trade when the up or down histogram is in between Dead Zone.
Histograms:
- Pink histogram shows the current down trend.
- Blue histogram shows the current up trend.
- Sienna line / Bollinger Band shows the explosion in price up or down.
Signal for ENTER_BUY: All the following conditions must be met.
- Blue histogram is raising.
- Blue histogram above Explosion line.
- Explosion line raising.
- Both Blue histogram and Explosion line above DeadZone line.
Signal for EXIT_BUY: Exit when Blue histogram crosses below Explosion line / Bollinger Band.
Signal for ENTER_SELL: All the following conditions must be met.
- Pink histogram is raising.
- Pink histogram above Explosion line.
- Explosion line raising.
- Both Pink histogram and Explosion line above DeadZone line.
Signal for EXIT_SELL: Exit when Pink histogram crosses below Explosion line.
All of the parameters are configurable via options page. You may have to tune it for your instrument.

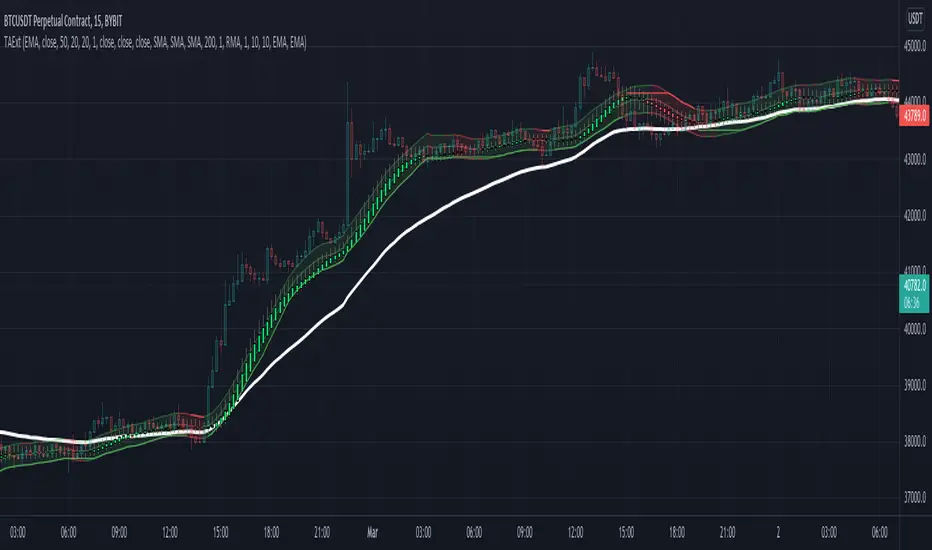
TAExtLibrary "TAExt"
Indicator functions can be used in other indicators and strategies. This will be extended by time with indicators I use in my strategies and studies.
atrwo(length, stdev_length, stdev_mult) ATR without outliers
Parameters:
length : The length of the ATR
stdev_length : The length of the standard deviation, used for detecting outliers
stdev_mult : The multiplier of the standard deviation, used for detecting outliers
Returns: The ATR value
atrwma(src, period, type, atr_length, stdev_length, stdev_mult) ATR without outlier weighted moving average
Parameters:
src : The source of the moving average
period : The period of the moving average
type : The type of the moving average, possible values: SMA, EMA, RMA
atr_length : The length of the ATR
stdev_length : The length of the standard deviation, used for detecting outliers
stdev_mult : The multiplier of the standard deviation, used for detecting outliers
Returns: The moving average value
jma(src, period, phase, power) Jurik Moving Average
Parameters:
src : The source of the moving average
period : The period of the moving average calculation
phase : The phase of jurik MA calculation (-100..100)
power : The power of jurik MA calculation
Returns: The Jurik MA series
anyma(src, period, type, offset, sigma, phase, power) Moving Average by type
Parameters:
src : The source of the moving average
period : The period of the moving average calculation
type : The type of the moving average
offset : Used only by ALMA, it is the ALMA offset
sigma : Used only by ALMA, it is the ALMA sigma
phase : The phase of jurik MA calculation (-100..100)
power : The power of jurik MA calculation
Returns: The moving average series
wae(macd_src, macd_fast_length, macd_slow_length, macd_sensitivity, bb_base_src, bb_upper_src, bb_lower_src, bb_length, bb_mult, dead_zone_length, dead_zone_mult) Waddah Attar Explosion (WAE)
Parameters:
macd_src : The source series used by MACD
macd_fast_length : The fast MA length of the MACD
macd_slow_length : The slow MA length of the MACD
macd_sensitivity : The MACD diff multiplier
bb_base_src : The source used by stdev
bb_upper_src : The source used by the upper Bollinger Band
bb_lower_src : The source used by the lower Bollinger Band
bb_length : The lenth for Bollinger Bands
bb_mult : The multiplier for Bollinger Bands
dead_zone_length : The ATR length for dead zone calculation
dead_zone_mult : The ATR multiplier for dead zone
Returns:
ssl(length, high_src, low_src) Semaphore Signal Level channel (SSL)
Parameters:
length : The length of the moving average
high_src : Source of the high moving average
low_src : Source of the low moving average
Returns:
adx(atr_length, di_length, adx_length, high_src, low_src, atr_ma_type, di_ma_type, adx_ma_type) Average Directional Index + Direction Movement Index (ADX + DMI)
Parameters:
atr_length : The length of ATR
di_length : DI plus and minus smoothing length
adx_length : ADX smoothing length
high_src : Source of the high moving average
low_src : Source of the low moving average
atr_ma_type : MA type of the ATR calculation
di_ma_type : MA type of the DI calculation
adx_ma_type : MA type of the ADX calculation
Returns:
SSL ChannelSSL Channel:
Multiple Moving Averages to choose from (SMA, EMA, SMMA (RMA), WMA, VWMA)
Option for a second SSL Channel
MTF

Price Action [Morty]This price action indicator uses the higher timeframe SSL channel to identify trends.
The long entry signal is a bullish candlestick pattern when the price retraces to EMA20 in an uptrend.
The short entry signal is a bearish candlestick pattern when the price retraces to the EMA20 in a downrend.
Currently, this indicator shows engulfing patterns, pin bar patterns, 2 bar reversal patterns and harami patterns.
It also shows a volatility squeeze signal when the Bollinger bands is within the Kelter channels.
The buy and sell signal can also be filter by the ADX indicator greater than a threshold.
You can set your stoploss to the previous low/high when you go long/short.
The risk/reward ratio could be 1 to 1.5.
This indicator can be used in any market.

SSL of MAsSSL of MAs let you try out a bunch of different moving averages on the SSL channel indicator. Red and green indicates where to buy and sell
The different moving averages is taken from @StephXAGs

SSL Off ChartThis is SSL channel, but displayed off chart.
I needed this for keep a clean chart during backtesting phases of NNFX algos.
Different display modes.
The "Colors Only" display mode is well adapted for SSL use as an exit indicator or a second confirmation indicator :
Let me know if you want a feature added :p

SSL Crossover + MA choiceThis indicator builds on the SSL channel code by ErwinBeckers @
I have added options for diff MA's to be used in the SSL channel and crossover indicators for buy/sell signals
default MA is set to Arnaud Legaux, but you can set it to whatever you like - original was a Simple Moving Average by ErwinBeckers
The indicator will not repaint as the signals are drawn after close of crossover candles
Let me know if you have any suggestions - happy to add more functionality

SSL HybridThis script is designed for the NNFX Method, so it is recommended for Daily charts only.
Tried to implement a few VP NNFX Rules
This script has a SSL / Baseline (you can choose between the SSL or MA), a secondary SSL for continiuation trades and a third SSL for exit trades.
Alerts added for Baseline entries, SSL2 continuations, Exits.
Baseline has a Keltner Channel setting for "in zone" Gray Candles
Added "Candle Size > 1 ATR" Diamonds from my old script with the criteria of being within Baseline ATR range.
Credits go to:
Strategy causecelebre www.tradingview.com
SSL Channel ErwinBeckers www.tradingview.com
Moving Averages jiehonglim www.tradingview.com
Moving Averages everget www.tradingview.com
"Many Moving Averages" script Fractured www.tradingview.com

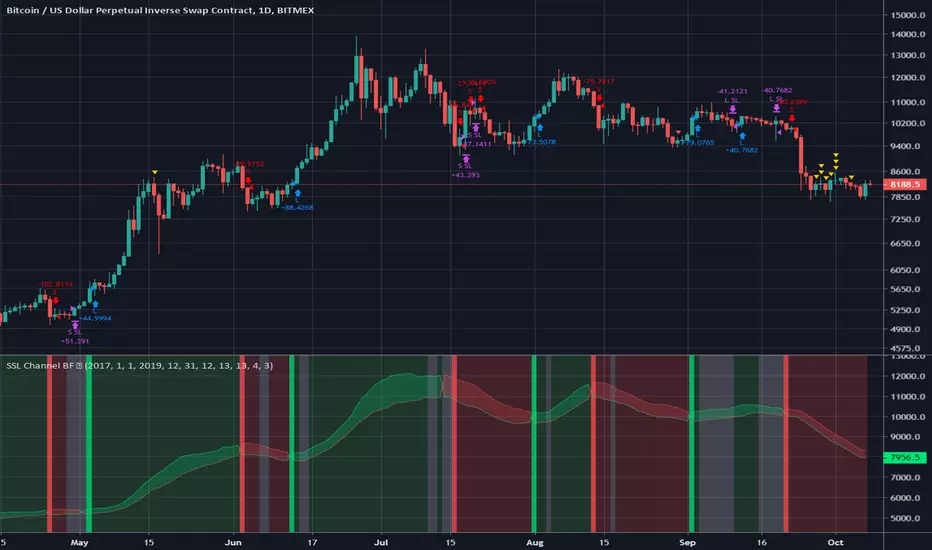
SSL Chaikin BF 🚀Combined my earlier SSL Channel script with the Chaikin Money Flow indicator.
Link to the SSL Channel script here:
INSTRUCTIONS
Look at the background, the signals are represented by the colors.
Bright green = long signal from SSL Channel
Bright blue = long signal from Chaikin Money Flow
Bright red = short signal from SSL Channel
Bright orange = short signal from Chaikin Money Flow
Green = we should be in a long from one of the signals - ok to enter back in if we get stopped out and still green
Red = we should be in a short from one of the signals - ok to enter back in if we get stopped out and still red
White = no trade
SIGNAL GENERATION
The SSL calculation prints a channel on the chart consisting of 2 lines.
This strategy gives a Long signal when price closes above the top of these 2 lines and a Short signal when it closes below the bottom.
A long signal occurs when EITHER we get an SSL long cross OR the Chaikin MF crosses above the upper threshold.
A short signal occurs when EITHER we get an SSL short cross OR the Chaikin MF crosses below the lower threshold (see settings to adjust upper and lower threshold).
STOP LOSS AND RE-ENTRY
We use a fixed stop loss of 2%
If we get stopped out but we still have the conditions for our trade (i.e. we get stopped out of a long but the next candle still shows a long condition after closing) then we re-enter.
Note: The SSL signals are generated on a cross of the price and the channels but there is still an active long signal as long as price stays above the upper band, same for below the lower band for short. Similarly, the Chaikin signal occurs as long as the Chaikin line is above the upper threshold (or below the lower threshold if short).
Tested and optimised for XBT/USD on Bitmex.

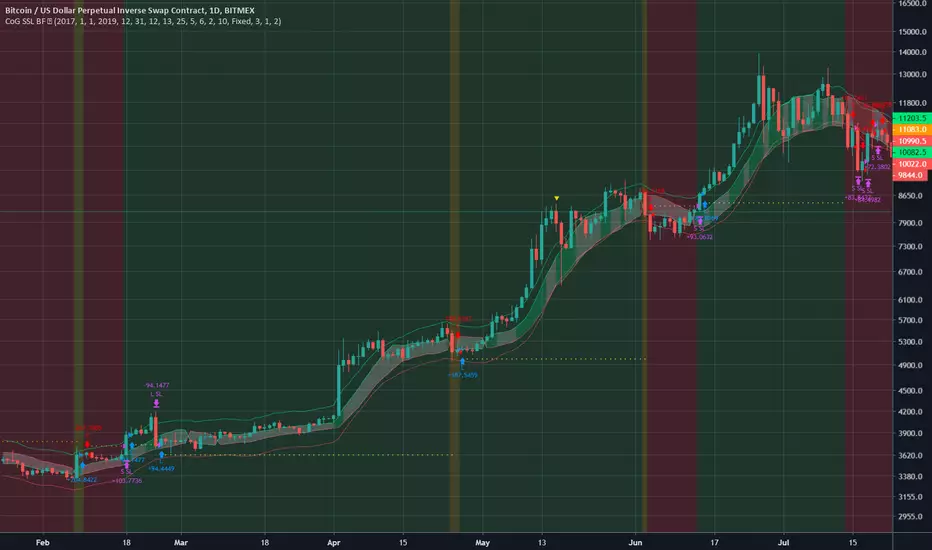
CoG SSL BF 🚀In this strategy I combine my Center of Gravity script with my SSL Channel script.
The conditions for a long signal are if either:
Center of Gravity long is satisfied
Or
SSL Channel long is satisfied AND we are not in a sideways period.
The conditions for a short signal are if either:
Center of Gravity short is satisfied
Or
SSL Channel short is satisfied AND we are not in a sideways period.
We use a dynamic stop loss based on ATR to determine optimum stop loss levels. These levels are printed on the chart in yellow and orange.
INSTRUCTIONS
Bright green background = go long
Bright red background = go short
Yellow dotted line = long stop loss
Orange dotted line = short stop loss
On the chart, the 2 outer lines are the Center of Gravity lines and the filled channel in the middle is the SSL channel.
If the channel is white, this is a no trade zone, unless either Center of Gravity long/short signal is satisfied.
If we get stopped out from a long and we still have a long condition present, we re-enter. Same for short.
SSL Channel BFSSL Channel Close is a great all-rounder based on 2 Simple Moving Averages, one of recent Highs, one of recent Lows.
The calculation prints a channel on the chart consisting of 2 lines.
This strategy gives a Long signal when price closes above the top of these 2 lines and a Short signal when it closes below the bottom.
Trading in choppy sideways markets can compound losses so we avoid that here by using recent ATR to determine relative volatility and refrain from trading when the background is White.
We use a basic 3% stop loss.
Charted on XBT/USD Bitmex Daily chart.
INSTRUCTIONS
Green = long
Red = short
White Background= No trade
The way I have set this strategy up is that if we get stopped out but we are still in a green or red background, we re-enter. Closing the trade only occurs on an opposing signal or if we get stopped out.

SSL Channel w/alertSSL Channel with cross alert when channels cross up or down. Built on ErwinBeckers SSL Channel script.