Round Number Analyzer v3Round Number Analyzer v3 is an indicator designed to analyze how price interacts with round number levels (levels spaced at fixed intervals in points or pips).
The indicator does not generate entry/exit signals, but provides detailed statistics to better understand market dynamics around these key levels.
✨ Key Features
Cross Counting: detects every time the price crosses a round number level (up = Long, down = Short).
Continuations & Reversals: classifies each cross as:
Continuation: the move continues in the same direction as the previous sequence.
Reversal: the move changes direction compared to the previous sequence.
Sequence Classification (L1…L5+): each level is labelled based on its position within the consecutive cross sequence:
L1 = first level of the sequence,
L2 = second consecutive,
…
L5+ = fifth or higher.
Comprehensive Stats Table (top right corner):
Total crosses (Long, Short, Totals).
Total continuations + breakdown by L1…L5+.
Total reversals + breakdown by L1…L5+.
Percentages calculated against the proper denominator, displayed directly inside the cells next to the absolute values.
Date range of analysis (user-defined).
Customizable Step: Works in both points and pips, making the indicator suitable for indices and forex.
⚙️ Main Inputs
Start date / End date → sets the analysis period.
Step mode → Points or Pips.
Step value → distance between round levels.
Pip size → pip size (default = 0.0001, typical for forex).
📈 How to Interpret
A high continuation percentage after L1–L2 suggests the market tends to extend multiple times beyond the first breakout levels.
Higher reversal percentages at advanced levels (L4–L5+) may signal trend exhaustion.
The analysis helps estimate the probability of continuation or reversal depending on how many consecutive levels have already been crossed.
🔎 Practical Applications
Support for breakout or mean-reversion strategies.
Comparative analysis across different markets (e.g. indices vs forex) or different time periods.
📝 Notes
The indicator is timeframe-robust, as it accounts for multiple steps within the same candle, ensuring results do not depend on the selected timeframe (except for TradingView’s historical data limits).
It does not provide automatic trading signals, but serves as a quantitative analysis tool to refine your strategies.
---
Round Number Analyzer v3 è un indicatore pensato per analizzare come il prezzo interagisce con i livelli di round number (livelli a distanza fissa in punti o pips).
L’indicatore non genera segnali di ingresso/uscita, ma fornisce statistiche dettagliate utili per comprendere la dinamica del mercato attorno a questi livelli.
✨ Funzionalità principali
Conteggio dei Cross: rileva ogni volta che il prezzo attraversa un livello round (verso l’alto = Long, verso il basso = Short).
Continuations & Reversals: classifica ogni attraversamento come:
Continuation: il movimento prosegue nella stessa direzione della sequenza precedente.
Reversal: il movimento inverte la direzione rispetto alla sequenza precedente.
Classificazione per sequenza (L1…L5+): ogni livello è etichettato in base alla sua posizione nella sequenza di cross consecutivi:
L1 = primo livello della sequenza,
L2 = secondo consecutivo,
…
L5+ = quinto o superiore.
Statistiche complete in tabella (in alto a destra):
Cross totali (Long, Short, Totals).
Continuations totali + breakdown per L1…L5+.
Reversals totali + breakdown per L1…L5+.
Percentuali calcolate sul denominatore corretto, mostrate direttamente dentro le celle accanto ai valori assoluti.
Date range di analisi (impostabile dall’utente).
Step personalizzabile: puoi lavorare sia in punti che in pips, così l’indicatore è adatto sia per indici che per forex.
⚙️ Input principali
Start date / End date → imposta l’intervallo temporale di analisi.
Step mode → punti o pips.
Step value → ampiezza tra i livelli round.
Pip size → dimensione del pip (default = 0.0001, tipico per il forex).
📈 Come interpretarlo
Una percentuale di continuation molto alta dopo L1–L2 indica che il mercato tende a proseguire più volte oltre i primi livelli di breakout.
Percentuali di reversal più elevate nei livelli avanzati (L4–L5+) possono suggerire esaurimento della spinta.
L’analisi permette di stimare la probabilità che un movimento in corso continui o si inverta in base a quanti livelli sono già stati attraversati consecutivamente.
🔎 Applicazioni pratiche
Supporto per strategie di breakout o mean reversion.
Analisi comparativa tra mercati (es. indici vs forex) o tra periodi temporali diversi.
📝 Note
L’indicatore è timeframe-robust: il conteggio tiene conto di multipli step dentro la stessa candela, così i risultati non dipendono dal timeframe scelto (salvo i limiti di caricamento storico di TradingView).
Non fornisce segnali operativi automatici, ma è un tool di analisi quantitativa per affinare le proprie strategie.
Statistics

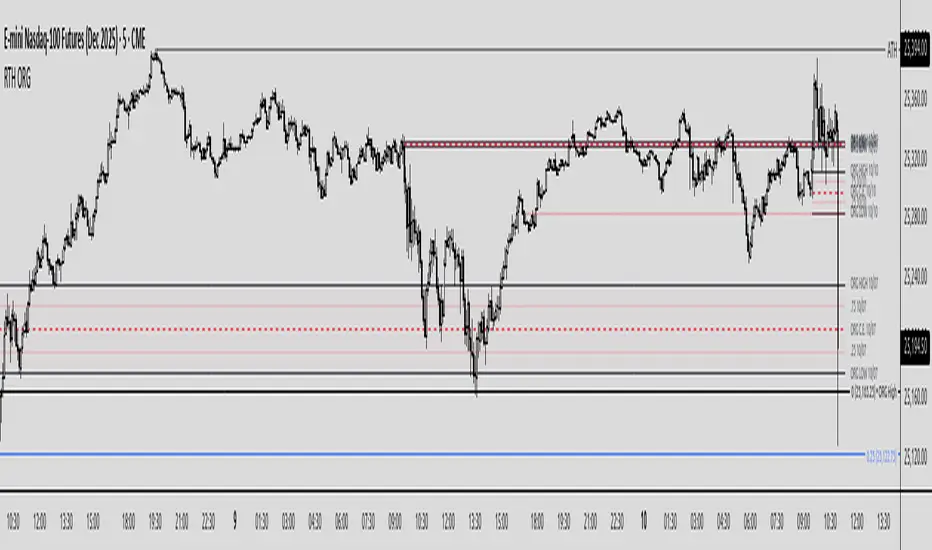
Regular Trading Hours Opening Range Gap (RTH ORG)### Regular Trading Hours (RTH) Gap Indicator with Quartile Levels
**Overview**
Discover overnight gaps in index futures like ES, YM, and NQ, or stocks like SPY, with this enhanced Pine Script v6 indicator. It visualizes the critical gap between the previous RTH close (4:15 PM ET for futures, 4:00 PM for SPY) and the next RTH open (9:30 AM ET), helping traders spot potential price sensitivity formed during after-hours trading.
**Key Features**
- **Standard Gap Boxes**: Semi-transparent boxes highlight the gap range, with optional text labels showing day-of-week and "RTH" identifier.
- **Midpoint Line**: A customizable dashed line at the 50% level, with price labels for quick reference.
- **New: Quartile Lines (25% & 75%)**: Dotted lines (default width 1) mark the quarter and three-quarter points within the gap, ideal for finer intraday analysis. Toggle on/off, adjust style/color/width, and add labels.
- **High-Low Gap Variant**: Optional boxes and midlines for gaps between the prior close's high/low and the open's high/low—perfect for wick-based overlaps on lower timeframes (5-min or below recommended).
- **RTH Close Lines**: Extend previous close levels with dotted lines and price tags.
- **Customization Galore**: Extend elements right, limit historical displays (default: 3 gaps), no-plot sessions (e.g., avoid weekends), and time offsets for non-US indices.
**How to Use**
Apply to 15-min or lower charts for best results. Toggle "extend right" for ongoing levels. SPY auto-adjusts for its 4 PM close.
Tested on major indices—enhance your gap trading strategy today! Questions? Drop a comment.
Thanks to twingall for supplying the original code.
Thanks to The Inner Circle Trader (ICT) for the logical and systematic application.
Brownian Motion Probabilistic Forecasting (Time Adaptive)Probabilistic Price Forecast Indicator
Overview
The Probabilistic Price Forecast is an advanced technical analysis tool designed for the TradingView platform. Instead of predicting a single future price, this indicator uses a Monte Carlo simulation to model thousands of potential future price paths, generating a cone of possibilities and calculating the probability of specific outcomes.
This allows traders to move beyond simple price targets and ask more sophisticated questions, such as: "What is the probability that this stock will increase by 5% over the next 24 hours?"
Core Concept: Geometric Brownian Motion
The indicator's forecasting model is built on the principles of Geometric Brownian Motion (GBM) , a widely accepted mathematical model for describing the random movements of financial asset prices. The core idea is that the next price step is a function of the asset's historical trend (drift), its volatility, and a random "shock."
The formula used to project each price step in the simulation is:
next_price = current_price * exp( (μ - (σ²/2))Δt + σZ√(Δt) )
Where:
μ (mu) represents the drift , which is the average historical return.
σ (sigma) represents the volatility , measured by the standard deviation of historical returns.
Z is a random variable from a standard normal distribution, representing the random "shock" or new information affecting the price.
Δt (delta t) is the time step for each projection.
How It Works
The indicator performs a comprehensive analysis on the most recent bar of the chart:
**Historical Analysis**: It first analyzes a user-defined historical period (e.g., the last 240 hours of price data) to calculate the asset's historical drift (μ) and volatility (σ) from its logarithmic returns.
**Monte Carlo Simulation**: It then runs thousands of simulations (e.g., 2000) of future price paths over a specified forecast period (e.g., the next 24 hours). Each path is unique due to the random shock (Z) applied at every step.
**Probability Distribution**: After all simulations are complete, it collects the final price of each path and sorts them to build a probability distribution of potential outcomes.
**Visualization and Signaling**: Finally, it visualizes this distribution on the chart and generates signals based on the user's criteria.
Key Features & Configuration
The indicator is highly configurable, allowing you to tailor its analysis to your specific needs.
Time-Adaptive Periods
The lookback and forecast periods are defined in hours , not bars. The script automatically converts these hour-based inputs into the correct number of bars based on the chart's current timeframe, ensuring the analysis remains consistent across different chart resolutions.
Forecast Quartiles
You can visualize the forecast as a "cone of probability" on the chart. The indicator draws lines and a shaded area representing the price levels for different quartiles (percentiles) of the simulation results. By default, this shows the range between the 25th and 95th percentiles.
Independent Bullish and Bearish Signals
The indicator allows you to set independent criteria for bullish and bearish signals, providing greater flexibility. You can configure:
A bullish signal for an X% confidence of a Y% price increase.
A bearish signal for a W% confidence of a Z% price decrease.
For example, you can set it to alert you for a 90% chance of a 2% drop, while simultaneously looking for a 60% chance of a 10% rally.
How to Interpret the Indicator
The Forecast Cone : The blue shaded area on the chart represents the probable range of future prices. The width of the cone indicates the expected volatility; a wider cone means higher uncertainty. The price labels on the right side of the cone show the calculated percentile levels at the end of the forecast period.
Green Signal Label : A green "UP signal" label appears when the probability of the price increasing by your target percentage exceeds your defined confidence level.
Red Signal Label : A red "DOWN signal" label appears when the probability of the price decreasing by your target percentage exceeds your confidence level.
This tool provides a statistical edge for understanding future possibilities but should be used in conjunction with other analysis techniques.


Aggregated Scores Oscillator [Alpha Extract]A sophisticated risk-adjusted performance measurement system that combines Omega Ratio and Sortino Ratio methodologies to create a comprehensive market assessment oscillator. Utilizing advanced statistical band calculations with expanding and rolling window analysis, this indicator delivers institutional-grade overbought/oversold detection based on risk-adjusted returns rather than traditional price movements. The system's dual-ratio aggregation approach provides superior signal accuracy by incorporating both upside potential and downside risk metrics with dynamic threshold adaptation for varying market conditions.
🔶 Advanced Statistical Framework
Implements dual statistical methodologies using expanding and rolling window calculations to create adaptive threshold bands that evolve with market conditions. The system calculates cumulative statistics alongside rolling averages to provide both historical context and current market regime sensitivity with configurable window parameters for optimal performance across timeframes.
🔶 Dual Ratio Integration System
Combines Omega Ratio analysis measuring excess returns versus deficit returns with Sortino Ratio calculations focusing on downside deviation for comprehensive risk-adjusted performance assessment. The system applies configurable smoothing to both ratios before aggregation, ensuring stable signal generation while maintaining sensitivity to regime changes.
// Omega Ratio Calculation
Excess_Return = sum((Daily_Return > Target_Return ? Daily_Return - Target_Return : 0), Period)
Deficit_Return = sum((Daily_Return < Target_Return ? Target_Return - Daily_Return : 0), Period)
Omega_Ratio = Deficit_Return ≠ 0 ? (Excess_Return / Deficit_Return) : na
// Sortino Ratio Framework
Downside_Deviation = sqrt(sum((Daily_Return < Target_Return ? (Daily_Return - Target_Return)² : 0), Period) / Period)
Sortino_Ratio = (Mean_Return / Downside_Deviation) * sqrt(Annualization_Factor)
// Aggregated Score
Aggregated_Score = SMA(Omega_Ratio, Omega_SMA) + SMA(Sortino_Ratio, Sortino_SMA)
🔶 Dynamic Band Calculation Engine
Features sophisticated threshold determination using both expanding historical statistics and rolling window analysis to create adaptive overbought/oversold levels. The system incorporates configurable multipliers and sensitivity adjustments to optimize signal timing across varying market volatility conditions with automatic band convergence logic.
🔶 Signal Generation Framework
Generates overbought conditions when aggregated score exceeds adjusted upper threshold and oversold conditions below lower threshold, with neutral zone identification for range-bound markets. The system provides clear binary signal states with background zone highlighting and dynamic oscillator coloring for intuitive market condition assessment.
🔶 Enhanced Visual Architecture
Provides modern dark theme visualization with neon color scheme, dynamic oscillator line coloring based on signal states, and gradient band fills for comprehensive market condition visualization. The system includes zero-line reference, statistical band plots, and background zone highlighting with configurable transparency levels.
snapshot
🔶 Risk-Adjusted Performance Analysis
Utilizes target return parameters for customizable risk assessment baselines, enabling traders to evaluate performance relative to specific return objectives. The system's focus on downside deviation through Sortino analysis provides superior risk-adjusted signals compared to traditional volatility-based oscillators that treat upside and downside movements equally.
🔶 Multi-Timeframe Adaptability
Features configurable calculation periods and rolling windows to optimize performance across various timeframes from intraday to long-term analysis. The system's statistical foundation ensures consistent signal quality regardless of timeframe selection while maintaining sensitivity to market regime changes through adaptive band calculations.
🔶 Performance Optimization Framework
Implements efficient statistical calculations with optimized variable management and configurable smoothing parameters to balance responsiveness with signal stability. The system includes automatic band adjustment mechanisms and rolling window management for consistent performance across extended analysis periods.
This indicator delivers sophisticated risk-adjusted market analysis by combining proven statistical ratios in a unified oscillator framework. Unlike traditional overbought/oversold indicators that rely solely on price movements, the ASO incorporates risk-adjusted performance metrics to identify genuine market extremes based on return quality rather than price volatility alone. The system's adaptive statistical bands and dual-ratio methodology provide institutional-grade signal accuracy suitable for systematic trading approaches across cryptocurrency, forex, and equity markets with comprehensive visual feedback and configurable risk parameters for optimal strategy integration.

Volume Based Sampling [BackQuant]Volume Based Sampling
What this does
This indicator converts the usual time-based stream of candles into an event-based stream of “synthetic” bars that are created only when enough trading activity has occurred . You choose the activity definition:
Volume bars : create a new synthetic bar whenever the cumulative number of shares/contracts traded reaches a threshold.
Dollar bars : create a new synthetic bar whenever the cumulative traded dollar value (price × volume) reaches a threshold.
The script then keeps an internal ledger of these synthetic opens, highs, lows, closes, and volumes, and can display them as candles, plot a moving average calculated over the synthetic closes, mark each time a new sample is formed, and optionally overlay the native time-bars for comparison.
Why event-based sampling matters
Markets do not release information on a clock: activity clusters during news, opens/closes, and liquidity shocks. Event-based bars normalize for that heteroskedastic arrival of information: during active periods you get more bars (finer resolution); during quiet periods you get fewer bars (coarser resolution). Research shows this can reduce microstructure pathologies and produce series that are closer to i.i.d. and more suitable for statistical modeling and ML. In particular:
Volume and dollar bars are a common event-time alternative to time bars in quantitative research and are discussed extensively in Advances in Financial Machine Learning (AFML). These bars aim to homogenize information flow by sampling on traded size or value rather than elapsed seconds.
The Volume Clock perspective models market activity in “volume time,” showing that many intraday phenomena (volatility, liquidity shocks) are better explained when time is measured by traded volume instead of seconds.
Related market microstructure work on flow toxicity and liquidity highlights that the risk dealers face is tied to information intensity of order flow, again arguing for activity-based clocks.
How the indicator works (plain English)
Choose your bucket type
Volume : accumulate volume until it meets a threshold.
Dollar Bars : accumulate close × volume until it meets a dollar threshold.
Pick the threshold rule
Dynamic threshold : by default, the script computes a rolling statistic (mean or median) of recent activity to set the next bucket size. This adapts bar size to changing conditions (e.g., busier sessions produce more frequent synthetic bars).
Fixed threshold : optionally override with a constant target (e.g., exactly 100,000 contracts per synthetic bar, or $5,000,000 per dollar bar).
Build the synthetic bar
While a bucket fills, the script tracks:
o_s: first price of the bucket (synthetic open)
h_s: running maximum price (synthetic high)
l_s: running minimum price (synthetic low)
c_s: last price seen (synthetic close)
v_s: cumulative native volume inside the bucket
d_samples: number of native bars consumed to complete the bucket (a proxy for “how fast” the threshold filled)
Emit a new sample
Once the bucket meets/exceeds the threshold, a new synthetic bar is finalized and stored. If overflow occurs (e.g., a single native bar pushes you past the threshold by a lot), the code will emit multiple synthetic samples to account for the extra activity.
Maintain a rolling history efficiently
A ring buffer can overwrite the oldest samples when you hit your Max Stored Samples cap, keeping memory usage stable.
Compute synthetic-space statistics
The script computes an SMA over the last N synthetic closes and basic descriptors like average bars per synthetic sample, mean and standard deviation of synthetic returns, and more. These are all in event time , not clock time.
Inputs and options you will actually use
Data Settings
Sampling Method : Volume or Dollar Bars.
Rolling Lookback : window used to estimate the dynamic threshold from recent activity.
Filter : Mean or Median for the dynamic threshold. Median is more robust to spikes.
Use Fixed? / Fixed Threshold : override dynamic sizing with a constant target.
Max Stored Samples : cap on synthetic history to keep performance snappy.
Use Ring Buffer : turn on to recycle storage when at capacity.
Indicator Settings
SMA over last N samples : moving average in synthetic space . Because its index is sample count, not minutes, it adapts naturally: more updates in busy regimes, fewer in quiet regimes.
Visuals
Show Synthetic Bars : plot the synthetic OHLC candles.
Candle Color Mode :
Green/Red: directional close vs open
Volume Intensity: opacity scales with synthetic size
Neutral: single color
Adaptive: graded by how large the bucket was relative to threshold
Mark new samples : drop a small marker whenever a new synthetic bar prints.
Comparison & Research
Show Time Bars : overlay the native time-based candles to visually compare how the two sampling schemes differ.
How to read it, step by step
Turn on “Synthetic Bars” and optionally overlay “Time Bars.” You will see that during high-activity bursts, synthetic bars print much faster than time bars.
Watch the synthetic SMA . Crosses in synthetic space can be more meaningful because each update represents a roughly comparable amount of traded information.
Use the “Avg Bars per Sample” in the info table as a regime signal. Falling average bars per sample means activity is clustering, often coincident with higher realized volatility.
Try Dollar Bars when price varies a lot but share count does not; they normalize by dollar risk taken in each sample. Volume Bars are ideal when share count is a better proxy for information flow in your instrument.
Quant finance background and citations
Event time vs. clock time : Easley, López de Prado, and O’Hara advocate measuring intraday phenomena on a volume clock to better align sampling with information arrival. This framing helps explain volatility bursts and liquidity droughts and motivates volume-based bars.
Flow toxicity and dealer risk : The same authors show how adverse selection risk changes with the intensity and informativeness of order flow, further supporting activity-based clocks for modeling and risk management.
AFML framework : In Advances in Financial Machine Learning , event-driven bars such as volume, dollar, and imbalance bars are presented as superior sampling units for many ML tasks, yielding more stationary features and fewer microstructure distortions than fixed time bars. ( Alpaca )
Practical use cases
1) Regime-aware moving averages
The synthetic SMA in event time is not fooled by quiet periods: if nothing of consequence trades, it barely updates. This can make trend filters less sensitive to calendar drift and more sensitive to true participation.
2) Breakout logic on “equal-information” samples
The script exposes simple alerts such as breakout above/below the synthetic SMA . Because each bar approximates a constant amount of activity, breakouts are conditioned on comparable informational mass, not arbitrary time buckets.
3) Volatility-adaptive backtests
If you use synthetic bars as your base data stream, most signal rules become self-paced : entry and exit opportunities accelerate in fast markets and slow down in quiet regimes, which often improves the realism of slippage and fill modeling in research pipelines (pair this indicator with strategy code downstream).
4) Regime diagnostics
Avg Bars per Sample trending down: activity is dense; expect larger realized ranges.
Return StdDev (synthetic) rising: noise or trend acceleration in event time; re-tune risk.
Interpreting the info panel
Method : your sampling choice and current threshold.
Total Samples : how many synthetic bars have been formed.
Current Vol/Dollar : how much of the next bucket is already filled.
Bars in Bucket : native bars consumed so far in the current bucket.
Avg Bars/Sample : lower means higher trading intensity.
Avg Return / Return StdDev : return stats computed over synthetic closes .
Research directions you can build from here
Imbalance and run bars
Extend beyond pure volume or dollar thresholds to imbalance bars that trigger on directional order flow imbalance (e.g., buy volume minus sell volume), as discussed in the AFML ecosystem. These often further homogenize distributional properties used in ML. alpaca.markets
Volume-time indicators
Re-compute classical indicators (RSI, MACD, Bollinger) on the synthetic stream. The premise is that signals are updated by traded information , not seconds, which may stabilize indicator behavior in heteroskedastic regimes.
Liquidity and toxicity overlays
Combine synthetic bars with proxies of flow toxicity to anticipate spread widening or volatility clustering. For instance, tag synthetic bars that surpass multiples of the threshold and test whether subsequent realized volatility is elevated.
Dollar-risk parity sampling for portfolios
Use dollar bars to align samples across assets by notional risk, enabling cleaner cross-asset features and comparability in multi-asset models (e.g., correlation studies, regime clustering). AFML discusses the benefits of event-driven sampling for cross-sectional ML feature engineering.
Microstructure feature set
Compute duration in native bars per synthetic sample , range per sample , and volume multiple of threshold as inputs to state classifiers or regime HMMs . These features are inherently activity-aware and often predictive of short-horizon volatility and trend persistence per the event-time literature. ( Alpaca )
Tips for clean usage
Start with dynamic thresholds using Median over a sensible lookback to avoid outlier distortion, then move to Fixed thresholds when you know your instrument’s typical activity scale.
Compare time bars vs synthetic bars side by side to develop intuition for how your market “breathes” in activity time.
Keep Max Stored Samples reasonable for performance; the ring buffer avoids memory creep while preserving a rolling window of research-grade data.

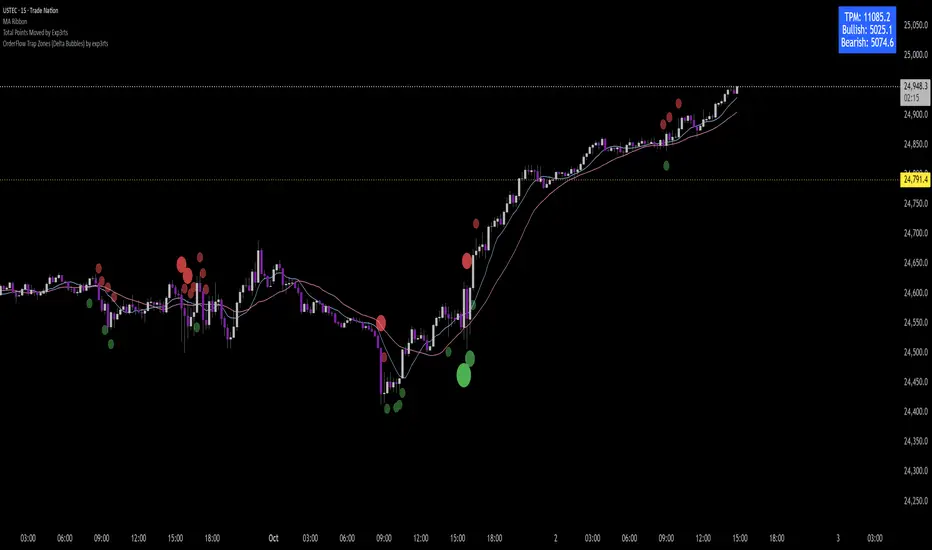
Total Points Range by exp3rtsThis indicator measures and displays the true intraday movement of a market by approximating tick-level activity using 1-second data aggregation. Instead of only looking at net candle movement, it sums every price change during a session, giving traders a more accurate picture of market effort and volatility.
Total Points Moved (TPM) – Captures the full distance traveled by price, not just the net gain/loss.
Bullish vs. Bearish Movement – Separates upward and downward moves so you can see who dominated the session.
Custom Sessions – Define your own session start/end times and time zone for precise tracking.
End-of-Session Summary – Automatically plots a label at session completion with totals for TPM, bullish, and bearish movement.
Visual Session Highlighting – Background shading makes it easy to see when the chosen session is active.
This tool is useful for:
Understanding the true effort vs. result of price movement
Comparing volatility across sessions
Identifying whether bulls or bears contributed more to market swings
Supporting order flow and tick-based trading strategies

Portfolio Simulator & BacktesterMulti-asset portfolio simulator with different metrics and ratios, DCA modeling, and rebalancing strategies.
Core Features
Portfolio Construction
Up to 5 assets with customizable weights (must total 100%)
Support for any tradable symbol: stocks, ETFs, crypto, indices, commodities
Real-time validation of allocations
Dollar Cost Averaging
Monthly or Quarterly contributions
Applies to both portfolio and benchmark for fair comparison
Model real-world investing behavior
Rebalancing
Four strategies: None, Monthly, Quarterly, Yearly
Automatic rebalancing to target weights
Transaction cost modeling (customizable fee %)
Key Metrics Table
CAGR: Annualized compound return (S&P 500 avg: ~10%)
Alpha: Excess return vs. benchmark (positive = outperformance)
Sharpe Ratio: Return per unit of risk (>1.0 is good, >2.0 excellent)
Sortino Ratio: Like Sharpe but only penalizes downside (better metric)
Calmar Ratio: CAGR / Max Drawdown (>1.0 good, >2.0 excellent)
Max Drawdown: Largest peak-to-trough decline
Win Rate: % of positive days (doesn't indicate profitability)
Visualization
Dual-chart comparison - Portfolio vs. Benchmark
Dollar or percentage view toggle
Customizable colors and line width
Two tables: Statistics + Asset Allocation
Adjustable table position and text size
🚀 Quick Start Guide
Enter 1-5 ticker symbols (e.g., SPY, QQQ, TLT, GLD, BTCUSD)
Make sure percentage weights total 100%
Choose date range (ensure chart shows full period - zoom out!)
Configure DCA and rebalancing (optional)
Select benchmark (default: SPX)
Analyze results in statistics table
💡 Pro Tips
Chart data matters: Load SPY or your longest-history asset as main chart
If you select an asset that was not available for the selected period, the chart will not show up! E.g. BTCUSD data: Only available from ~2017 onwards.
Transaction fees: 0.1% default (adjust to match your broker)
⚠️ Important Notes
Requires visible chart data (zoom out to show full date range)
Limited by each asset's historical data availability
Transaction fees and costs are modeled, but taxes/slippage are not
Past performance ≠ future results
Use for research and education only, not financial advice
Let me know if you have any suggestions to improve this simulator.

ITM SMA Crossover Strategy (Positioned Labels)This strategy tries to find the crossover of 10 sma in relation to 200 sma. Golden cross over is when 10 sma crosses above 200 sma. Death cross over is opposite.
As per the author - Heather Cullen ITM strategy - 'Buy' when the Golden cross is seen and 'exit' when Death cross is seen.

Lot Calculator EditableEdit the value of point to use it. Honnestly idk what can I say so don't read it.It's just an indicator to calculate your lot. Editable on the TP, SL and more

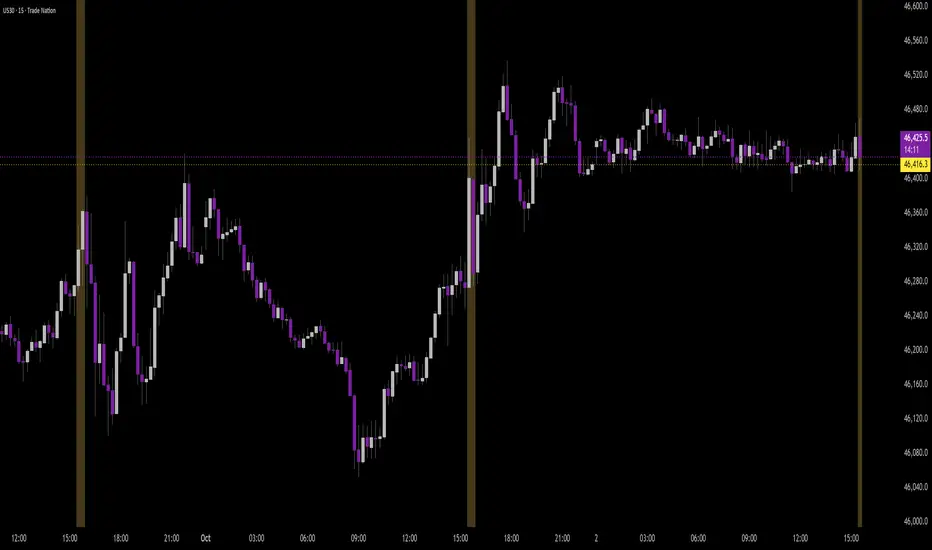
Time Range by exp3rtsTime Window highlights a custom time range directly on your chart, helping you focus on specific market sessions or trading hours.
Key Features:
Highlights a custom time range with a shaded background
Fully adjustable start and end time (hour & minute)
Supports multiple time zones (e.g., GMT, UTC, Europe/Berlin)
Optional market color shading inside the window (bull/bear neutral tone)
Use Cases:
Mark London Open, New York Session, or any session overlap
Focus on high-probability trading hours
Visualize your backtesting timeframe or algo activity window
Track premarket or after-hours activity for futures or indices
Customization:
Set the beginning and end time in your local or exchange time zone
Choose your timezone string (e.g., "GMT", "Etc/UTC", "America/New_York")
Automatically colors candles in the time window for easy visibility
Total Points Moved by exp3rtsThis lightweight utility tracks the total intraday range of price movement, giving you real-time insight into market activity.
It calculates:
🟩 Bullish Points – Total range from bullish candles (close > open)
🟥 Bearish Points – Total range from bearish candles (close < open)
🔁 Total Points Moved (TPM) – Sum of all high–low ranges for the day
Values are pulled from the 1-second chart for high precision and displayed in a compact tag in the top-right corner.

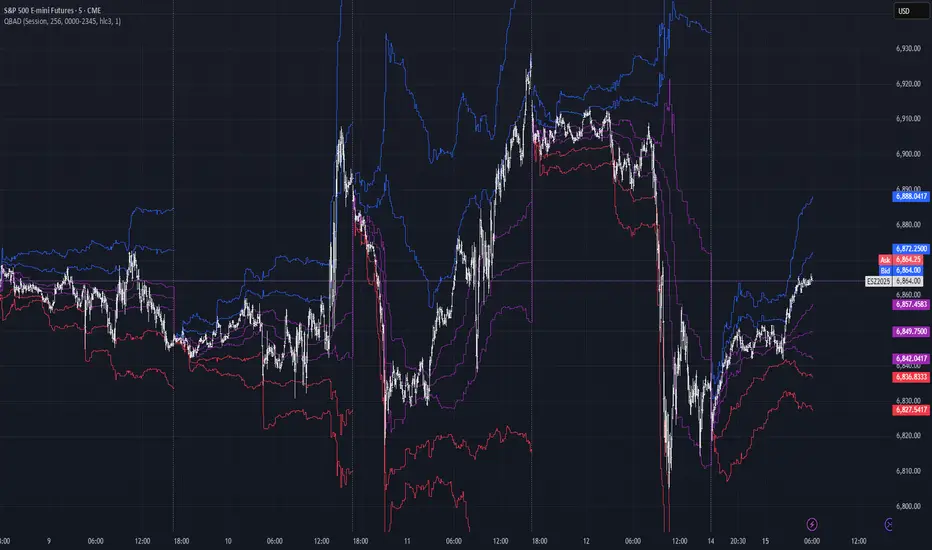
Quantile-Based Adaptive Detection🙏🏻 Dedicated to John Tukey. He invented the boxplot, and I finalized it.
QBAD (Quantile-Based Adaptive Detection) is ‘the’ adaptive (also optionally weighted = ready for timeseries) boxplot with more senseful fences. Instead of hardcoded multipliers for outer fences, I base em on a set of quantile-based asymmetry metrics (you can view it as an ‘algorithmic’ counter part of central & standardized moments). So outer bands are Not hardcoded, not optimized, not cross-validated etc, simply calculated at O(nlogn).
You can use it literally everywhere in any context with any continuous data, in any task that requires statistical control, novelty || outlier detection, without worrying and doubting the sense in arbitrary chosen thresholds. Obviously, given the robust nature of quantiles, it would fit best the cases where data has problems.
The thresholds are:
Basis: the model of the data (median in our case);
Deviations: represent typical spread around basis, together form “value” in general sense;
Extensions: estimate data’s extremums via combination of quantile-based asymmetry metrics without relying on actual blunt min and max, together form “range” / ”frame”. Datapoints outside the frame/range are novelties or outliers;
Limits: based also on quantile asymmetry metrics, estimate the bounds within which values can ‘ever’ emerge given the current data generating process stays the same, together form “field”. Datapoints outside the field are very rare, happen when a significant change/structural break happens in current data-generating process, or when a corrupt datapoint emerges.
…
The first part of the post is for locals xd, the second is for the wanderers/wizards/creators/:
First part:
In terms of markets, mostly u gotta worry about dem instruments that represent crypto & FX assets: it’s either activity hence data sources there are decentralized, or data is fishy.
For a higher algocomplexity cost O(nlong), unlike MBAD that is 0(n), this thing (a control system in fact) works better with ishy data (contaminated with wrong values, incomplete, missing values etc). Read about the “ breakdown point of an estimator ” if you wanna understand it.
Even with good data, in cases when you have multiple instruments that represent the same asset, e.g. CL and BRN futures, and for some reason you wanna skip constructing a proper index of em (while you should), QBAD should be better put on each instrument individually.
Another reason to use this algo-based rather than math-based tool, might be in cases when data quality is all good, but the actual causal processes that generate the data are a bit inconsistent and/or possess ‘increased’ activity in a way. SO in high volatility periods, this tool should provide better.
In terms of built-ins you got 2 weightings: by sequence and by inferred volume delta. The former should be ‘On’ all the time when you work with timeseries, unless for a reason you want to consciously turn it off for a reason. The latter, you gotta keep it ‘On’ unless you apply the tool on another dataset that ain’t got that particular additional dimension.
Ain’t matter the way you gonna use it, moving windows, cumulative windows with or without anchors, that’s your freedom of will, but some stuff stays the same:
Basis and deviations are “value” levels. From process control perspective, if you pls, it makes sense to Not only fade or push based on these levels, but to also do nothing when things are ambiguous and/or don’t require your intervention
Extensions and limits are extreme levels. Here you either push or fade, doing nothing is not an option, these are decisive points in all the meanings
Another important thing, lately I started to see one kind of trend here on tradingview as well and in general in near quant sources, of applying averages, percentiles etc ‘on’ other stationary metrics, so called “indicators”. And I mean not for diagnostic or development reasons, for decision making xd
This is not the evil crime ofc, but hillbilly af, cuz the metrics are stationary it means that you can model em, fit a distribution, like do smth sharper. Worst case you have Bayesian statistics armed with high density intervals and equal tail intervals, and even some others. All this stuff is not hard to do, if u aint’t doing it, it’s on you.
So what I’m saying is it makes sense to apply QBAD on returns ‘of your strategy’, on volume delta, but Not on other metrics that already do calculations over their own moving windows.
...
Second part:
Looks like some finna start to have lil suspicions, that ‘maybe’ after all math entities in reality are more like blueprints, while actual representations are physical/mechanical/algorithmic. Std & centralized moments is a math entity that represents location, scale & asymmetry info, and we can use it no problem, when things are legit and consistent especially. Real world stuff tho sometimes deviates from that ideal, so we need smth more handy and real. Add to the mix the algo counter part of means: quantiles.
Unlike the legacy quantile-based asymmetry metrics from the previous century (check quantile skewness & kurtosis), I don’t use arbitrary sets of quantiles, instead we get a binary pattern that is totally geometric & natural (check the code if interested, I made it very damn explicit). In spirit with math based central & standardized moments, each consequent pair is wider empathizing tail info more and more for each higher order metric.
Unlike the classic box plot, where inner thresholds are quartiles and the rest are based on em, here the basis is median (minimises L1), I base inner thresholds on it, and we continue the pattern by basing the further set of levels on the previous set. So unlike the classic box plot, here we have coherency in construction, symmetry.
Another thing to pay attention to, tho for some reason ain’t many talk about it, it’s not conceptually right to think that “you got data and you apply std moments on it”. No, you apply it to ‘centered around smth’ data. That ‘smth’ should minimize L2 error in case of math, L1 error in case of algo, and L0 error in case of learning/MLish/optimizational/whatever-you-cal-it stuff. So in the case of L0, that’s actually the ‘mode’ of KDE, but that’s for another time. Anyways, in case of L2 it’s mean, so we center data around mean, and apply std moments on residuals. That’s the precise way of framing it. If you understand this, suddenly very interesting details like 0th and 1st central moments start to make sense. In case of quantiles, we center data around the median, and do further processing on residuals, same.
Oth moment (I call it init) is always 1, tho it’s interesting to extrapolate backwards the sequence for higher order moments construction, to understand how we actually end up with this zero.
1st moment (I call it bias) of residuals would be zero if you match centering and residuals analysis methods. But for some reason you didn’t do that (e.g centered data around midhinge or mean and applied QBAD on the centered data), you have to account for that bias.
Realizing stuff > understanding stuff
Learning 2981234 human invented fields < realizing the same unified principles how the Universe works
∞
Seasonal Pattern DecoderSeasonal Pattern Decoder
The Seasonal Pattern Decoder is a powerful tool designed for traders and analysts who want to uncover and leverage seasonal tendencies in financial markets. Instead of cluttering your chart with complex visuals, this indicator presents a clean, intuitive table that summarizes historical monthly performance, allowing you to spot recurring patterns at a glance.
How It Works
The indicator fetches historical monthly data for any symbol and calculates the percentage return for each month over a specified number of years. It then organizes this data into a comprehensive table, providing a clear, year-by-year and month-by-month breakdown of performance.
Key Features
Historical Performance Table: Displays monthly returns for up to a user-defined number of years, making it easy to compare performance across different periods.
Color-Coded Heatmap: Each cell is colored based on the performance of the month. Strong positive returns are shaded in green, while strong negative returns are shaded in red, allowing for immediate visual analysis of monthly strength or weakness.
Annual Summary: A "Σ" column shows the total percentage return for each full calendar year.
AVG Row: Calculates and displays the average return for each month across all the years shown in the table.
WR Row: Shows the "Win Rate" for each month, which is the percentage of time that month had a positive return. This is crucial for identifying high-probability seasonal trends.
How to Use
Add the "Seasonal Pattern Decoder" indicator to your chart. Note that it works best on Daily, Weekly, or Monthly timeframes. A warning message will be displayed on intraday charts.
In the indicator settings, adjust the "Lookback Period" to control how many years of historical data you want to analyze.
Use the "Show Years Descending" option to sort the table from the most recent year to the oldest.
The "Heat Range" setting allows you to adjust the sensitivity of the color-coding to fit the volatility of the asset you are analyzing.
This tool is ideal for confirming trading biases, developing seasonal strategies, or simply gaining a deeper understanding of an asset's typical behavior throughout the year.
## Disclaimer
This indicator is designed as a technical analysis tool and should be used in conjunction with other forms of analysis and proper risk management.
Past performance does not guarantee future results, and traders should thoroughly test any strategy before implementing it with real capital.

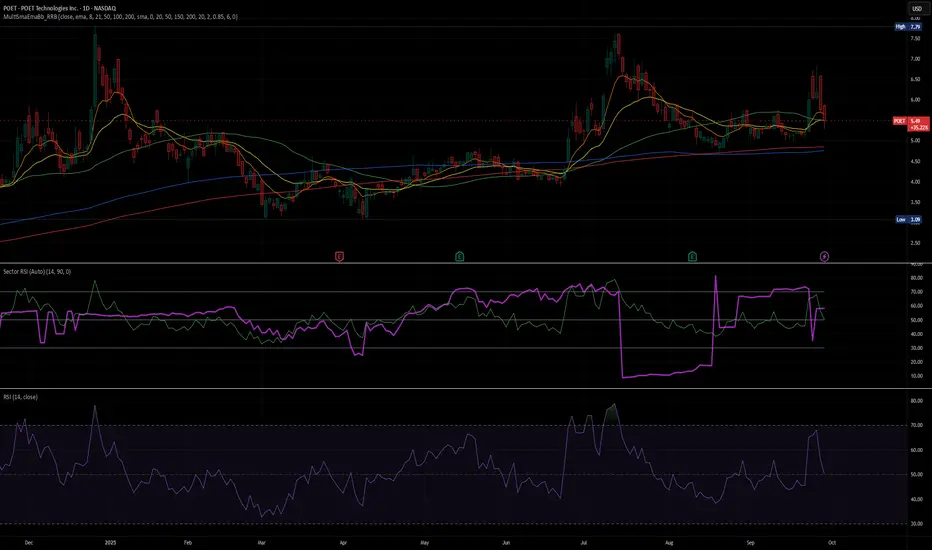
Sector RSI (Auto-Select)This indicator measures the relative strength momentum of any stock against its most closely correlated sector ETF, using the Relative Strength Index (RSI).
Auto sector selection: The script computes correlations between your symbol’s short-term returns and all major SPDR sector ETFs (XLB, XLE, XLF, XLI, XLK, XLP, XLU, XLV, XLY, XTN). The sector with the highest correlation is automatically chosen as the benchmark.
Sector vs Symbol RSI: It calculates RSI (default 14-period) for both the chosen sector and the current chart’s symbol.
Display modes:
Line mode: Plots both RSIs with colored fill (red if the sector RSI is stronger, green if the symbol RSI is stronger).
Histogram mode: Shows the difference between Sector RSI and Symbol RSI as a column chart.
RSI bands: Standard 70/50/30 reference lines are available in line mode.
Status line: The selected sector’s ticker is shown on the TradingView status line so you always know which sector is being used.
Use Cases:
Identify whether a stock’s momentum is driven by its sector or if it’s showing independent relative strength.
Detect sector rotations: when the stock begins to outperform or underperform its sector on momentum basis.
Combine with absolute RSI levels (overbought/oversold) to filter signals.
Notes:
This tool infers sector membership via rolling correlation, not from static classification metadata. This means in some cases (e.g. diversified companies or news shocks) the “best” sector may not be the official one, but the one most correlated in the current market regime.
Use min positive correlation input to filter out weak matches and enforce a fallback (defaults to Technology XLK).
Tomazz.nq – RSI Dynamic DisplayThis script displays the RSI value directly on your chart for quick and efficient market monitoring.
Fully customizable settings : RSI length, overbought/oversold levels, and colors.
Clear color logic : red when RSI is above the overbought threshold, red when below the oversold threshold, green otherwise.
Compact display in the top-right corner keeps your chart clean and focused.
➡️ Perfect for intraday and swing traders who want an at-a-glance RSI reading without opening a separate indicator window.

Advanced Market Structure [OmegaTools]📌 Market Structure
Advanced Market Structure is a next–generation indicator designed to decode price structure in real time by combining classical swing–based analysis with modern quantitative confirmation techniques. Built for traders who demand both precision and adaptability, it provides a robust multi–layered framework to identify structural shifts, trend continuations, and potential reversals across any asset class or timeframe.
Unlike traditional structure indicators that rely solely on visual swing identification, Market Structure introduces an integrated methodology: pivot detection, Donchian trend modeling, statistical confirmation via Z–Score, and volume–based validation. Each element contributes to a comprehensive, systematic representation of the underlying market dynamics.
🔑 Core Features
1. Five Distinct Market Structure Modes
Standard Mode:
Captures structural breaks through classical swing high/low pivots. Ideal for discretionary traders looking for clarity in directional bias.
Confirmed Breakout Mode:
Requires validation beyond the initial pivot break, filtering out noise and reducing false positives.
Donchian Trend HL (High/Low):
Establishes structure based on absolute highs and lows over rolling lookback windows. This approach highlights broader momentum shifts and trend–defining extremes.
Donchian Trend CC (Close/Close):
Similar to HL mode, but calculated using closing prices, enabling more precise bias identification where close–to–close structure carries stronger statistical weight.
Average Mode:
A composite methodology that synthesizes the four models into a weighted signal, producing a balanced structural bias designed to minimize model–specific weaknesses.
2. Dynamic Pivot Recognition with Auto–Updating Levels
Swing highs and lows are automatically detected and plotted with adaptive horizontal levels. These dynamic support/resistance markers continuously extend into the future, ensuring that historically significant levels remain visible and actionable.
3. Color–Adaptive Candlesticks
Price bars are dynamically recolored to reflect the prevailing structural regime: bullish (default blue), bearish (default red), or neutral (gray). This enables instant visual recognition of regime changes without requiring external confirmation.
4. Statistical Reversal Triggers
The script integrates a 21–period Z–Score calculation applied to closing prices, combined with multi–layered volume confirmation (SMA and EMA convergence).
Bullish trigger: Z–Score < –2 with structural confirmation and volume support.
Bearish trigger: Z–Score > +2 with structural confirmation and volume support.
Signals are plotted as diamond markers above or below the bars, identifying potential high–probability reversal setups in real time.
5. Integrated Alpha Backtesting Engine
Each market structure mode is evaluated through a built–in backtesting routine, tracking hit ratios and consistency across the most recent ~2000 structural events.
Performance metrics (“Alpha”) are displayed directly on–chart via a dedicated Performance Dashboard Table, allowing side–by–side comparison of Standard, Confirmed Breakout, Donchian HL, Donchian CC, and Average models.
Traders can instantly evaluate which structural methodology best adapts to the current market conditions.
🎯 Practical Advantages
Systematic Clarity: Eliminates subjectivity in defining structural bias, offering a rules–based framework.
Statistical Transparency: Built–in performance metrics validate each mode in real time, allowing informed decision–making.
Noise Reduction: Confirmed Breakouts and Donchian modes filter out common traps in structural trading.
Multi–Asset Adaptability: Optimized for scalping, intraday, swing, and multi–day strategies across FX, equities, futures, commodities, and crypto.
Complementary Usage: Works as a stand–alone structure identifier or as a quantitative filter in larger algorithmic/trading frameworks.
⚙️ Ideal Users
Discretionary traders seeking an objective reference for structural bias.
Quantitative/systematic traders requiring on–chart statistical validation of structural regimes.
Technical analysts leveraging pivots, Donchian channels, and price action as part of broader frameworks.
Portfolio traders integrating structure into multi–factor models.
💡 Why This Tool?
Market Structure is not a static indicator — it is an adaptive framework. By merging classical pivot theory with Donchian–style momentum analysis, and reinforcing both with statistical backtesting and volume confirmation, it provides traders with a unique ability:
To see the structure,
To measure its reliability,
And to act with confidence on quantifiably validated signals.

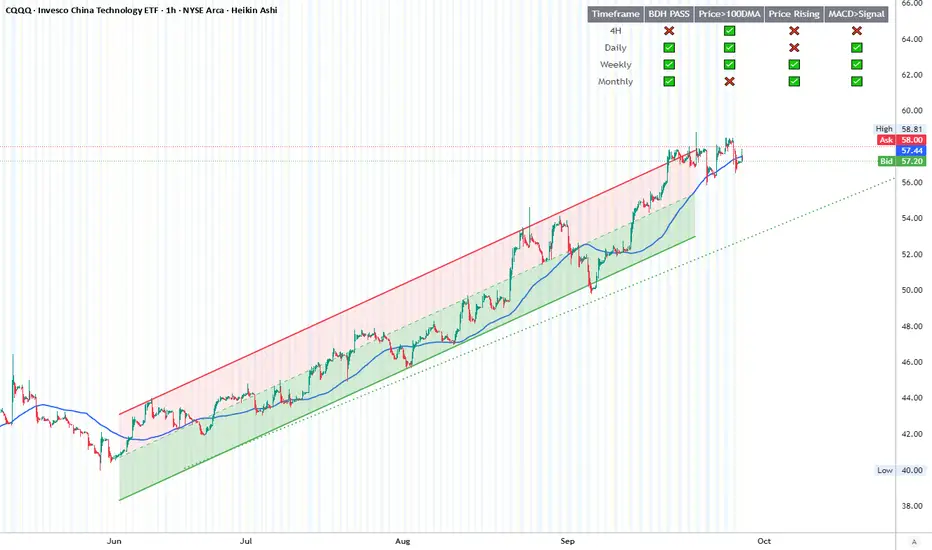
BDH Multi‑Timeframe Dashboard 📊 BDH Multi-Timeframe Dashboard (4H, D, W, M)
The Buy Don’t Hold (BDH) Screener is inspired by the book Buy—Don’t Hold by Leslie N. Masonson. It is designed to rotate into the strongest ETFs during bullish phases while stepping aside in weak markets.
✅ How It Works
The screener evaluates three filters across multiple timeframes (4H, Daily, Weekly, Monthly):
Price > 100-DMA
Price Rising (close > lookback)
MACD > Signal
Each timeframe earns a PASS if at least 2 out of 3 conditions are met.
🖥️ Features
Multi-timeframe dashboard table with green/red checks
🚀 Strategy Application
Scan for ETFs with multi-timeframe PASS signals
Buy the strongest performers
Rotate out when an ETF falls out of strength ranking
This rotation method is designed to historically outperform passive SPY holding by maintaining exposure only to strong, trending ETFs
📌 ETFs Watchlist (copy-paste ready)
Use this watch list for screening :
ARKF, ARKG, ARKK, ARKQ, ARKW, ASHR, BATT, BLCN, BLOK, CLOU, CQQQ, EEM, EMQQ, ESPO, HACK, IBUY, ICVT, IWM, IZRL, KWEB, MDY, OGIG, PBW, PRNT, QCLN, QQQ, REMX, SMH, SOCL, SPY, TAN, TLT, URA, VB, XBI, XHB, XLC, XLE, XLF, XLY, XOP, XRT
✨ With this dashboard, traders can quickly identify ETFs that meet the BDH conditions across multiple timeframes, helping them follow a disciplined rotation strategy.

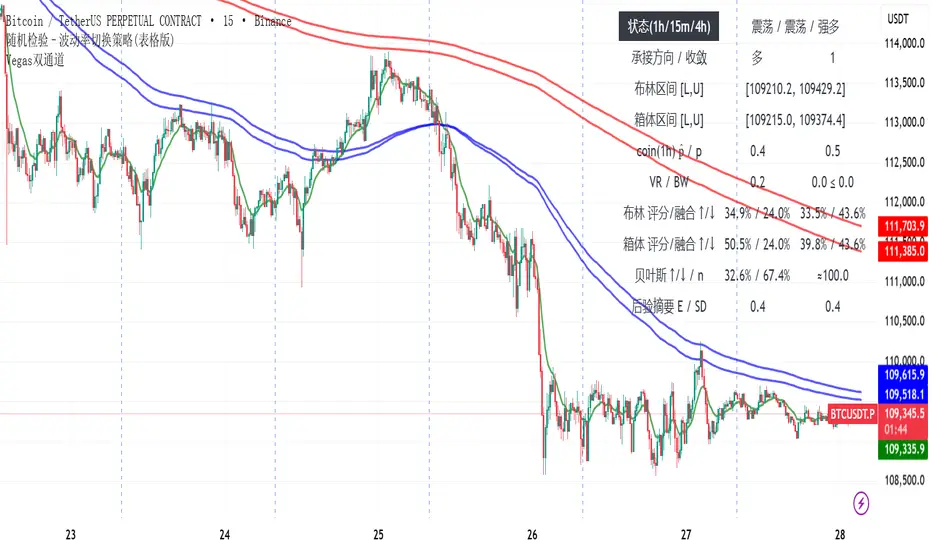
随机检验–波动率切换策略(表格版)随机检验 – 波动率切换策略(表格版)
模型原理
本指标基于统计学与波动率研究方法,结合多周期(15m / 1h / 4h)的市场数据,构建出一个“趋势-震荡”状态切换的分析框架。
核心思想:
通过 成交量加权的随机检验(coin test) 判断趋势方向及强弱;
使用 布林带带宽(Bandwidth)与方差比率(Variance Ratio) 识别波动收敛与扩张;
引入 贝叶斯统计(Beta 后验分布) 构造上涨概率背景,并对冲单一频段噪声;
在 布林视角与箱体视角 下生成右侧概率评分,最终融合多源概率形成市场状态评估。
关键假设
市场价格在短期内可视为“抛硬币检验”的结果,上涨/下跌概率并非完全均等,而是受成交量加权影响;
波动率在收敛后往往伴随趋势突破,布林带带宽可作为先行指标;
1h 周期的贝叶斯后验概率能够提供稳健的背景多空倾向;
多周期之间的关系符合“主判(1h)→承接(4h/15m)”的层级逻辑。
输出与功能
在图表右侧显示表格化仪表盘:
趋势状态(1h / 15m / 4h)
布林/箱体区间与收敛信号
各视角下的概率评分与融合结果
贝叶斯多空概率与后验分布摘要(E、SD、有效样本量)
同时绘制 1h 布林带,直观观察波动结构。
使用说明
该指标为 辅助决策工具,不直接生成交易信号。用户应结合自身策略和风险控制使用。
该版本为公开的测试版本。
Randomized Test – Volatility Switching Strategy (Dashboard Version)
Model Principle
This indicator is built on statistical and volatility analysis methods, combining multi-timeframe market data (15m / 1h / 4h) to construct a framework for switching between “trend” and “range” states.
Core ideas:
Use a volume-weighted randomized test (coin test) to determine trend direction and strength;
Apply Bollinger Bandwidth (BW) and Variance Ratio (VR) to detect volatility contraction and expansion;
Introduce Bayesian statistics (Beta posterior distribution) to build the bullish probability background and reduce single-frequency noise;
Generate right-side probability scores under both Bollinger view and Box view, and fuse them into a comprehensive market state evaluation.
Key Assumptions
In the short term, market prices can be modeled as outcomes of a “coin test,” where up/down probabilities are not perfectly equal but weighted by volume;
After volatility contraction, markets often break into trends, and Bollinger Bandwidth serves as a leading indicator;
The 1h Bayesian posterior probability provides a stable background bias for bullish/bearish tendencies;
Multi-timeframe relationships follow a hierarchical logic: main judgment (1h) → confirmation (4h/15m).
Outputs and Features
A dashboard-style table displayed on the right side of the chart, including:
Trend states (1h / 15m / 4h)
Bollinger/Box ranges and convergence signals
Probability scores and fusion results from different perspectives
Bayesian bullish probability and posterior summary (E, SD, effective sample size)
Visualization of the 1h Bollinger Bands for direct observation of volatility structure.
Usage
This indicator is an auxiliary decision-making tool. It does not generate trading signals directly. Users should apply it in combination with their own strategies and risk management.
This version is released as a public test version.
Uptrick: ATR ModelIntroduction
The Uptrick: ATR Model is a multi-regime directional tool designed to adapt to various trading styles and timeframes. It combines trend assessment, market state evaluation, visual overlays, and signal filtering into a single, highly configurable system. This indicator is intended to help traders interpret directional conditions, structure their entries and exits, and view real-time shifts in market context, all without relying on external scripts or multiple chart layers.
Core Functionality
At its foundation, the Uptrick: ATR Model builds a framework that responds to user-defined structure and market behavior. Through a wide range of inputs, traders can adjust the internal responsiveness, signal frequency, and volatility interaction of the system. The core behavior of the model can be shaped via:
Custom starting date for signal activation
Flexible smoothing structure
Adjustable expansion control for range boundaries
Signal persistence settings to limit noise
Conditional plotting of directional signals
Real-time bar coloring and overlays
Custom routing between long, short, and neutral positioning
This indicator is not tied to a single interpretation of market movement. Instead, it adapts to how the user defines structural behavior, volatility confirmation, and trend alignment.
Multi-Regime Architecture
The script includes four unique operating regimes, each offering a distinct model of interpreting market conditions:
Trend Mode
This regime focuses on trend state transitions over time. Signal behavior is aligned with directional market shifts and transitions are plotted with visual labels. Optional filters and persistence settings help control signal quality and responsiveness.
Cloud Close Mode
Cloud Close mode detects transitions when price interacts with dynamic boundaries. Signals are generated when the asset moves in or out of these ranges. This regime supports state memory to avoid repeated signals and emphasizes confirmation over reactivity.
Lightning Trend Mode
This mode evaluates momentum alignment across selected structures. Its behavior is based on composite assessments and dynamically reflects changes in directional agreement. This regime is well-suited for intraday or high-resolution users seeking visual confirmation of trend shifts.
Final Verdict Mode
A meta-regime that combines the output of the other three modes into a single directional consensus. A live decision table is displayed on-screen, showing the current verdict of each regime and a final, averaged output. This mode is designed for high-conviction or conservative traders who prefer confirmation across multiple systems.
Each regime can be enabled through a single selector, and the indicator adapts its signal behavior and bar coloring to reflect the active mode.
Signal System and Visual Feedback
The indicator generates Long, Short, or Cash (neutral/exit) signals depending on the active regime, directional configuration, and filter conditions. Signal shapes are plotted only once per state transition and are color-coded for clarity.
Users can define:
Whether signals should support both long and short, or long-only
Whether repeated signals are allowed (pyramiding control)
Whether to enforce a minimum number of confirming bars before a signal is allowed (persistence)
Signals are accompanied by real-time bar coloring, giving users an instant visual cue of the current state without relying on shape markers alone. These signals adjust based on the selected regime and are subject to any active confirmation filters.
Confirmation Filters
To reduce noise and improve the relevance of each signal, the model includes two optional filters:
Strength Filter
[Applies a condition based on the asset’s momentum. When enabled, signals will only fire if this condition aligns with the trade direction. Includes parameters for sensitivity and smoothness.
Trend Filter
Applies a directional filter based on a broader trend context. Signals will only trigger when this larger structure supports the directional bias. This filter is useful for avoiding signals during counter-trend moves or consolidations.
Both filters can be toggled independently. When disabled, the model will operate with fewer restrictions.
Dynamic Structure Customization
Users can control how the internal structure of the model behaves using:
Source selection (e.g., close, open, high, etc.)
Smoothing configuration using a tiered structure with up to three stages
Custom length inputs to adjust responsiveness
Selectable method options for each layer
Expansion settings to adjust the distance of dynamic boundaries
Signal persistence threshold to delay entries until confirmation is met
This modular control allows traders to define whether they want faster reaction to movement or more conservative, delayed responses depending on their strategy.
Final Verdict Table
The Final Verdict table is a live display that summarizes the signal output of the three core regimes (Trend, Cloud Close, and Lightning Trend). It includes:
Regime names and their current directional state
Directional scores for each regime
A final averaged score and directional label
The table is updated every bar and is fully customizable:
Position on screen (top left, center, bottom right, etc.)
Text size for readability
Color-coded state labels for fast interpretation
This feature is designed to offer structured decision support by showing consensus or divergence across all logic models in real time.
Static Levels Module
An optional module allows the user to anchor a high point (typically an all-time high) from a user-defined historical date. From that anchor, multiple levels are projected downward using fixed ratios. These levels are:
Automatically updated when new highs occur
Visualized using horizontal step-lines
Fully customizable in terms of count, color, and source
These levels serve as contextual guides and can assist with price projection, risk management, or discretionary confluence zones.
Directional Control
The model supports both Long & Short and Long Only signal modes. In Long Only mode, exit signals are routed to neutral (Cash) instead of Short. This allows users to align the indicator with personal strategy, risk appetite, or portfolio rules. Neutral signals are also plotted with distinct labels and coloring to indicate a directional reset.
Input Summary
All components of the script are user-configurable through the following inputs:
Start date selector to restrict signal generation
Source selection for core price input
Custom lengths and responsiveness settings
Smoothing structure with optional stacking
Expansion control for range width
Signal persistence threshold
Signal type selector (long-only or long & short)
Regime selector between four logic systems
Filters: strength-based and trend-based
Verdict table display settings (position and size)
Static levels: anchor date, count, source, and visual customization
Originality
What sets the Uptrick: ATR Model apart is its integration of multiple directional systems into a single, configurable interface. Each regime is distinct and interprets market behavior from a unique perspective, while the Final Verdict mode offers a consolidated view that few tools provide in a fully visual and non-redundant format. The Lightning Trend scoring engine and modular structural design offer a level of control and flexibility uncommon in single-layer indicators. The combination of signal gating, decision tables, and state tracking creates a cohesive, structured environment for directional evaluation.
Summary
The Uptrick: ATR Model is a complete directional and volatility analysis system designed for customizable trend evaluation, signal clarity, and strategic filtering. It adapts to different trader needs through its configurable regimes, state-aware signals, dynamic overlays, and visual decision tools. It is suitable for discretionary traders seeking structured guidance, as well as systematic users who require configurable state management and signal control.
Disclaimer
This tool is provided for informational and research purposes only. It does not constitute investment advice or a recommendation to buy or sell any financial instrument. All trading involves risk, and past performance does not guarantee future results. Users are solely responsible for their own decisions.

Z-Score Trend Channels [BackQuant]Z-Score Trend Channels
A self-contained price-statistics framework that turns a rolling z-score into price channels, bias states, and trade markers. Run either trend-following or mean-reversion from the same tool with clear, on-chart context.
What it is
A rolling statistical map that measures how far price is from its recent average in standard-deviation units (z-score).
Adaptive channels drawn in price space from fixed z thresholds, so the rails breathe with volatility.
A simple trend proxy from z-score momentum to separate trending from ranging conditions.
On-chart signals for pullback entries, stretched extremes, and practical exits.
Core idea (plain English math)
Rolling mean and volatility - Over a lookback you get the average price and its standard deviation.
Z-score - How many standard deviations the current price is above or below its average: z = (price - mean) / stdev. z near 0 means near average; positive is above; negative is below.
Noise control - An EMA smooths the raw z to reduce jitter and false flickers.
Channels back in price - Fixed z levels are converted back to price to form the upper, lower, and extreme rails.
Trend proxy - A smoothed change in z is used as a lightweight trend-strength line. Positive strength with positive z favors uptrend; negative strength with negative z favors downtrend.
What you see on the chart
Channels and fills - Mean, upper, lower, and optional extreme lines. The area mean->upper tints with the bearish color, mean->lower tints with the bullish color.
Background tint (optional) - Soft green, red, or neutral based on detected trend state.
Signals - Bullish Entry (triangle up) when z exits the oversold zone upward; Bearish Entry (triangle down) when z exits the overbought zone downward; Extreme markers (diamonds) at the extreme bands with a one-bar turn.
Table - Current z, trend state, trend strength, distance to bands, market state tag, and a quick volatility regime label.
Edge labels - MEAN, OB, and OS labels slightly projected forward with level values.
Inputs you will actually use
Z-Score Period - Lookback for mean and stdev. Larger = slower and steadier rails, smaller = more reactive.
Smoothing Period - EMA on z. Lower = earlier but choppier flips; higher = later but cleaner.
Price Source - Default hlc3. Choose close if you prefer session-close logic.
Upper and Lower Thresholds - Default around +2.0 and -2.0. Tighten for more signals, widen for fewer and stronger.
Extreme Upper and Lower - Deeper stretch guards, e.g., +/- 2.5.
Strength Period - EMA on z momentum. Sets how fast the trend proxy flips.
Trend Threshold - Minimum absolute z to accept a directional bias.
Visual toggles - Channels, signals, background tint, stats table, colors, and optional last-bar trend label.
How to use it: trend-following playbook
Read the state - Uptrend when z > Trend Threshold and trend strength > 0. Downtrend when z < -Trend Threshold and trend strength < 0. Neutral otherwise.
Entries - In an uptrend, prefer Bullish Entry signals that fire near the lower channel. In a downtrend, prefer Bearish Entry signals that fire near the upper channel.
Stops - Conservative: beyond the extreme channel on your side. Tighter: just outside the standard band that framed the signal.
Exits - For longs, exit or trim on a cross back through z = 0 or a clean tag of the upper threshold. For shorts, mirror with z = 0 up-cross or tag of the lower threshold. You can also reduce if trend strength flips against you.
Adds - In strong trends, additional signals near your side’s band can be add points. Avoid adding once z hovers near the opposite band for several bars.
How to use it: mean-reversion playbook
Find stretch - Standard reversions: Bullish Entry when z leaves the oversold zone upward; Bearish Entry when z leaves the overbought zone downward. Aggressive reversions: Extreme markers at extreme bands with a one-bar turn.
Entries - Take the signal as price exits the zone. Prefer setups where trend strength is near zero or tilting against the prior push.
Targets - First target is the mean line. A runner can aim for the opposite standard channel if momentum keeps flipping.
Stops - Outside the extreme band beyond your entry. If fading without extremes, place risk just beyond the opposite standard band.
Filters - Optional: skip counter-trend fades against a very strong trend state unless your risk is tight and predefined.
Reading the stats table
Current Z-Score - Magnitude and sign of displacement now.
Trend State - Uptrend, Downtrend, or Ranging.
Trend Strength - Smoothed z momentum. Higher absolute values imply stronger directional conviction.
Distance to Upper/Lower - Percent distance from price to each band, useful for sizing targets or judging room left.
Market State - Overbought, Oversold, Extreme OB, Extreme OS, or Normal.
Volatility Regime - High, Normal, or Low relative to recent distribution. Expect bands to widen in High and tighten in Low.
Parameter guidance (conceptual)
Z-Score Period - Choose longer for a structural mean, shorter for a reactive mean.
Smoothing Period - Lower for earlier but noisier reads; higher for slower but steadier reads.
Thresholds - Start around +/- 2.0. Tighten for scalping or quiet ranges. Widen for noisy or fast markets.
Trend Threshold and Strength Period - Raise to avoid weak, transient bias. Lower to capture earlier regime shifts.
Practical examples
Trend pullback long - State shows Uptrend. Price tests the lower channel; z dips near or below the lower threshold; a Bullish Entry prints. Stop just below extreme lower; first target mean; keep a runner if trend strength stays positive.
Mean-revert short - State is Ranging. z tags the extreme upper, an Extreme Bearish marker prints, then a Bearish Entry prints on the leave. Stop above extreme upper; target the mean; consider a runner toward the lower channel if strength turns negative.
Potential Questions you might have
Why z-score instead of fixed offsets - Because the bands adapt with volatility. When the tape gets quiet the rails tighten, when it runs hot the rails expand. Your entries stay normalized.
Do I need both modes - No. Many users run only trend pullbacks or only mean-reversions. The tool lets you toggle what you need and keep the chart readable.
Multi-timeframe workflow - A common approach is to set bias from a higher timeframe’s trend state and execute on a lower timeframe’s signals that align with it.
Summary
Z-Score Trend Channels gives you an adaptive mean, volatility-aware rails, a simple trend lens, and clear signals. Trade the trend by buying pullbacks in green and selling pullbacks in red, or fade stretched extremes back to the mean with defined risk. One framework, two strategies, consistent logic.
