Stock School IRL & ERLThis indicator is designed to help traders clearly identify liquidity levels on the chart using IRL (Internal Range Liquidity) and ERL (External Range Liquidity).
Liquidity is where the market is attracted.
Price does not move randomly — it moves from one liquidity pool to another.
With this indicator, you can:
• Visually mark IRL (internal liquidity resting inside the range)
• Identify ERL (external liquidity above highs & below lows)
• Understand where Smart Money targets stops
• Anticipate liquidity sweeps, fake breakouts, and reversals
• Improve entries, exits, and trade patience
This tool helps you stop guessing and start reading market intent.
Best used with:
Price Action
Market Structure
Smart Money Concepts (SMC)
Works across:
Stocks • Indices • Forex • Crypto
⚠️ This indicator does not give buy/sell signals.
It provides context, so you trade with logic, not emotions.
If you understand liquidity,
you understand where the market is going next.
Stockmarkets

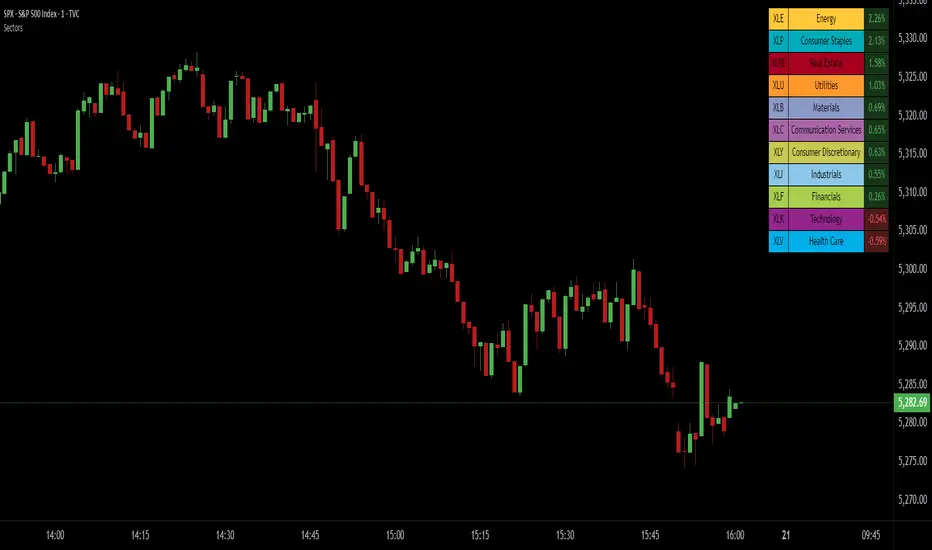
SPDR Sectors TableThis script generates an interactive and customizable SPDR Sectors Table designed to monitor and analyze the performance of the 11 main sectors of the S&P 500 via sector-specific ETFs. It offers a dynamic overview of daily or periodic sector movements, making it a valuable tool for traders, analysts, and investors implementing sector rotation strategies.
█ DEFINITIONS
SPDR Sectors ETFs are exchange-traded funds managed by State Street Global Advisors, which divide the S&P 500 into the following 11 sectors:
- Communication Services (XLC)
- Consumer Discretionary (XLY)
- Consumer Staples (XLP)
- Energy (XLE)
- Financials (XLF)
- Health Care (XLV)
- Industrials (XLI)
- Materials (XLB)
- Real Estate (XLRE)
- Technology (XLK)
- Utilities (XLU)
These ETFs aim to replicate the performance of their respective sectors as defined by the Global Industry Classification Standard (GICS). The funds are periodically rebalanced to match changes in the S&P 500 composition, offering an accurate snapshot of sectoral trends.
█ INDICATOR
The table displays each sector's ticker and full name, following official GICS terminology and SPDR color coding. It also shows percentage performance, calculated daily on intraday charts or based on the selected time frame.
Users can sort the table by either percentage performance or the relative weight of each ETF in the S&P 500. The default weight values reflect data updated as of 17 April 2025, and can be manually adjusted based on the most recent sector weightings available on the official SPDR website.
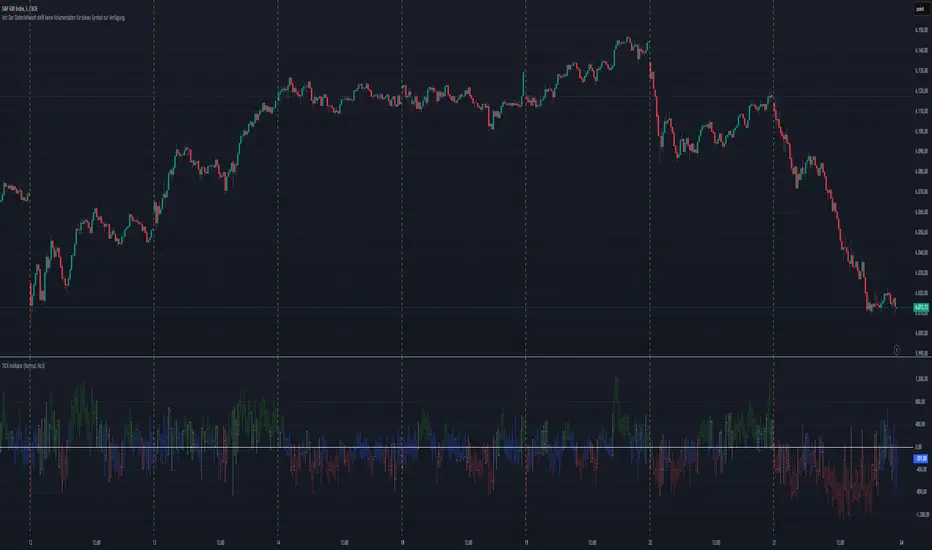
TICK Indikator
English:
The TICK Indicator measures in real time the number of up ticking stocks minus the number of down ticking stocks on the New York Stock Exchange (NYSE). It can display either the current TICK value ("Normal" mode) or the cumulative TICK values over the trading day ("Cumulative" mode). Positive values indicate market strength, while negative values signal weakness. Colored bars visualize momentum: green shades for rising, red for falling values. The zero line acts as a reference between buying and selling pressure.
Interpretation:
> +1000 and/or continuos lows above 0 → strong buying pressure
< -1000 and/or continuos highs below 0 → strong selling pressure
Around 0 → balanced market
Deutsch:
Der TICK Indikator misst in Echtzeit die Anzahl der Aktien, die an der New York Stock Exchange (NYSE) steigen, minus der Anzahl der fallenden Aktien. Der Indikator kann im "Normal"-Modus den aktuellen TICK-Wert anzeigen oder im "Cumulative"-Modus die kumulierten TICK-Werte über den Tag hinweg summieren. Positive Werte deuten auf eine allgemeine Markstärke hin, während negative Werte Schwäche signalisieren. Farbige Balken visualisieren die Dynamik: grüne Töne bei steigenden, rote bei fallenden Werten. Die Nullinie dient als Referenzpunkt zwischen Kauf- und Verkaufsdruck.
Interpretation:
> +1000 und/oder mehrere aufeinander folgende Tiefs über 0 → starker Kaufdruck
< -1000 und/oder mehrere aufeinander folgende Hochs unter 0 → starker Verkaufsdruck
Nahe 0 → ausgeglichener Markt
S&P Short-Range Oscillator**SHOULD BE USED ON THE S&P 500 ONLY**
The S&P Short-Range Oscillator (SRO), inspired by the principles of Jim Cramer's oscillator, is a technical analysis tool designed to help traders identify potential buy and sell signals in the stock market, specifically for the S&P 500 index. The SRO combines several market indicators to provide a normalized measure of market sentiment, assisting traders in making informed decisions.
The SRO utilizes two simple moving averages (SMAs) of different lengths: a 5-day SMA and a 10-day SMA. It also incorporates the daily price change and market breadth (the net change of closing prices). The 5-day and 10-day SMAs are calculated based on the closing prices. The daily price change is determined by subtracting the opening price from the closing price. Market breadth is calculated as the difference between the current closing price and the previous closing price.
The raw value of the oscillator, referred to as SRO Raw, is the sum of the daily price change, the 5-day SMA, the 10-day SMA, and the market breadth. This raw value is then normalized using its mean and standard deviation over a 20-day period, ensuring that the oscillator is centered and maintains a consistent scale. Finally, the normalized value is scaled to fit within the range of -15 to 15.
When interpreting the SRO, a value below -5 indicates that the market is potentially oversold, suggesting it might be a good time to start buying stocks as the market could be poised for a rebound. Conversely, a value above 5 suggests that the market is potentially overbought. In this situation, it may be prudent to hold on to existing positions or consider selling if you have substantial gains.
The SRO is visually represented as a blue line on a chart, making it easy to track its movements. Red and green horizontal lines mark the overbought (5) and oversold (-5) levels, respectively. Additionally, the background color changes to light red when the oscillator is overbought and light green when it is oversold, providing a clear visual cue.
By incorporating the S&P Short-Range Oscillator into your trading strategy, you can gain valuable insights into market conditions and make more informed decisions about when to buy, sell, or hold your stocks. However, always consider other market factors and perform your own analysis before making any trading decisions.
The S&P Short-Range Oscillator is a powerful tool for traders looking to gain insights into market sentiment. It provides clear buy and sell signals through its combination of multiple indicators and normalization process. However, traders should be aware of its lagging nature and potential complexity, and use it in conjunction with other analysis methods for the best results.
Disclaimer
The S&P Short-Range Oscillator is for informational purposes only and should not be considered financial advice. Trading involves risk, and you should conduct your own research or consult a financial advisor before making investment decisions. The author is not responsible for any losses incurred from using this indicator. Use at your own risk.

Buy&Sell Bullish Engulfing - The Quant Science🇺🇸
GENERAL OVERVIEW
Buy&Sell Bullish Engulfing - The Quant Science It is a Buy&Sell strategy based on the 'Bullish Engulfing' candlestick pattern. The main goal of the strategy is to achieve a consistent and sustainable return over time, with a manageable level of risk.
Bullish Engulfing
The template was developed at the top of the Indicator provided by TradingView called 'Engulfing - Bullish'.
ENTRY AND EXIT CRITERIA
Entry: A single long order is opened when the candlestick pattern is formed, and the percentage size of the order (%) is fixed by the trader through the user interface.
Exit: The long trade is closed on a percentage equity take profit-stop loss.
----------------------------------------------------------------------------------------------------------------------------------------------------------------------------------------------
🇮🇹
PANORAMICA GENERALE
Buy&Sell Bullish Engulfing - The Quant Science è una strategia Buy&Sell basata sul candlestick pattern 'Bullish Engulfing'. L'obiettivo principale della strategia è ottenere un ritorno costante e sostenibile nel tempo, con un livello gestibile di rischio.
Bullish Engulfing
Il template è stato sviluppato al top dell' Indicatore fornito da Trading View chiamato 'Engulfing - Bullish'.
CRITERI DI ENTRATA E USCITA
Entrata: viene aperto un singolo ordine long quando si forma il candlestick pattern, la size percentuale dell'ordine (%) viene selezionato tramite l'interfaccia utente dal trader.
Uscita: la chiusura della posizione avviene unicamente tramite un take profit-stop loss percentuale calcolato sul capitale.

Grid Spot Trading Algorithm V2 - The Quant ScienceGrid Spot Trading Algorithm V2 is the last grid trading algorithm made by our developer team.
Grid Spot Trading Algorithm V2 is a fixed 10-level grid trading algorithm. The grid is divided into an accumulation area (red) and a selling area (green).
In the accumulation area, the algorithm will place new buy orders, selling the long positions on the top of the grid.
BUYING AND SELLING LOGIC
The algorithm places up to 5 limit orders on the accumulation section of the grid, each time the price cross through the middle grid. Each single order uses 20% of the equity.
Positions are closed at the top of the grid by default, with the algorithm closing all orders at the first sell level. The exit level can be adjusted using the user interface, from the first level up to the fifth level above.
CONFIGURING THE ALGORITHM
1) Add it to the chart: Add the script to the current chart that you want to analyze.
2) Select the top of the grid: Confirm a price level with the mouse on which to fix the top of the grid.
3) Select the bottom of the grid: Confirm a price level with the mouse on which to fix the bottom of the grid.
4) Wait for the automatic creation of the grid.
USING THE ALGORITHM
Once the grid configuration process is completed, the algorithm will generate automatic backtesting.
You can add a stop loss that destroys the grid by setting the destruction price and activating the feature from the user interface. When the stop loss is activated, you can view it on the chart.

Stock Intrinsic Value & MOS IndicatorStock Intrinsic Value and MOS Indicator is a powerful tool that can help investors to evaluate the potential value of a particular stock. By taking into account key financial metrics such as earnings per share, price-to-earnings ratio, and dividend yield, this indicator provides a comprehensive analysis of a company's fundamentals, and can be used to estimate its intrinsic value.
To use this indicator, simply input the relevant financial metrics for the stock you're interested in from Yahoo finance, including the P/E ratio, earnings per share, and dividend yield. The indicator will then calculate the stock's intrinsic value based on these inputs, taking into account the company's earnings potential and dividend payments.
In addition to calculating the intrinsic value, the Stock Intrinsic Value and MOS Indicator also allows investors to add a margin of safety to their analysis, which can help to account for unexpected market events or uncertainties. By adding a margin of safety of 20% - 30%, for example, investors can ensure that they are buying the stock at a significant discount to its intrinsic value, providing a cushion against potential losses.
Using the Stock Intrinsic Value and MOS Indicator can be a valuable tool for investors looking to make informed decisions about their investments. By taking into account key financial metrics and adding a margin of safety, investors can be more confident in their investment decisions, and can potentially maximize their returns over the long-term.
However, it's important to remember that the Stock Intrinsic Value and MOS Indicator is just one tool among many that investors can use to evaluate potential investments. As with any investment strategy, it's important to conduct thorough research and analysis before making any investment decisions. Additionally, it's important to keep in mind that no investment strategy is foolproof, and that even the most well-informed investment decisions can still result in losses.
Overall, the Stock Intrinsic Value and MOS Indicator can be a valuable tool for investors looking to evaluate potential investments and make informed decisions about their portfolio. By using this indicator in combination with other tools and strategies, investors can potentially maximize their returns and achieve their long-term investment goals.

Terminal : USD Based Stock Markets Change (%)Hello.
This script is a simple USD Based Stock Markets Change (%) Data Terminal.
You can also set the period to look back manually in the menu.
In this way, an idea can be obtained about Countries' Stock Markets.
And you can observe the stock exchanges of relatively positive and negative countries from others.
Features
Value changes on a percentage basis (%)
Stock exchange values are calculated in dollar terms.
Due to the advantage of movement, future data were chosen instead of spot values on the required instruments.
Stock Markets
Usa : S&P 500 Futures
Japan: Nikkei 225 Futures
England: United Kingdom ( FTSE ) 100
Australia: Australia 200
Canada: S&P / TSX Composite
Switzerland: Swiss Market Index
New Zealand: NZX 50 Index
China: SSE Composite (000001)
Denmark: OMX Copenhagen 25 Index
Hong-Kong: Hang Seng Index Futures
India: Nifty 50
Norway: Oslo Bors All Share Index
Russia: MOEX Russia Index
Sweden: OMX Stockholm Index
Singapore: Singapore 30
Turkey: BIST 100
South Africa: South Africa Top 40 Index
Spain: IBEX 35
France: CAC 40
Italy: FTSE MIB Index
Netherlands: Netherlands 25
Germany : DAX
Regards.
