© 2021 - SwingSwiss - BUY/SELL© 2021 - Dan Chetrit - BUY/SELL"
Product Description:
The Indicator combines the Relative Strength Index, Moving Average Convergence Divergence as well as Volume and Stochastic.
The idea is to cross multiple data and signals from these indicators in order to trigger buy when crossing above and sell when crossing below the signal line.
The idea was also to find a mathematical function that will trade the convergence of these lines trying to predict the market.
This indicator works better on a daily chart.
The indicator works long and short but is better for long positions.
The script also includes an EMA 50 line as well as an overbought/oversold RSI background.
The indicator can be used on every type of market: indices, stocks, cryptocurrencies, currencies, and others but, according to backtesting, it works better for the US stock market.
This study is not a guaranteed profit. You should backtest or trade virtual money before using this study on your real portfolio, as it is intended to be a tool. Do your research and learn about the company you are investing in.
Disclaimer:
Trading and investing in the financial markets involves substantial risk of loss and is not suitable for every investor.
All trading strategies are used at your own risk.
Please send me a private message or comment on TradingView to gain access to the script.
Stocks!

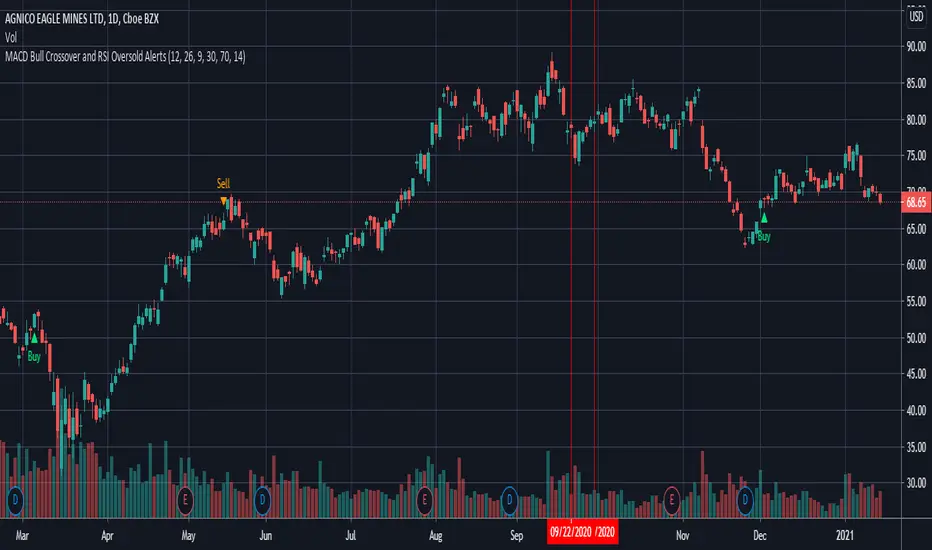
MACD Bull Crossover and RSI Oversold - AlertsHello everyone, these are the alerts for my previous "MACD Bull Crossover and RSI Oversold" Long Strategy. This version currently does not support stoploss and takeprofit alerts but the next update will.
3 Weeks Tight - Price Consolidation [LevelUp]3 Weeks Tight - Introduction
3 weeks tight is a bullish continuation pattern discovered by IBD's founder, William O'Neil.
The pattern can used as an opportunity to add to an existing position as it often occurs after a breakout above a cup with handle or other technical pattern.
The 3 weeks tight pattern forms when a stock closes within approximately 1% to 1.5% of the prior week's close for at least two weeks. The reason for the bullishness is that it indciates that investors who moved the stock upward in price since the breakout are not taking profits, the price is holding steady.
The buy point is just above the area of resistance formed at the highs of the three weeks plus 10 cents. The ten cent addition to the price is to ensure a push through the resistance at the high of the range.
Key Points:
It's preferred that closes for each week are in the upper half of the stock's range.
Ideally, volume will increase significantly as the stocks moves past the buy point.
This pattern generally performs best when the market is in an uptrend.
Features:
A configurable horizontal bar that spans the 3 week period.
A vertical band that highlights the tightness pattern.
A label to show the buy price after 3 week tight pattern.
Optional alert when the 3 weeks tight pattern is recognized.

Fin_PanelStock Financial Panel
Basic financial analysis.
Able to FY/FQ switch.
Free plan users please turn on the "Free Plan" checkbox.
There is no proper category, so I chose my fav Tech indicators category.

MACD Crossover with signalsMACD Crossover with signals - a simple trading indicator based on classic MACD.
It shows crossovers and plots them on chart as "Long" or "Short".
The MACD itself is not plotted in order to keep your charts cleaner.
By default, all the crossovers are displayed on the chart.
However, you can use only trend-based ones. They are filtered according to the trend (which is plotted and colored using 200 period EMA) and the "zero-line rule" of the MACD.
So if you consider using only trend-based signals, the indicator will only show Long signals on an uptrend and Short signals on a downtrend.
All signals/lines can be turned on/off and styled in the settings menu.
It can be used with all major timeframes and assets (crypto, fx, cfd, stocks, commodities etc).
Consider using it with respect to your trading style, money- and risk-management as well as other strategies and indicators.
If it was useful for you – hit the Like button and share it with your friends - it's free 😉

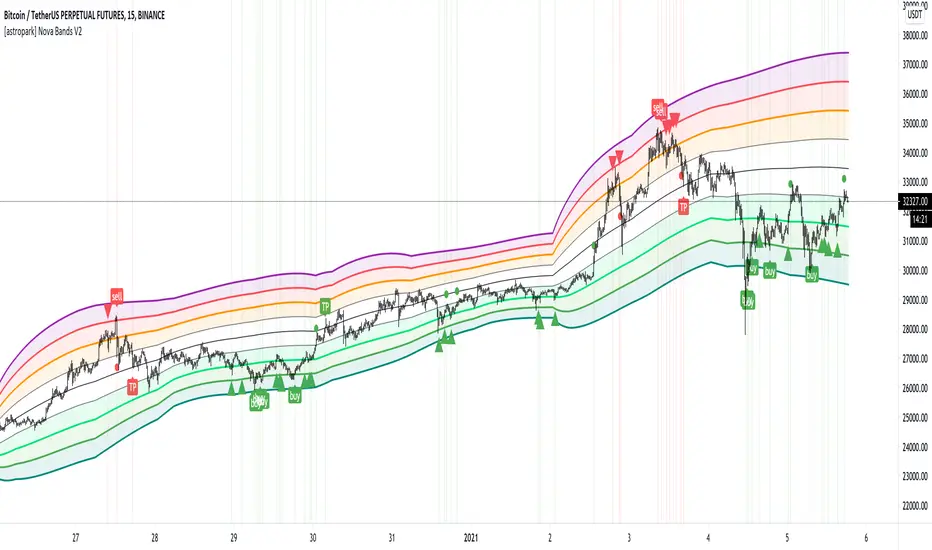
[astropark] Nova Bands V2Dear followers,
today an upgraded version of Nova Bands indicator, here below the previous V1
This is a great analysis and scalping tool for day trading on low timeframes (5-15 minutes) or to plan swing trades on hourly timeframes. It can be used also on high timeframes just for analysis current market trend.
The indicator plots a series of levels which create a nice bands flow.
The slope of levels make you easily understand when price is in consolidation, in uptrend or in downtrend.
The golden rule is always the same: buy low and sell high .
This indicator plots:
3 "price is low here" levels (from dark green to light green)
3 "price is average here" levels
3 "price is high here" levels (from purple to orange)
You can find more details on how to use the indicator in the description of V1.
Please, always remember that:
when bands are flat, price is in consolidation and this is best condition to trade with nova bands
when bands get nearer and nearer is called "Bands Squeeze": price is next to a main breakout move, volatility is coming!
The basic improvement in V2 is a different way to calculate the bands based on different timeframe resolution, default is setup to daily timeframe for example.
A trader who wants to be a winner must understand that money and risk management are very important, so manage your position size and always have a stop loss in your trades.
This is a premium indicator , so send me a private message in order to get access to this script.
Non-Rescaled RSI█ OVERVIEW
Relative Strength Index is a momentum oscillator developed by J. Wilder. The original version of RSI rescaled the relative strength measurement to range. While the rescaling is useful for readability, This non-rescaled version tells the exact average relative strength of the movement for the past period, and give another way to put the relative strength reading into context of current market condition.
█ Description & How To Use
1. The (+/-) in relative strength value indicates the direction
Example 1: Relative Strength of 2.33 means average gain is 2.33 bigger than average loss for the past period (Equivalent to RSI 70)
Example 2: Relative Strength of -2.33 means average loss is 2.33 bigger than average gain for the past period (Equivalent to RSI 30)
Example 3: Relative Strength of 0 means average gain is equal to average loss for the past period (Equivalent to RSI 50)
Look at comparison below:
2. You can use it exactly how you would use RSI: Overbought/Oversold state, Divergence, Trend identification, Failure Swings etc..
█ Features
- Overbought/Oversold line still maintainable as standard RSI level (70,30) in user input screen. The script will recalculate and plot the ob/os level accordingly
- Value Label to indicate the RSI and RS value
- Custom Gradient Color Scheme
█ Limitation
The Relative Strength absolute value is capped at 20 to avoid ratio value too big(or too small). This is enough to get accurate equivalent of RSI reading between 5-95
█ Disclaimer
Past performance is not an indicator of future results.
My opinions and research are my own and do not constitute financial advice in any way whatsoever.
Nothing published by me constitutes an investment/trading recommendation, nor should any data or Content published by me be relied upon for any investment/trading activities.
I strongly recommends that you perform your own independent research and/or speak with a qualified investment professional before making any financial decisions.

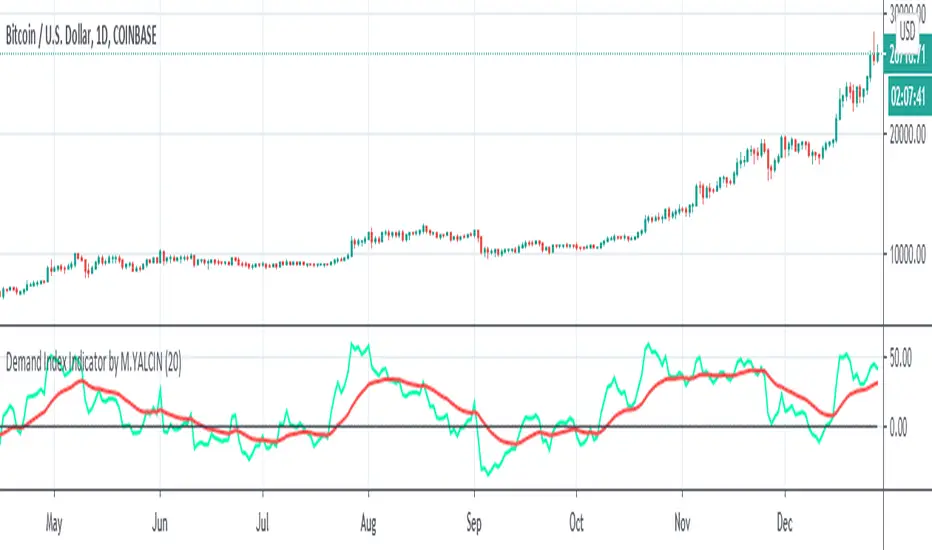
Demand Index Indicator by M.YALCINThe Demand Index is a complex technical indicator developed by James Sibbet that utilizes over 20 columns of data to measure the ratio of buying pressure to selling pressure. James Sibbet established six rules for using Demand Index:
1.A divergence between the Demand Index and price is a bearish indication.
2.Prices often rally to new highs following an extreme peak in the Demand Index.
3.Higher prices with a low Demand Index often indicate a top in the market.
4.The Demand Index moving through the zero line suggests a change in trend.
5.The Demand Index remaining near the zero line indicates weak price movement that won’t last long.
6.A long-term divergence between the Demand Index and price predicts a major top or bottom.
This indicator differs from other demand index indicators on this site in terms of indicator values. However, I think the low number of zigzags highlights this style. On the other hand, I think important points in terms of trading are added to the indicator: 1) According to many observations, the moments when this indicator crosses the zero line are interpreted as buy signals, and vice versa as a sell signal so the 0 line is shown. 2) Again, according to many observations, when the indicator crosses up its own 20-day (bar) exponential moving average is interpreted as a buy signal, and vice versa as a sell signal. Happy New Year ... NOTE: All these ideas do not contain financial advice.
Screener - Mean Reversion Channel█ OVERVIEW
This is Screener script for Mean Reversion Channel Indicator
█ Description & How To Use
The screener works by scanning through up to 40 symbols and list down symbols that are currently within Overbought/Oversold Zone as defined by Mean Reversion Channel indicator.
The Overbought/Oversold Zone are further categorized and sorted by:
Strong : Indicated by "(Strong)" next to the symbol name
Normal : Indicated by the absence of "(Strong)" or "(Weak)" next to the symbol name
Weak : Indicated by "(Weak)" next to the symbol name
Notes: Refer to chart above to see how the Zone are categorized.
Notes: If the screener displays "Nothing Interesting". It simply means none of the screened assets are within the Overbought/Oversold Zone.
█ Features
- Scan up to 40 symbols at a time (By default, no asset is define. Once configured all the symbols you required, remember to save as default to save you from pain of configuring it again in the future)
- Options to scan by zones
- Custom Timeframe
█ Limitation
Due to multiple use of security() function required to call other symbols, expect the screener to be slow at certain times
█ Disclaimer
Past performance is not an indicator of future results.
My opinions and research are my own and do not constitute financial advice in any way whatsoever.
Nothing published by me constitutes an investment recommendation, nor should any data or Content published by me be relied upon for any investment/trading activities.
I strongly recommends that you perform your own independent research and/or speak with a qualified investment professional before making any financial decisions.
Any ideas to further improve this indicator are welcome :)
Credit: QuantNomad for his script idea on custom screener

PpSignal Impulse V1.20PpSignal impulse is based on the concept of relative strength index, Rsi its acronym in English.
Although the calculation is similar, it differs in how the force is calculated. To calculate the force we are based on the analysis of the trend through a WMA.
It is important to clarify that you must do a prior analysis of the asset that you are going to trade, such as resistance supports, channels, chart formations, etc.
Buy when the sign is white.
Sell when the signal is red.
You can also perform buy or sell boosts if you activate impulse 2 and 3.

PpSignal Haiken Ashihere is the development of ppsignal Heiken Ashi with a formula of ours.
It also has a Smooth move average.
When HA this green is buying, when red is selling... simple entry system for scalping.
Enjoy it

[fareid] Quick Backtest Framework█ OVERVIEW
This Framework allows Pine Coders to quickly code Study() based signal/strategy and validate its viability before proceed to code with more advance/complex customized rules for entry, exit, trailstop, risk management etc..
This is somewhat an upgraded version of my earlier personal template with different strategy used, cleaner code
and additional features.
█ USE CASES
- You have an idea for trade signal and need a quick way to verify its potential before writing lengthy/complicated code
- You found a study script for trading signal in public library and want to validate it profitability with minimum effort before including it in your trading playbook
█ FEATURES
- Alert: Ready to use alert function based on signals from your custom indicator.
- Visual Backtest: Auto-plot entry, stop-loss and take profit for simple strategy performance analysis
- Backtest Statistic: Provide basic key metrics based on backtest strategy
- BTE External Signal Protocol: Ready to use code that will supply required state to PineCoders Backtesting & Trading Engine if you wish to have more advance and sophisticated backtesting engine
Notes: All of the above features have On/Off toggle
█ Description & How To Use
This Framework consist of 5 Modules but you only need to edit the first 2 Modules:
Module1: Indicator
Module2: Framework Input Protocol
Module3: Alert
Module4: Backtest
Module5: Backtest & Trading Engine
Tips: The source-code includes collapsible block by module for easy navigating
Module1: Indicator:
-----------------------------------------------------------------------------------
Main Module. Place custom indicator input parameter/calculation/indicator plotting here
Sample Strategy: Double MACD Crossover
MACD Signal: 1st MACD Cross above signal line indicate Buy Signal
1st MACD Cross below signal line indicate Sell Signal
MACD Filter: 2nd MACD is above 0 line indicate Uptrend
2nd MACD is below 0 line indicate Downtrend
Module2: Framework Input Protocol:
-----------------------------------------------------------------------------------
Use this module to connect main indicator/signal calculated in Module1 to the rest of the framework's module
4 variables needed to be defined here:
1. Uptrend
2. Dntrend
3. BuySignal
4. SellSignal
i'm not sure how to place a code snippet here to show you example so in the source code i already put a comment in Module2 on which part u need to edit. I hope its pretty simple to use.
Module3: Alert Module Description:
-----------------------------------------------------------------------------------
As long as the variables in Module2 properly defined, the alert module is ready to use without any further modification.
Input:
Enable Alert --> Enable TV's alert and plot signal to chart
Alert Type --> Set to take Buy only, Sell only or Both alert
Module4: Backtest Module Description:
-----------------------------------------------------------------------------------
As long as the variables in Module2 properly defined, the backtest module is ready to use without any further modification.
Input:
Backtest Stat --> Enable Backtest Statistic Label
Backtest Visual --> Enable Backtest visual simulation
Backtest Type --> Set to take Buy only or Sell only or both
SL Type -->
ATR : Set SL in ATR times Multiplier below entry price
Fixed : Set SL in fixed point below entry point (in 'Dollar'). e.g. for Stocks -> 0.5 equals to 50cent while for EURUSD currency -> 0.005 equal to 50 pips
HiLo Bar: Set SL at highest/lowest wick of previous bar plus/minus Fixed point. e.g. EURUSD HiLo=3 and Fixed Point = 0.0005, buy trade will place SL 5 Pips below lowest of previous 3 bar
SL ATR Multi --> Set Lookback Period used for SL's ATR calculation
SL ATR Multi --> Set ATR Multiplier for SL
SL Fixed --> Set Fixed Level for SL
SL Bar --> Set Number of previous bar to check for SL placement
TP RR Ratio --> Set TP based on RR multiplier. e.g. 2 means TP level will be twice further from entry point compared to Entry-SL distance.
Notes: The point is for preliminary testing, so it only supports 1 trade at a time and no Trailing Stop
Module5: Backtest & Trading Engine Description:
-----------------------------------------------------------------------------------
As long as the variables in Module2 properly defined, the Pinecoders BTE module is ready to use without any further modification.
Input:
External Signal Protocol --> Set ESP State to send to "Backtesting & Trading Engine "
Signal With Filter --> Use this to send entry signal that already filtered by this study indicator (without stoploss level)
Signal Without Filter --> Use this to send raw entry signal that are NOT YET FILTERED by this study indicator (without stoploss level)
Signal and Stop With Filter --> Use this to send entry signal WITH StopLoss that already filtered by this study indicator (with stoploss level)
Signal and Stop Without Filter --> Use this to send raw entry signal WITH StopLoss that are NOT YET FILTERED by this study indicator (with stoploss level)
Notes: Backtesting & Trading Engine already have built-in Filter, Entries and Stop Level. e.g. Unselect all their filter state if only want to use custom filter and make sure send Signal with Filter (with or without SL level)
█ DISCLAIMER:
This framework main objective is to create my personal indicator template so that i just have to modify the indicator module for preliminary testing in future.
The sample strategy included are for educational purpose only. Use at your own risk
credit: LucF/PineCoders for a lot of his scripts that i use as a guide to complete this

MACD With Trend Filter: Visual Backtest Module TemplateSample Strategy: MACD Crossover with trend filter options
MA Filter : Price Close Above MA, Search for Buy, Price Close Below MA, Search for Sell
ADX Filter : Take trade only when ADX is above certain treshold
MACD Signal : MACD Cross above signal line while under 0 line indicate Buy Signal
MACD Cross below signal line while above 0 line indicate Sell Signal
-----------------------------
Using Alert Module:
Enable Alert --> Enable TV's alert and plot signal to chart
Alert Type --> Set to take Buy only, Sell only or Both alert
----------------------------
Using Backtest Module:
Enable Backtest --> Enable Backtest simulation
Backtest Type --> Set to take Buy only, Sell only or Both
SL Type -->
ATR : Set SL in ATR times Multiplier below/above entry price
Fixed : Set SL in fixed point below entry point (in 'Dollar'). e.g. for Stocks -> 0.5 equals to 50cent while for EURUSD currency -> 0.005 equal to 50 pips
HiLo Bar : Set SL at highest/lowest wick of previous bar plus/minus Fixed point. e.g. EURUSD HiLo=3 and Fixed Point = 0.0005, buy trade will place SL 5 Pips below lowest of previous 3 bar
SL ATR Period --> Set Lookback Period used for SL's ATR calculation
SL ATR Multi --> Set ATR Multiplier for SL
SL Fixed --> Set Fixed Level for SL (Use when SL Type is either Fixed or HiLo Bar)
SL Bar --> Set Number of previous bar to check for SL placement
TP RR Ratio --> Set TP based on RR multiplier. e.g. 2 means TP level will be twice further from entry point compared to Entry-SL distance.
Notes: The point is for preliminary testing, so it only supports 1 trade at a time and no Trailing Stop
----------------------------
Disclaimer:
This script main objective is to create my personal indicator template so that i just have to modify the indicator module for preliminary testing in future.
Testing Alert Module so i can re-use it as template in future study/indicator
Testing Visual Backtest Module so i can re-use it as template in future study/indicator
i believe using Strategy function is a better approach for this but the entry/exit level seems to be hit n miss (at least for me, still trying to figure what i did wrong)
also, i rather code the strategy in other platform where i can use the more accurate tick data if i want to validate backtest statistics.
My study scripts was built only to test/visualize an idea to see its viability and if it can be used to optimize existing strategy.
credit: ADX code are originally from "ADX and DI" by @BeikabuOyaji although i re-wrote so i can have cleaner read and use RMA instead of SMA

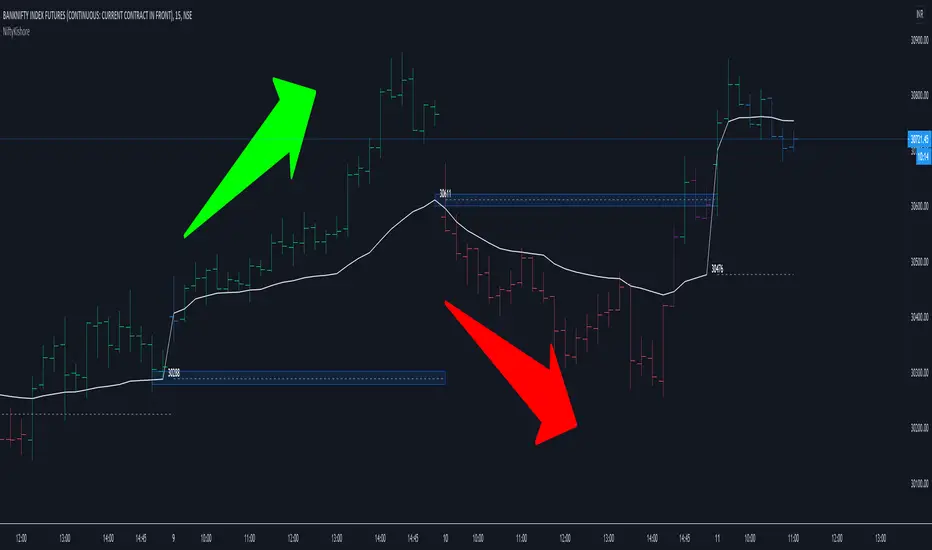
Vwap Pvwap Intraday Trend - NiftyKishoreHello Traders !!
This is a simple trend identification script which is based on the current vwap (Cvwap) and previous vwap (Pvwap).
Pvwap in the sense; previous day vwap closing value.
Bullish: price is closing above the current day vwap and previous day vwap(pvwap).
Bearish : Price is closing below the current day vwap and previous day vwap (pvwap).
Made a change to the barcolors as well :)
Bullish
Green Bar: close is above Pvwap and Cvwap.
Blue bar: close is above Pvwap but below Cwap.
Bearish
Red bar: close is below Pvwap and Cvwap.
Purple bar: close is below Pvwap but above Cvwap.
Simple but effective
Cheers !!
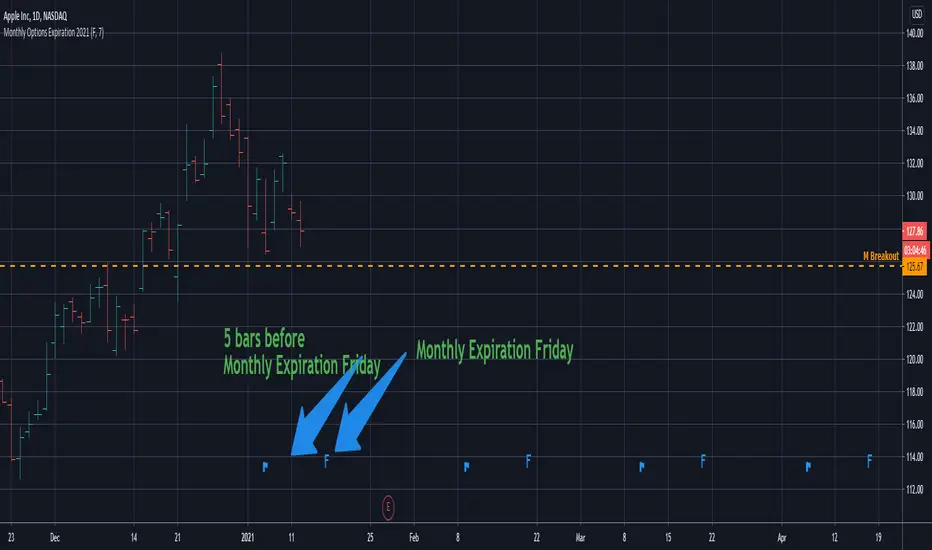
Monthly Options Expiration 2021Monthly options expiration for the year 2021.
Also you can set a flag X no. of days before the expiration date. I use it at as marker to take off existing positions in expiration week or roll to next expiration date or to place new trades.
Happy new year 2021 in advance and all the best traders.
Swing Reversal IndicatorSwing Reversal Indicator was meant to help identify pivot points on the chart which indicate momentum to buy and sell. The indicator uses 3 main questions to help plot the points:
Criteria
Did price take out yesterday's high or low?
Is today's range bigger than yesterday? (Indicates activity in price)
Is the close in the upper/lower portion of the candle? Thus, indicating momentum in that direction
This indicator was built to help me find pivot points for directional options trading however can be used for equities and forex swing trading and other strategies. Used in conjunction with a BB extreme can provide good setups.
Alerts are available for both the long and the short positions and the indicator will repaint as price moves.
The character Plotted can be changed in the settings
The size of the candle area can be changed as well if you want to tighten/loosen the trigger points based on the third question above.

PpSIgnal Quantile Band 4.0Quantile band: In statistics and the theory of probability, quantiles are cutpoints dividing the range of a probability distribution into contiguous intervals with equal probabilities, or dividing the observations in a sample in the same way.
Quantitative Qualitative Estimation is based on a rather complex calculation of the smoothed RSI indicators.
The QQE indicator consists of a smoothed Relative Strength Index ( RSI ) indicator and two volatility-based trailing levels (fast and slow). The Fast Trailing Level (TL) and Slow TL are constructed by calculating the ATR of the smoothed RSI over n-periods and then further smoothing the ATR using an additional n-periods Wilders smoothing function. This smoothed ATR of RSI is then multiplied by the Fast and Slow ATR Multipliers to calculate the final Fast and Slow Trailing Levels.
Buy when the Quantile band is green.
Sell when the Quantile band is red.
when the quantile band is gray hold

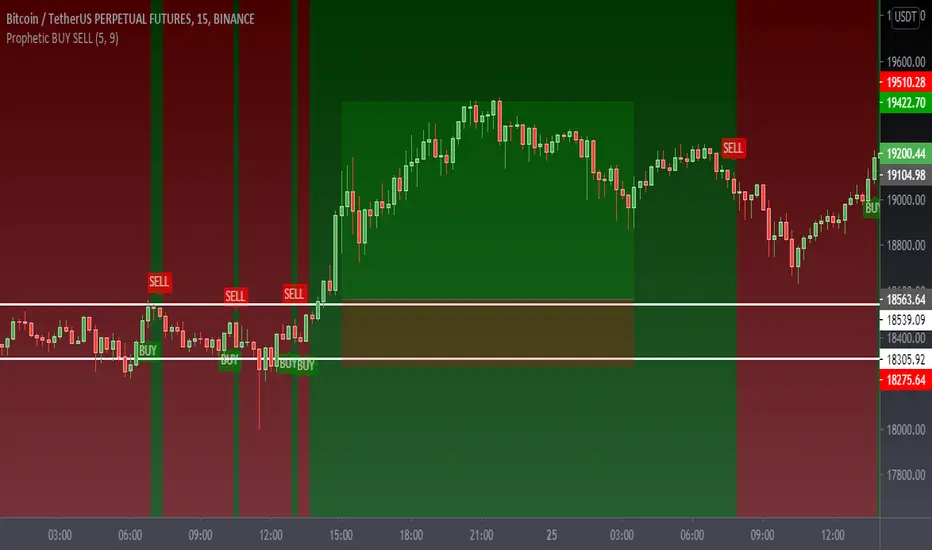
Prophetic BUY SELL IndicatorThis premium indicator will help you to do quick scalping on Cryptocurrencies, Forex, and Stocks.
This indicator is very simple to understand.
Green BUY Alert - Buy Signal Market is up
Red SELL Alert - Sell Signal Market is down
Caution:- Do not use it during market being choppy or sideways
Once the BUY signal appears the background changes green and same with SELL it turns red
can change the color according to requirements
It also has a moving average which also changes the color as the candles close above the MA or the below Default color are green and red
Please Like Share and Follow and if required please contact:- @mobudd (TELEGRAM)
or Ping me on trading view
Guys, It takes effort so please do not ask for free access.
You're always welcome to share any type of suggestion & feedback.
Trendy Bar Trend Color LiteLite version of the original Trendy Bar Trend Color
This will only color the candlestick body of your chart
Can be used with solid, hollow, renko, or any other chart type
Custom coloring for Highs, Lows, and consolidation is removed

Buy/Sell ZonesEN:
This indicator is made to display main buy/sell zones of an asset. The core parameters are: Price, Volume and Donchian Channels.
It is more trend-based and may be suitable for swing traders or those who trade higher timeframes (1D and above).
The plotted colors display the dominance of buyers, sellers or indecision on the market at the current timeframe.
If the zone is green - consider opening Long/Buy positions.
If the zone is red - consider opening Short/Sell or scale out your position.
The white zone displays indecision between Bulls and Bears - consider not to take any trades within white zone.
RU:
Этот индикатор показывает зоны покупателя/продавца выбранного актива. Основные параметры расчета: Цена, Объем и Каналы Дончиана.
Он является индикатором трендового анализа и больше подходит для свинг-трейдеров или тех, кто торгует на старших таймфреймах (от 1Д).
Отображаемые цвета показывают доминацию продавца, покупателя или неопределенность на рынке в конкретный временной период.
Зеленая зона указывает на преобладание покупателя - возможно открытие длинных позиций/покупок .
Красная зона указывает на преобладание продавца - потенциальный момент для открытия коротких позиций/продаж или сокращения своих длинных позиций/покупок .
Белая зона указывает на неопределенность на рынке - в этой зоне лучше не предпринимать никаких торговых решений .
EN: This indicator may be used for Crypto markets
RU: Этот индикатор можно использовать для криптовалютных рынков
BITSTAMP:BTCUSD
BITSTAMP:ETHUSD
COINBASE:COMPUSD
EN: Stocks, CFD and commodities
RU: Акций, CFD и рынков сырьевых товаров
FOREXCOM:SPXUSD
NASDAQ:TSLA
NYSE:BA
NASDAQ:EBAY
FOREXCOM:XAUUSD
EN: Consider using it with respect to Your trading style, money- and risk-management as well as other indicators
RU: Используйте этот индикатор в соответствии со своим стилем торговли, риск-, мани-менеджментом и другими индикаторами.

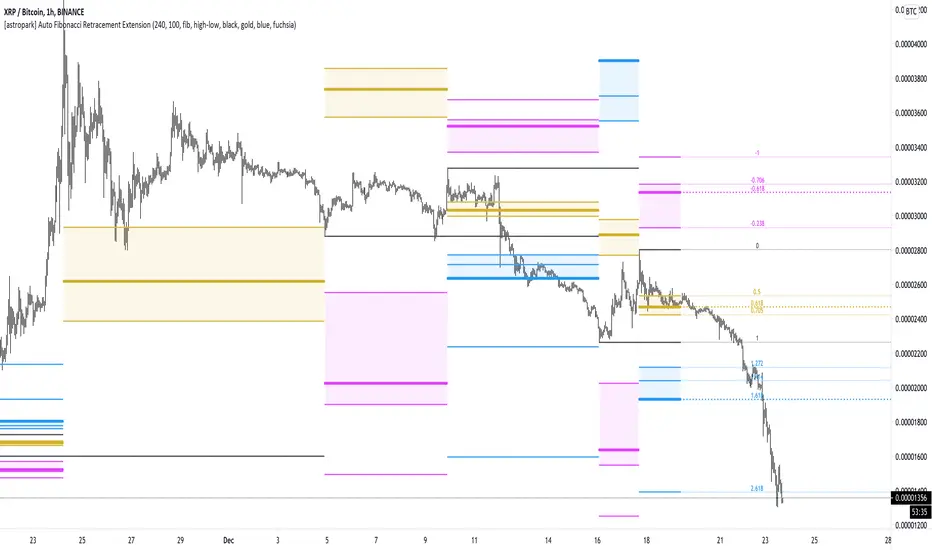
[astropark] Auto Fibonacci Retracement ExtensionDear followers,
today a new analysis tool for day trading, scalping and swing trading: Automatic Fibonacci Retracements and Extensions drawer!
It works on every timeframe and market, as it simply draws automatically most important fibonacci levels on the chart.
Based on the analysis window set (default 100 bars, but you can edit it as you like), it finds recent high and low and start drawing the following levels:
recent high and low (black)
golden retracement range: 0.5 * 0.618 * 0.705 fibonacci retracements (gold)
fibonacci extensions range above 1: 1.272 * 1.424 * 1.618 * 2.618 * 4.236 (blue)
fibonacci extensions range below 0: -0.238 * -0.618 * -0.706 * -1(fuchsia)
Whenever the indicator finds a new high or a new low, al fibonacci levels are re-draw automatically.
The indicator will let you:
change analysis window
enable displaying labels related to current fibonacci levels and/or prices
change colors
show/hide each specific level
How to use the indicator?
Basically, all techniques which apply to fibonacci tool are valid here too.
After a big move up or down, a new high or low is created and a retracement is expected: if trend is strong, retracement to golden ration 0.618 will be a perfect spot for buy or sell respectively in order to continue riding the trend.
In general a bounce is always expected when price hit 0.618 retracement , good to know for scalping traders, while swing trades will continue holding the trade for higher profits.
If the golden retracement range (0.5 - 0.705) is broken and then retested from the other side, a continuation move is expected towards previous high/low (fib level 1) and even more towards the fibonacci extensions range above 1 (1.618 - 2.618 - 4.236).
If the base of bounce and trend continuation on golden retracement range, traders can expect
price to hit again previous high/low and
if trend is strong, a consolidation near the previous high/low range (conditions that are respectively bullish and bearish)
do a further continuation towards -0.618 fib level range
Traders must always understand that
the higher the timeframe, the stronger is the meaning and so the reaction when a specific fibonacci level is hit
don't trade blindly, try to find confluences to have an higher chance to be in a winning trade in near future
money and risk management are very important, so manage your position size and always have a stop loss in your trades
As said, this indicators work on every timeframe and in all markets (Crypto currencies, stocks, FOREX, indexes, commodities). Here some examples:
BTCUSDT 1D: after a long run, a retracement is expected and a bounce at 0.618 golden level is more than obvious: perfect short (sell) entry
BTCUSDT 1D: again as previous example, after a long run, a retracement is expected as well as price's bounces back above
EURUSD 1h: lots of info here, directly in the chart below:
bounces on 0.618 golden zone
double top
price breaks 0.618 level and retests it from below targeting previous low
double bottom and bounce back towards golden zone
bearish consolidation at recent low and further decline towards 1.618 fib extension
AMZN 1h stock: lots of info here too, directly in the chart below:
new high is print, price retrace to golden zone
bounces on 0.618 golden zone
price breaks 0.618 level and retests it from below targeting previous low
double bottom and bounce back towards golden zone
rejection at golden zone, price falling targeting previous low again and probably 1.618 fib extension
price breaks hard previous low and hits fib extension range below recent low
price retraces back up towards new golden retracement range
golden retracement range is broken and used as support: targets are previous high and 1.618 extension
once 1.618 extension level is broken and retested successfully as support, price moves towards 2.618 fibonacci extension level
SPY (SPX500) index: lots of info in the chart
interesting to note that March 2020 huge dump can be totally mapped as a series of fibonacci level bounces, so you understand the importance of riding a trend now, right?
after the low was formed, price retraced perfectly to golden ration 0.618
each time price hit a golden level/range, it retraces creating double top and double bottom configurations too
In the chart below we can see the power of the double bottom at golden retracement level: targets are previous high and -0.618 fibonacci extension level
XAUUSD 15m: as we are in a lower timeframe, the default analysis windows has been reduced to 50.
What can we see here:
golden retracement and price is rejected towards previous low
golden retracement hit and price bounces back lower
new high is formed: golden retracement hit and price bounces back higher
price break previous high and hits fibonacci extensions -0.618 and -1
price continues rising forming a regular bearish divergence with RSI
once uptrend is broken, price falls dramatically
first target is 0.618 retracement level, where you see a very small retracement due to strength of sellers
second target is previous low, which is broken and retested many time from below (bearish retest)
third target is fibonacci extension range (in this case 1.414 is almost hit)
as an hidden bullish divergence with RSI was created, price goes back up
This is a premium indicator , so send me a private message in order to get access to this script.
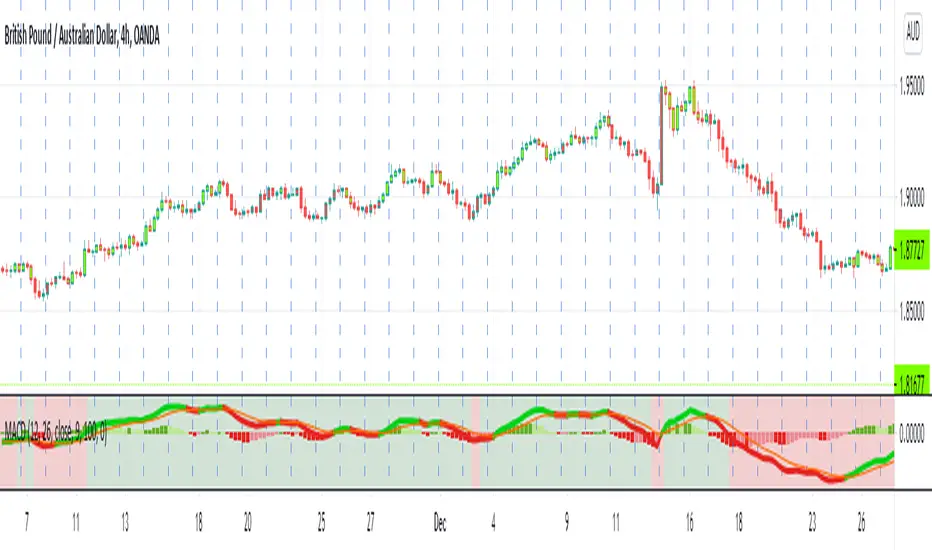
MACD with 3 strategiesMACD WITH 3 STRATEGIES
- Macd line change colour when cross the signal line
- Background Color change colour based on a moving average, on settings the value of the moving average can be changed 50,100,150,200
- Strategy one based on Macd lines with bar changing colours
- Strategy two based on Macd lines but with a different method
- Strategy three based on two other trending indicators
This indicator can be used to spot trends and changing of direction of the market and with the bar coloured its easier to identify them.
The strategy one can be used as confirmation of a trend or as changing direction integrated with other indicators like Rsi , Stochastic, Supertrend , Bollinger band, with ema option mode works better.
The strategy two can be use together with the back ground colour: When is red and the candles are red can be identified as strong drown trend.
When is green and the candles are green can be identified as strong up trend.
The strategy three can be used after checked the strategy two for more confirmation for a trend.
VERY IMPORTANT WHEN YOU TRY A NEW STRATEGY TEST IT IN A DEMO ACCOUNT FOR AT LEAST 3 MONTHS
Every donations will be devolved to cancer research and you ll have one month free trial.
If you want to purchase this indicator 30% will be devolved to cancer research.
Please leave a comment or message me if you want you have two weeks trial.
Enjoy!
[astropark] DMI/ADX strategy [alarms]Dear Followers,
today I'm happy to share with you my DMI / ADX Strategy .
It provides directional trend information, so if a bullish or a bearish trend is going to start. Statistically it works better on lower timeframes (from 5 minutes to 1 hour).
It is both a Swing and Scalping Strategy indicator , based on a simple trend following theory , good for trading FOREX, Indexes, Stocks, Commodities and Cryptocurrencies.
To help in Taking Profits, the strategy integrates 2 special other than bull/bear signals:
Overbought and Oversold RSI Signals , which appear both as darker background (the darker the color, the more the price is in overbought/oversold) and green "ob"-"tp" / red "os"-"tp" labels (they optionally pop up only on a configurable stronger overbought/oversold condition) (you can enable/disable it optionally)
Peak Profit Tracker , which resets every time a new trade starts and keeps track of price fluctuation during the trade: the message is don't be too greedy and take profits or lock them with a stoploss in profit (you can enable/disable it optionally)
You can edit many options in order to
have more/less bull/bear signals
enable/disable showing bull/bear signals
enable/disable showing RSI TP signals (you can edit RSI length, overbought (OB) and oversold (OS) levels)
enable/disable showing peak profits on each trade
The user who wants to use this strategy, especially via an automated bot, must always set a stoploss (example 150$ from entry on bitcoin ) or use a proper risk management strategy .
This is not the "Holy Grail", so use it with caution. It's highly suggested to use a proper money management .
This script will let you set all notifications you may need in order to be alerted on each triggered signals.
You can find the strategy version for backtesting here below:
Here there are some examples how this DMI / ADX strategy works on many markets:
LTC/USDT 15m
BTC/USD 15m
BNB/BTC 15m
ETH/USD 15m
GOLD (XAU/USD) 15m
GOLD (XAU/USD) 1h
FB 15m
AAPL 15m
TSLA 1h
BANKNIFTY Index 5m
NIFTY 50 Index 5m
This is a premium indicator , so send me a private message in order to get access to this script .
