[astropark] Trend Is Your Friend V3 [strategy]Dear Followers,
today another awesome Swing and Scalping Trading Strategy indicator, runnable on a bot , which works great on High Timeframes (1D is suggested) but also on lower ones (just write me in order to help you find correct settings) and even better on 1m Renko chart!
If you are a scalper, you will love suggested entries for fast profit. You can run it on 1h timeframe (below is not suggested, there is "no-trend" below 1h!) if you are used to scalp trading and close each trade whenever you feel happy (a proper trailing stop strategy is suggested anyway).
This is not an evolution of "Trend Is Your Friend V1" or V2 , but a twin sister or the "Trend Is Your Friend V1" indicator you can see here below
and twin sister or the "Trend Is Your Friend V2" indicator you can see here below
This strategy differs for the engine used as basis, but has the same usage settings:
enable/disable signals on chart
enable/disable showing trend cloud
enable/disable bar coloring based on trend
enable/disable background coloring based on trend
edit trend period length (direct message me in order to help you fine best settings)
edit a smart variant option to enhance the trend cloud on your chart
enable/disable an option to smart enter trade
This strategy only trigger 1 buy or 1 sell. In order to get notified when a signal is triggered, you need to use the "alarms" version of this indicator.
Strategy results are calculated on the timeframe from December 2012 to now, so on 8 years, using 10000$ as initial capital and working at 1x leverage (so no leverage at all! If you like to use leverage, be sure to use a safe option, like 3x or 5x at most in order to have liquidation price very far).
This is not the "Holy Grail", so use a proper risk management strategy.
This script will let you backtest how the indicator will perform on any chart you may test. Of course results will be very different depending on the chart and timeframe you will open. I tested a lot of charts and always you can find a combination that keep this strategy in profit on swing trading style (and this means that if you can have a daily look at the chart you can always manage to maximize your profit on each trade!)
The alarms version of this indicator, which will let you set all notifications you may need in order to be alerted on each triggered signals, can be found by searching for the astropark's "trend is your friend v3" and then choosing the indicator with "alarms" suffix in the name.
This is a premium indicator , so send me a private message in order to get access to this script.
Stocks!

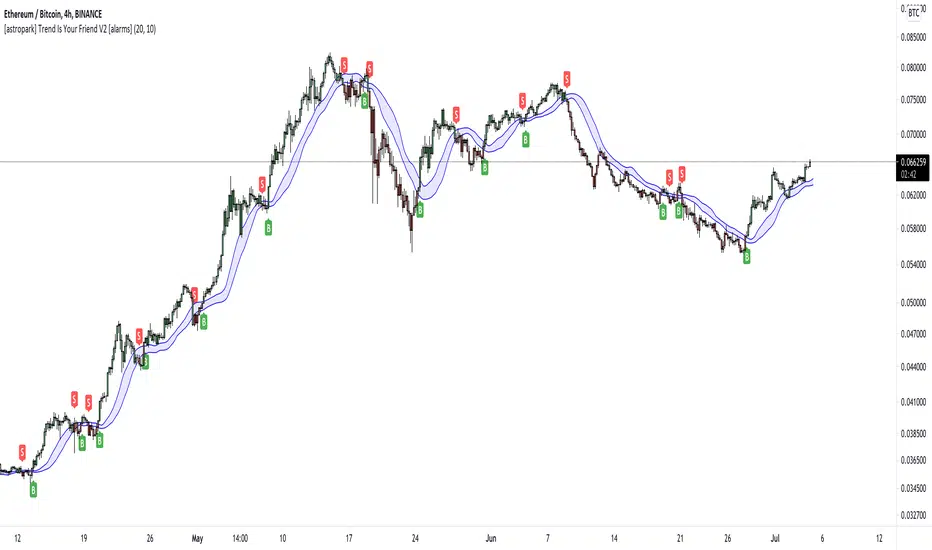
[astropark] Trend Is Your Friend V2 [alarms]Dear Followers,
today another awesome Swing and Scalping Trading Strategy indicator, runnable on a bot , which works great on High Timeframes (1D is suggested) but also on lower ones (just write me in order to help you find correct settings) and even better on 1m Renko chart!
If you are a scalper, you will love suggested entries for fast profit. You can run it on 1h timeframe (below is not suggested, there is "no-trend" below 1h!) if you are used to scalp trading and close each trade whenever you feel happy (a proper trailing stop strategy is suggested anyway).
This is a twin sister or the "Trend Is Your Friend V1" indicator you can see here below
This strategy differs for the engine used as basis, but has the same usage settings:
enable/disable signals on chart
enable/disable showing trend cloud
enable/disable bar coloring based on trend
enable/disable background coloring based on trend
edit trend period length (you have to increase it if you go on lower timeframes or you go on FOREX/Stocks market, direct message me in order to help you fine best settings)
This strategy only trigger 1 buy or 1 sell. In order to get notified when a signal is triggered, you need to use the "alarms" version of this indicator.
Strategy results are calculated on the timeframe from January 2015 to now, so on 5 years, using 10000$ as initial capital and working at 1x leverage (so no leverage at all! If you like to use leverage, be sure to use a safe option, like 3x or 5x at most in order to have liquidation price very far).
This is not the "Holy Grail", so use a proper risk management strategy.
This script will let you set all notifications you may need in order to be alerted on each triggered signals.
The one for backtesting purpose can be found by searching for the astropark's "trend is your friend" and then choosing the indicator with "strategy" suffix in the name, or you can find here below
This is a premium indicator , so send me a private message in order to get access to this script.
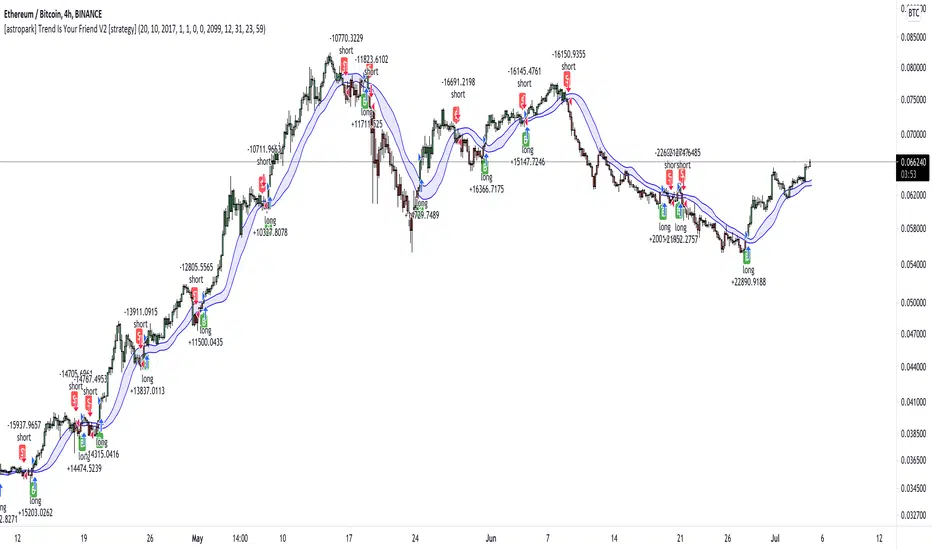
[astropark] Trend Is Your Friend V2 [strategy]Dear Followers,
today another awesome Swing and Scalping Trading Strategy indicator, runnable on a bot , which works great on High Timeframes (1D is suggested) but also on lower ones (just write me in order to help you find correct settings) and even better on 1m Renko chart!
If you are a scalper, you will love suggested entries for fast profit. You can run it on 1h timeframe (below is not suggested, there is "no-trend" below 1h!) if you are used to scalp trading and close each trade whenever you feel happy (a proper trailing stop strategy is suggested anyway).
This is a twin sister or the "Trend Is Your Friend V1" indicator you can see here below
This strategy differs for the engine used as basis, but has the same usage settings:
enable/disable signals on chart
enable/disable showing trend cloud
enable/disable bar coloring based on trend
enable/disable background coloring based on trend
edit trend period length (you have to increase it if you go on lower timeframes or you go on FOREX/Stocks market, direct message me in order to help you fine best settings)
This strategy only trigger 1 buy or 1 sell. In order to get notified when a signal is triggered, you need to use the "alarms" version of this indicator.
Strategy results are calculated on the timeframe from January 2015 to now, so on 5 years, using 10000$ as initial capital and working at 1x leverage (so no leverage at all! If you like to use leverage, be sure to use a safe option, like 3x or 5x at most in order to have liquidation price very far).
This is not the "Holy Grail", so use a proper risk management strategy.
This script will let you backtest how the indicator will perform on any chart you may test. Of course results will be very different depending on the chart and timeframe you will open. I tested a lot of charts and always you can find a combination that keep this strategy in profit on swing trading style (and this means that if you can have a daily look at the chart you can always manage to maximize your profit on each trade!)
The alarms version of this indicator, which will let you set all notifications you may need in order to be alerted on each triggered signals, can be found by searching for the astropark's "trend is your friend v2" and then choosing the indicator with "alarms" suffix in the name.
This is a premium indicator , so send me a private message in order to get access to this script.
[astropark] Trend Is Your Friend V1 [alarms]Dear Followers,
today another awesome Swing and Scalping Trading Strategy indicator, runnable on a bot , which works great on High Timeframes (1D is suggested) but also on lower ones (just write me in order to help you find correct settings) and even better on 1m Renko chart!
If you are a scalper, you will love suggested entries for fast profit. You can run it on 1h timeframe (below is not suggested, there is "no-trend" below 1h!) if you are used to scalp trading and close each trade whenever you feel happy (a proper trailing stop strategy is suggested anyway).
This strategy let's you edit following settings:
enable/disable signals on chart
enable/disable showing trend cloud
enable/disable bar coloring based on trend
enable/disable background coloring based on trend
enable a special option to enhance trend cloud on FOREX/Stocks charts (optional)
edit trend period length (you have to increase it if you go on lower timeframes, like 1h)
This strategy only trigger 1 buy or 1 sell. In order to get notified when a signal is triggered, you need to use the "alarms" version of this indicator.
Strategy results are calculated on the timeframe from August 2017 to now, so on almost 2 years and half, using 10000$ as initial capital and working at 1x leverage (so no leverage at all! If you like to use leverage, be sure to use a safe option, like 3x or 5x at most in order to have liquidation price very far).
This is not the "Holy Grail", so use a proper risk management strategy.
This script will let you set all notifications you may need in order to be alerted on each triggered signals.
The one for backtesting purpose can be found by searching for the astropark's "trend is your friend" and then choosing the indicator with "strategy" suffix in the name, or you can find here below
This is a premium indicator , so send me a private message in order to get access to this script.

[astropark] Trend Is Your Friend V1 [strategy]Dear Followers,
today another awesome Swing and Scalping Trading Strategy indicator, runnable on a bot , which works great on High Timeframes (1D is suggested) but also on lower ones (just write me in order to help you find correct settings) and even better on 1m Renko chart!
If you are a scalper, you will love suggested entries for fast profit. You can run it on 1h timeframe (below is not suggested, there is "no-trend" below 1h!) if you are used to scalp trading and close each trade whenever you feel happy (a proper trailing stop strategy is suggested anyway).
This strategy let's you edit following settings:
enable/disable signals on chart
enable/disable showing trend cloud
enable/disable bar coloring based on trend
enable/disable background coloring based on trend
enable a special option to enhance trend cloud on FOREX/Stocks charts (optional)
edit trend period length (you have to increase it if you go on lower timeframes, like 1h)
This strategy only trigger 1 buy or 1 sell. In order to get notified when a signal is triggered, you need to use the "alarms" version of this indicator.
Strategy results are calculated on the timeframe from August 2017 to now, so on almost 2 years and half, using 10000$ as initial capital and working at 1x leverage (so no leverage at all! If you like to use leverage, be sure to use a safe option, like 3x or 5x at most in order to have liquidation price very far).
This is not the "Holy Grail", so use a proper risk management strategy.
This script will let you backtest how the indicator will perform on any chart you may test. Of course results will be very different depending on the chart and timeframe you will open. I tested a lot of charts and always you can find a combination that keep this strategy in profit on swing trading style (and this means that if you can have a daily look at the chart you can always manage to maximize your profit on each trade!)
The alarms version of this indicator, which will let you set all notifications you may need in order to be alerted on each triggered signals, can be found by searching for the astropark's "trend is your friend" and then choosing the indicator with "alarms" suffix in the name.
This is a premium indicator , so send me a private message in order to get access to this script.

Auto-fibsAutomatically plots Fibonacci Retracement levels.
Uses the all time high (ATH) for a specified number of days back, and the lowest value since the ATH, to plot the levels.

BEST Supertrend CCIHello traders
Today I present you a Supertrend not based on candle close but based on a CCI (Commodity Channel Index)
How does it work?
Bull event: CCI crossing over the 0 line
Bear event: CCI crossing below the 0 line
When the event is triggered, the script will plot the Supertrend as follow
UP Trend = High + ATR * Factor
DOWN Trend = Low - ATR * Factor
This is an alternative of the classical Supertrend based on candle close being above/beyond the previous Supertrend level.
Hope you'll enjoy it and it will improve your trading making you a better trader
Dave

Candlesticks ANN for Stock Markets TF : 1WHello, this script consists of training candlesticks with Artificial Neural Networks (ANN).
In addition to the first series, candlesticks' bodies and wicks were also introduced as training inputs.
The inputs are individually trained to find the relationship between the subsequent historical value of all candlestick values 1.(High,Low,Close,Open)
The outputs are adapted to the current values with a simple forecast code.
Once the OHLC value is found, the exponential moving averages of 5 and 20 periods are used.
Reminder : OHLC = (Open + High + Close + Low ) / 4
First version :
Script is designed for S&P 500 Indices,Funds,ETFs, especially S&P 500 Stocks,and for all liquid Stocks all around the World.
NOTE: This script is only suitable for 1W time-frame for Stocks.
The average training error rates are less than 5 per thousand for each candlestick variable. (Average Error < 0.005 )
I've just finished it and haven't tested it in detail.
So let's use it carefully as a supporter.
Best regards !

BEST Algorithm Builder STOCKSHello traders 👋
I. 💎 SCRIPTS ACCESS AND TRIALS 💎
1. Every trial request access has to be done through my website.
2. My website URL is in this script signature at the very bottom (you'll have to scroll down a bit and going past the long description) and in my profile status available here: Daveatt profile status
3. Many video tutorials explaining clearly how all our indicators work are available on our website > guides section and also on website forum + Youtube
4. You may also contact me directly for more information regarding the trading method included in the indicator or how to access it
II. Forewords
(Screenshot based on $FCEL - FUELCELL ENERGY Inc.)
This indicator is for the SWING traders looking for fixed entries based on our proprietary trading method. It's a nice complement to any intraday method
We've been working on it for months and releasing now for our subscribers.
We mostly trade the US stocks with it due to personal preference but it's working also with other international stocks.
All stocks sectors (tech, aerospace, food, energy, financial, healthcare, ...) are eligible.
We've seen quite great signals with penny stocks/biotech/tech stocks.
III. Optimized system for lowering risk/capturing most of the opportunities
We worked hard on reducing the risk as much as we could.
The built-in hard-exit (also called invalidation) system does a huge job in exiting a position way before a Stop Loss will get hit
$TSLA (TESLA)
$SAVA (CASSAVA SCIENCES)
IV. Trade Manager and compatible with dynamic alerts
It includes :
- our proprietary method with fixed entries
- a hard exit system (built-in stop-loss)
- multiple options for user-defined stop-loss/take-profit settings (price value, distance in pips, percentage, trailing, ...)
- 🔔 Compatible with dynamic alerts 🔔
Dynamic alerts are bringing automated trading to a whole new level. The third-party solutions capturing TradingView alerts are able to use them.
- Algorithmic Supports and Resistances used as safeguards and take profit zones
Final words
We made it as simple as we could (to be honest it's a very simple system for the end-user) - even with several hundreds of calculations in the indicator.
Please hit me up for any questions/feedback/comments
Become the BEST trader you deserve to be
Dave

Trendy Bar Trend ColorTrendy Bar Trend Color
Inspired by trend candlestick charts on other trading platforms. Changes bar colors to stay in trend much like Heikin Ashi candles without the ATR price distortion. This is done by comparing the HL2 and/or Open-Close values of current candlestick to the prior candlestick.

Live Mini Terminal 6 : Major U.S Indices Change DataThis script displays relative data changes occurring in the adjustable period and/or adaptive automatic period in US Major Indices.
It was inspired by the data terminals used by commercial traders.
Period selection can be adjusted in the menu.
This script uses the adaptive period algorithm used by Autonomous LSTM and Relativity scripts.
Or you can set the period manually from the menu.
For more information about adaptive period this script uses:
This script works only for 1 day (1D) and 1 week (1W) time frames.
The most efficient time frame is 1 week (1W) because of different time-zones .
Features
Value changes on a percentage basis (%)
Recently, due to increasing interest, the NQNACE index has been added.
Index descriptions are printed on the information panel.
Sentiment NYSE ARCA and AMEX indices added.
INSTRUMENTS
SP1! : S&P 500 Futures Index
DJI : Dow Jones Industrial Average Index
NDX : Nasdaq 100 Index
RUT : Russell 2000 Index
NYA : NYSE Composite Index
OSX : PHLX Oil Service Sector Index
HGX : PHLX Housing Sector Index
UTY : PHLX Utility Sector Index
SOX : PHLX Semiconductor Sector Index
SPSIBI : S&P Biotechnology Select Industry Index
XNG : NYSE ARCA Natural Gas Index
SPGSCI : S&P Goldman Sachs Commodity Index
XAU : PHLX Gold and Silver Sector Index
SPSIOP : S&P Oil and Gas Exploration and Production Select Industry Index
GDM : NYSE ARCA Gold Miners Index
DRG : NYSE ARCA Pharmaceutical Index
TOB : NYSE ARCA Tobacco Index
DFI : NYSE ARCA Defense Index
NWX : NYSE ARCA Networking Index
XCI : NYSE ARCA Computer Technology
XOI : AMEX Oil Index
XAL : AMEX Airline Index
NQNACE : Nasdaq Yewno North America Cannabis Economy Index
USAGE
The script can be used as an indicator by putting it under the chart as shown above.
It is necessary to enlarge to see clearly.
Since it is not often looked at,such use is the best method for healthy interpretation.
Regards.

Live Mini Terminal 2 : Relative USD Based Stock Markets Change This script displays relative data changes occurring in the adjustable period and/or adaptive automatic period in various stock markets.
It was inspired by the data terminals used by commercial traders.
Period selection can be set in the menu.
This script uses the adaptive period algorithm used by Autonomous LSTM and Relativity scripts.
Or you can set the period manually from the menu.
For more information about adaptive period this script uses:
This script works only for 1 day (1D) and 1 week (1W) time frames.
The most efficient time frame is 1 week because of different time-zones (1W) .
Features
Value changes on a percentage basis (%)
Stock exchange values are calculated in dollar terms.
Due to the advantage of movement, future data were chosen instead of spot values on the required instruments.
INSTRUMENTS
Usa : S&P 500 Futures
Japan: Nikkei 225 Futures
England: United Kingdom (FTSE) 100
Australia: Australia 200
Canada: S&P / TSX Composite
Switzerland: Swiss Market Index
New Zealand: NZX 50 Index
China: SSE Composite (000001)
Denmark: OMX Copenhagen 25 Index
Hong-Kong: Hang Seng Index Futures
India: Nifty 50
Norway: Oslo Bors All Share Index
Russia: MOEX Russia Index
Sweden: OMX Stockholm Index
Singapore: Singapore 30
Turkey: BIST 100
South Africa: South Africa Top 40 Index
Spain: IBEX 35
France: CAC 40
Italy: FTSE MIB Index
Netherlands: Netherlands 25
Germany : DAX
USAGE
The script can be used as an indicator by putting it under the chart as shown above.
It is necessary to enlarge to see clearly.
Since it is not often looked at,such use is the best method for healthy interpretation.

Volume per Price rate on chart
This indicator measures the change in price with volume.
"X" is displayed when the price movement is too large for the volume.
If the price movement is small, display a label.
You may be deceived if price movements are large relative to volume.
If price movements are small relative to volume, you may be collecting.
このインジケータは出来高に対する価格の変化を測定しています。
出来高に対して価格の動きが大きすぎる場合は”X"を表示します。
価格の動きが小さい場合はラベルを表示します。
出来高に対して価格の動きが大きい場合は騙されているかもしれません。
出来高に対して価格の動きが小さい場合は、集めているかもしれません。
主に株の日足に対して利用します。X印やラベルが表示された場合、相場の転換点かもしれません。

ATR CHANNEL .2Channel based on 100MA & daily ATR / volatility - whole point is to warn and show you where not to participate. Signals can be considered as higher probability trades, short term reversal type scalps - especially effective at FX and stock trading

TRENDSPOTTERHi Guys,
So TrendSpotter uses multiple indicators to catch trend moves as they happen. All you have to do it follow the entries when 2 green or red arrows appear, you enter the move.
Basically it has a few rules.
1.I trade the 1 min time-frame
2.The background turns Red ( Short ) or Green ( Long ) when the stock is going that direction.
3. Wait until the Psar is under for Long and over for Short.
4. Wait until the second Green for Long or Red for Short Arrow to appear. You are getting in on the end of the first one.
Here's my profile on Tradingview.com with all the explanations of how to use it. It can be used for FOREX and CRYPTO also.
www.tradingview.com
Check out my videos to see it's not that complicated.
If you have any questions please contact me.
Thanks,
Enda

ZoneBand (@Mido_yuiya)Bollinger band is converted to EMA , and support and resistance bands are made into regions

[LunaOwl] 樂活投資:價格通道 (LOHAS Investor - PriceChannel)- Introduction -
Price channel is an ancient strategy, which is very convenient for office workers. since most people no time do it.
so they are suitable for simple strategies. There are several conditions to become a "LOHAS Investor" -
價格通道是很老的投資策略,對於肯做功課的上班族來說非常方便,而且多數人沒時間操作。
如果要當「樂活投資人」有幾點條件:
1) set moderate ROI expectations.
- 設定溫和的投資報酬率期望。
2) use appropriate stock selection methods to build portfolios and reduce single error rates.
- 使用適當的選股方式建立投資組合,減少單一股票失誤率。
3) simple trade strategy, executed regularly.
- 使用簡單的策略規律執行。
4) wealth accumulates over time and learns every day.
- 財富依靠時間積累,每天勤學新知。
PpSignal RSI Bands Version 2This the mtf Rsi on the chart version
look at the picture and you can understand everything.
You have on the chart the middle line 50 overbought 70 and oversold lever 30 , like the oscillator in bellow out the chart.
we added Bollinger band 20, 1 and qqe move average, rsi on the chart (green and red line with circles), Heiken Ashi rsi style and rsi offset move average (yellow color).
Enjoy it

PpSignal RSI MTF 3.19This Rsi oscillator have a donichian channel en middle move average included.
have got a QQE or atr move average.
Show new high and new low according to the pivot point.
Show Rsi divergence.
MTF option.

SAMURAI SWORDSamurai Sword is an add on tool for Ninja Scalper and the next evolution of the Trend Trade Indicator.
It auto plots the fib retracement to speed up target acquisition support and resistance areas based on the formula to increase the success rate of trade entry and exits.
None of this is to be taken as investment advice but rather Edutainment and infotainment
#TradeSocially

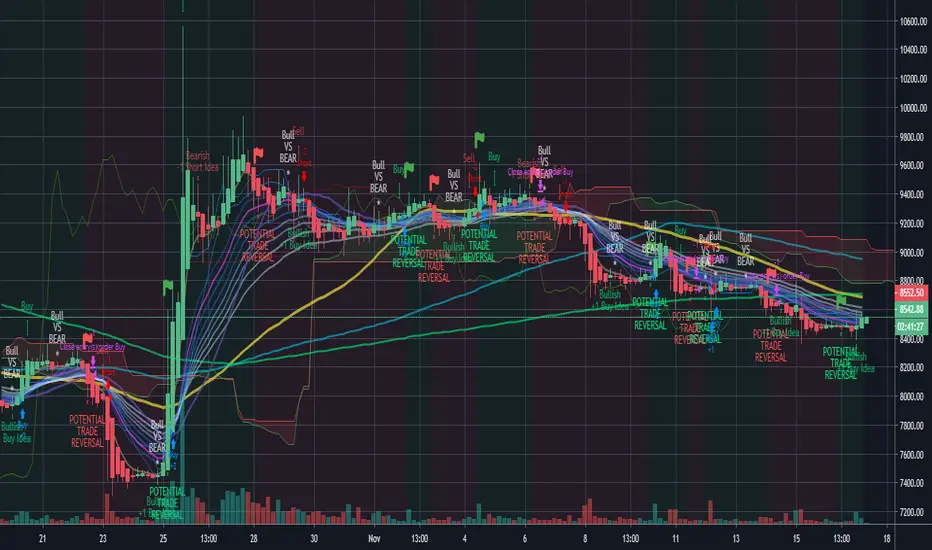
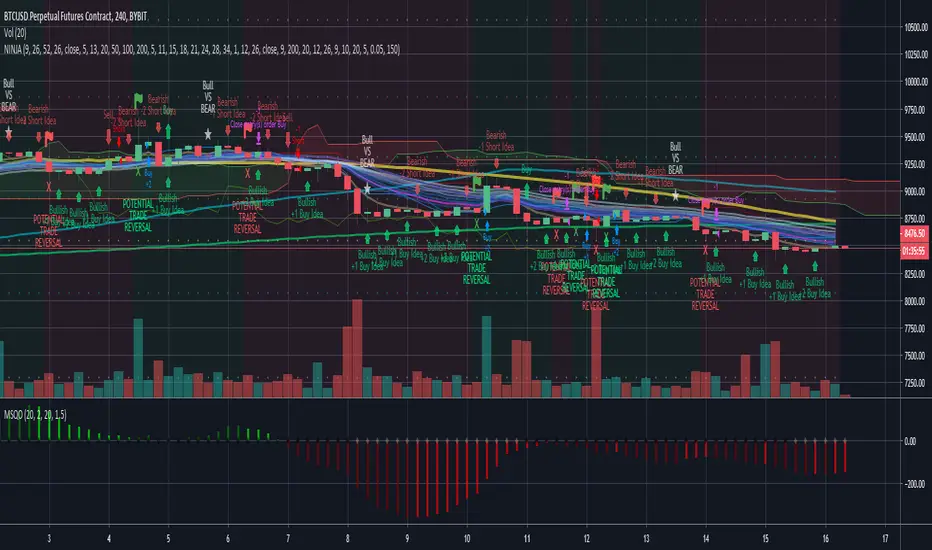
NINJA SCALPERNinja Scalper is the next evolution of the Trade Trend Indicator.
I have been trading for over 23 years now and these indicators are based on my trading style risk verse reward. The change in this is to make it more responsive and to integrate with Sword.
The background of this indicator is:
The original Trade Trend Indicator (indicator) has been the brain child of 23 years of trading experience rolled into a simple to understand all market setup alert system based solely on 5 high probability trade set ups with a 6th high risk. The hope is to provide something that is can assist traders in building confidence in their trades with a little assistance from the indicator.
This like any and all indicators is not a be all and end to trading, yes while back tested the indicator has produced fantastic profitable results; past performance is not a guarantee of future but which with human intervention can increase the return result exponentially.
You need to be able to chart simple candle sticks and you need to have an understanding of support and resistance areas to make sense of what you are doing in trading otherwise even this indicator won't help you.
While this may alert buy or sell / long or short entrance these are to be taken as educational points of reference and if you wish to trade you are understanding that you enter and exit at your own risk. Not many indicators will alert you to the possibility of a rogue wave spike / dump or both, this will but everything is perspective of the time frame you are on.
The indicator is designed for the 4hour time frame with trade entry on the 15min and managed on the 30min time frame. Alot can happen within these time frame but as we know not every trader can sit in front of a screen for hours at a time and this let's one trade for swings. Once you have your entry you place your exits and you set your stops. If you wait for the alert to exit you are in a draw down this should never reach that point pay yourself for being right.
The some set ups are simple:
1. Trend change from bearish to bullish buys are dip interim support entries.
2. Trend change from bullish to bearish sells are top interim resistance exits.
3. Blue buy is an entry position for a trade.
4. Blue long is an add position for a trade.
5. Red short is just that a short trade idea. (this is advanced and requires a manual cover target),
6. Green buy is a break out over the next candle to print above (highest risk)
All trades are based on a 5% to 10% of capital entry with no more than 40% ever in 1 trade goal is many consistent trade wins while limiting the losses and size.
Certain set ups such as longs over the Moving Averages but below the cloud can lead to strong rally returns as well as short in a bearish trend just above the Moving Averages can give prolonged selling pressure.
Pay attention to the golden dump line as it rises the closer to the candle it gets the higher the risk of the trade lacking continuation.
None of this is to be taken as investment advice but rather Edutainment and infotainment
#TradeSocially
BTC BRAWL NINJA TRADERThe NINJA TRADER was devloped for trading competition higher leverage scalp trading. It is a modified from my Trade Trend Indicator (indicator) has been the brain child of 23 years of trading experience rolled into a simple to understand all market setup alert system based solely on 5 high probability trade set ups with a 6th high risk. The hope is to provide something that is can assist traders in building confidence in their trades with a little assistance from the indicator.
This like any and all indicators is not a be all and end to trading, yes while back tested the indicator has produced fantastic profitable results; past performance is not a guarantee of future but which with human intervention can increase the return result exponentially.
You need to be able to chart simple candle sticks and you need to have an understanding of support and resistance areas to make sense of what you are doing in trading otherwise even this indicator won't help you.
While this may alert buy or sell / long or short entrance these are to be taken as educational points of reference and if you wish to trade you are understanding that you enter and exit at your own risk. Not many indicators will alert you to the possibility of a rogue wave spike / dump or both, this will but everything is perspective of the time frame you are on.
The indicator is designed for the 4hour time frame with trade entry on the 15min and managed on the 30min time frame. Alot can happen within these time frame but as we know not every trader can sit in front of a screen for hours at a time and this let's one trade for swings. Once you have your entry you place your exits and you set your stops. If you wait for the alert to exit you are in a draw down this should never reach that point pay yourself for being right.
The set ups are simple:
1. Trend change from bearish to bullish buys are dip interim support entries.
2. Trend change from bullish to bearish sells are top interim resistance exits.
3. Blue buy is an entry position for a trade.
4. Blue long is an add position for a trade.
5. Red short is just that a short trade idea. (this is advanced and requires a manual cover target),
6. Green buy is a break out over the next candle to print above (highest risk)
All trades are based on a 5% to 10% of capital entry with no more than 40% ever in 1 trade goal is many consistent trade wins while limiting the losses and size.
Certain set ups such as longs over the Moving Averages but below the cloud can lead to strong rally returns as well as short in a bearish trend just above the Moving Averages can give prolonged selling pressure.
Pay attention to the golden dump line as it rises the closer to the candle it gets the higher the risk of the trade lacking continuation.
Made the golden dump line easier to bringing it forward.
Changed the trade trend reversal to stand out more as a marker of a trade even when alerts stacked
Added a calculation for the alert to recalculate based on the time frame chosen
Added a check balance verse the break out buy as to not false alert during the BTC BRAWL CHALLENGE in high risk trade setups
Added notification of bullvsbear action to avoid being caught in the BTC BRAWL CHALLENGE
Added a take profit reminder based on time frame volume
None of this is to be taken as investment advice but rather Edutainment and infotainment
//#TradeSocially
Total Trend Follow Study with Alerts, Pyramid and DCA
Introduction
This is the study version of my trend following strategy. It is designed to be a “drop in” replacement for its twin strategy. I have replicated the analysis logic and entry and exit procedures to produce a nearly identical result set to the strategy. Other than the properties tab, the inputs dialog is exactly the same. Backtest the strategy to determine the best inputs to trade. Then apply the same inputs to this study to forward test. Alerts are available for trade entry, take profit close, stop-loss exit and pyramid level. Please see the strategy version for a complete description of the trading behavior of this script.
In brief, this script is intended to benefit from long duration trending markets. The trading behavior is to buy on strength and sell on weakness. As such the trade orders maintain its directional bias according to price pressure. What you will see on the chart is long positions on the left side of the mountain and short on the right. Long and short positions are not intermingled as long as there exists a detectable trend. My trend following script uses the same pivot point calculations used by my range trader but this time rising pivots are long and falling pivots are short. I refer to pivots as a vertex in the inputs dialog box. The cone based measurement adds a peak, sides and a base to the calculation elements. This allows the inputs to focus on adjusting the location of trades and not just trend lines. The pivot points can be plotted on the backtest. You can use the vertex input values to move the pivots where you want trades to be. This script can be traded in four different modes: Long, Short, BiDir, and Flip Flop.
This script replicates the TradingView pyramid feature by adding a field to the inputs tab. Pyramiding works the same way in this script as its twin strategy. Each pyramid level increases the order size as a multiple of its level. This makes it easy to comply with NFA FIFO Rule 2-43(b) if the trades are executed here in America. The current pyramid level is reported in the summary label when reports are enabled. You can use this value to manually adjust the position size in your forward testing. I also expose an alert when the pyramid threshold is breached. Use the TradingView alert window to send yourself a message when the level increases.
In addition to pyramiding this script employs a DCA feature which can increase the order size in response to stopped out or winning streak trades. The number of losing trades is tracked through the “Debt Sequence” value displayed in the summary report. When the debt is recovered the sequence number resets to zero. You can use the “Debt Sequence” number to manually manage DCA on your forward test. The main difference between DCA and pyramids is that this implementation of DCA applies to new trades while pyramids affect open positions. If DCA is enabled be sure to set the limiter to prevent your account from depleting capital during runaway markets.
I also have a range trading version of this script for those not interested in trend following.
Design
This script is approximately 1800 lines of Pine 4 code and implements nine indicators on two time frames. The chart (primary) interval and one higher time frame which is based on the primary. The higher time frame identifies the trend for which the primary will trade. The original trading algorithms are a port from a much larger program on another trading platform. I've converted some of the statistical functions to use standard indicators available on TradingView. The setups make heavy use of the Hull Moving Average in conjunction with EMAs that form the Bill Williams Alligator as described in his book “New Trading Dimensions” Chapter 3. Lag between the Hull and the EMAs form the basis of the entry and exit points. The alligator itself is used to identify the trend main body.
Indicator Repainting
Indicator repainting is an industry wide problem which mainly occurs when you mix backtest data with real-time data. It doesn't matter which platform you use some form of this condition will manifest itself on your chart over time. The TradingView wiki has an in depth article on this subject in regard to the elements of the Pine language which contribute or are susceptible to this effect. In dealing with this problem from a prevention aspect in Pine, you have to accept some repaint to occur.
The goal of my repaint prevention in the study script is simply to ensure that my signal trading bias remains consistent between the strategy, study and broker. This actually turned out to be kind of a job since it interfered with another project goal to synchronize the entry and exits between the strategy and study scripts. The script execution engines are different between the Pine strategy and study. While the primary chart interval is quite manageable the higher time frame requires the security() function. TradingViewʼs higher time frame implementation, which interleaves the chart interval, combined with the critical “lookahead” parameter makes the solution necessarily complex. According the wiki regarding this issue, best practice comes down to the following two methods:
1. a = security(syminfo.tickerid, 'D', close , lookahead=barmerge.lookahead_on)
2. indexHighTF = barstate.isrealtime ? 1 : 0
indexCurrTF = barstate.isrealtime ? 0 : 1
a0 = security(syminfo.tickerid, 'D', close ,lookahead=barmerge.lookahead_off)
a = a0
This script employs method 2 with the only problem being the Pine sar() function which does not expose its internal bar series. The best work around would require hand coding the parabolic but the script is at the maximum local scopes and run-time duration so that option is not viable. So far, this hasn't proven to be much of a problem. I'm currently running several symbols, forex and crypto, the strategy and study remain highly correlated with no instances of completely opposite real-time signals. However, I have received some alerts with no corresponding plot on the chart but so far it only occurred on one symbol. I will continue to monitor this problem.
The Bottom Line. Does this script repaint. Yes, it will repaint about as much as every other multi-interval script which employs the best practice solutions available in the Pine Language.
Usage
Please be aware that the purpose of the study script is to perform forward testing of the configuration established in the backtest process. Therefore, the usage here in the study begins with the backtest configuration parameters. The following steps provide instructions to get this study script connected to the TradingView alert notification system. For a detailed description of how to create a trend following system using this script please see the strategy version.
Step 1. Create a chart with the trading instrument and interval used in the backtest.
Step 2. Find this script in the “Invite Only” section of the Indicators Dialog and apply it to the current chart.
Step 3. Copy the values from the backtest input dialog to the study.
Step 4. Open the TradingView Alert window.
Step 5. In the “Condition” drop down field find and select the name of the script.
Step 6. A new drop down field will appear with the alerts available in the script. This script exposes the following eight signals:
-- Long Entry Signal
-- Long Profit Signal
-- Long Stop-loss Signal
-- Long Pyramid
-- Short Entry Signal
-- Short Profit Signal
-- Short Stop-loss Signal
-- Short Pyramid
Select the signal for which you want notification.
Step 7. In the “Options” field select the frequency of the alert. Typically, "Once Per Bar" or "Once Per Bar Close" will be sufficient.
Step 8. Set the expiration date and time.
Step 9. Select the action of the alert. Currently TradingView offers six different actions:
-- Notify on App
-- Show Popup
-- Send Email
-- Webhook URL
-- Play Sound
-- Send Email to SMS
Step 10. Create a message to to transmitted with the alert. The script provides a default message which can be overridden with any custom description. The price, time and other reserved chart elements can be included in the message
Step 11. Click the “Create” button to generate this single alert.
Step 12. Repeat steps 1 through 11 for every signal you wish to receive.
This script is open for beta testing. After successful beta test it will become a commercial application available by subscription only. I’ve invested quite a lot of time and effort into making this the best possible signal generator for all of the instruments I intend to trade. I certainly welcome any suggestions for improvements. Thank you all in advance.
