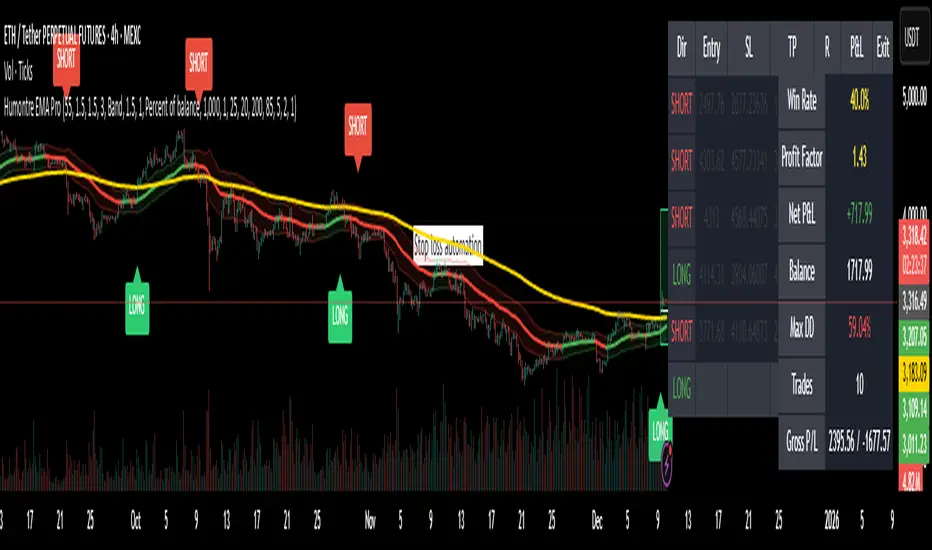
Adaptive Breakout & Risk Engine — Humontre EMA ProHumontre EMA Pro is a professional-grade trading system built for traders who want structure, clarity and real risk management integrated into every trade.
✔ No repainting
Instead of chasing signals or relying on unrealistic “high winrate” promises, this tool provides a consistent, repeatable process based on:
✔ Adaptive EMA breakout logic
✔ ATR-driven volatility channels
✔ Automatic SL/TP placement
✔ True R-multiple tracking
✔ Live trade visualization
✔ Smart signal filtering
✔ Performance statistics directly on the chart
This is more than an indicator — it’s a fully structured framework for traders who want discipline, confidence and objective risk management.
What’s included
✔ Private access to Humontre EMA Pro on TradingView
✔ Full feature set: breakout signals, EMA channel, risk engine
✔ Trailing stop system
✔ Live trade box & trade history table
✔ Win rate, profit factor, drawdown & R-metrics panel
✔ Alerts with Entry, SL, TP & risk-to-reward
✔ Continuous improvements & updates
Whether you're learning structure or refining your current system, this tool offers a clean and objective approach to trending markets: crypto, forex, metals and indices.
👤 About Humontre
I'm a trader and IT engineer who enjoys building tools that bring structure and clarity to the markets.
Humontre EMA Pro was designed to help traders visualize risk and understand trend dynamics with precision.
⚠️ Important
This is educational software. It does not guarantee profit.
Trading always carries risk.
Key Features
✔ Adapts to market volatility for precise SL/TP placement
✔ Trailing stop system
✔ Calculates Entry, Stop Loss, Take Profit and R-Multiples
✔ Filters duplicate entries and only signals the first valid setup per trend
✔ Visualizes active/past trades with P&L, R-values and exit reasons
✔ Detects high-quality trend breakouts using a dynamic EMA channel
Stop-lossmanagement
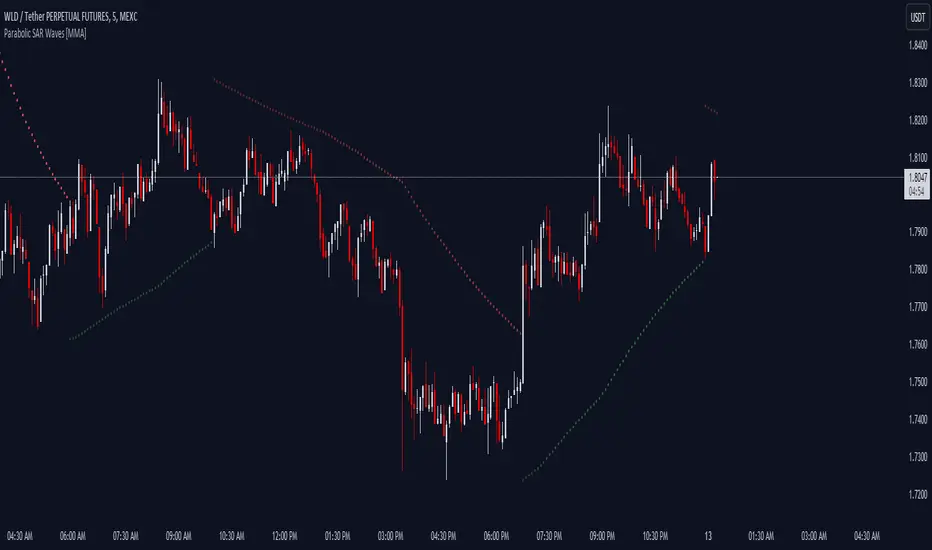
Parabolic SAR Waves [MMA]Parabolic SAR Waves
Description:
The "Parabolic SAR Waves " is an advanced version of the traditional Parabolic SAR indicator, customized for TradingView. This script incorporates dynamic acceleration factors and optional gradient coloration to enhance visual interpretation and utility for traders aiming to accurately capture trends and predict potential reversals.
Features:
- Dynamic Acceleration: Adjust the initial, incremental, and maximum values of the acceleration factor to suit various market conditions and trading preferences.
- Gradient Coloring: Use gradient colors to indicate the strength and stability of the trend, providing visual cues that are easy to interpret.
- Trend Visibility: The SAR dots are plotted directly on the price chart, making it easy to spot trend changes and maintain situational awareness.
- Overlay Feature: Designed to overlay directly on the price charts, allowing for seamless integration with other technical analysis tools.
Benefits:
- Trend Detection: Helps in identifying the beginning and potential reversal of trends, aiding in timely decision-making.
- Stop-Loss Management: Utilizes the positions of the SAR dots as dynamic stop-loss points, which helps in risk management.
- Visual Simplicity: Enhances the decision-making process through a straightforward visual representation of trend data.
Parameters:
- Acceleration Start (accel_start): The initial value for the acceleration, set to 0.02 by default.
- Acceleration Increment (accel_inc): The amount by which the acceleration increases, set to 0.005 by default.
- Acceleration Maximum (accel_max): The maximum limit of the acceleration factor, set to 0.1 by default.
- Use Gradient Colors (use_gradient): A boolean toggle to enable or disable gradient coloring, enabled by default.
Indicator Usage:
1. To apply, select this indicator from TradingView's indicator library.
2. Adjust the acceleration parameters based on your specific trading strategy and market analysis.
3. Interpret the indicator signals:
- Green SAR dots below the price bars indicate a bullish trend.
- Red SAR dots above the price bars signify a bearish trend.
- Gradient colors, if enabled, provide insights into the acceleration factor's intensity relative to trend strength.
Alerts:
- Bullish Reversal Alert: Issues a notification if there is a potential upward reversal when the trend shifts to bullish.
- Bearish Reversal Alert: Alerts when there's potential for a downward move as the trend turns bearish.
The "Parabolic SAR Waves " is a robust tool, ideal for traders who need precise, customizable trend-following capabilities that integrate seamlessly with other market analysis strategies. Enhance your trading with detailed trend insights and adaptive parameter controls.