Trade ManagerHello everyone
Hoped you had a great weekend and are ready for what's coming this week
I'll never fail to satisfy my audience on TradingView and I'll start by sharing some heavy stuff.... Imagine the most amazing thing you had in your life. You got it ? now multiply this good feeling by 100 !!! OK... now I have a tool that is beyond that litteraly. Don't believe me, here's the Trade Manager ladies and gentlemen, I could barely contain my excitement this weekend to share it with the community
I wasn't sure of sharing it but you guys did a great job with my other indicators giving me constructive feedback to improve them. Also, those helping me with such feedback usually get the indicator for a lifetime access for free.
Please read this educational post I published for you before proceeding further : How-to-set-an-indicator-to-work-with-the-Trade-manager/
From here you normally connected the data source of your own indicator to the Trade Manager. If not, here's a reminder of the article mentionned above
Step 1 - Update your indicator
Somewhere in the code you'll have a LONG and a SHORT condition. If not, please go back to study trading for noobs (I'm kidding !!!)
So it should look to something similar
macrossover = crossover(MA1, MA2)
macrossunder = crossunder(MA1, MA2)
What you will need to add at the very end of your script is a Signal plot that will be captured by the Trade Manager. This will give us :
// Signal plot to be used as external
// if crossover, sends 1, otherwise sends -1
Signal = macrossover ? 1 : macrossunder ? -1 : na
plot(Signal, title="Signal")
The Trade Manager engines expects to receive 1 for a bullishg signal and -1 for bearish .
Step 2 - Add the Trade Manager to your chart and select the right Data Source
I feel the questions coming so I prefer to anticipate :) When you add the Trade Manager to your chart, nothing will be displayed. THIS IS NORMAL because you'll have to select the Data Source to be "Signal"
Remember our Signal variable from the Two MM Cross from before, now we'll capture it and.....drumb rolll...... that's from that moment that your life became even more AWESOME
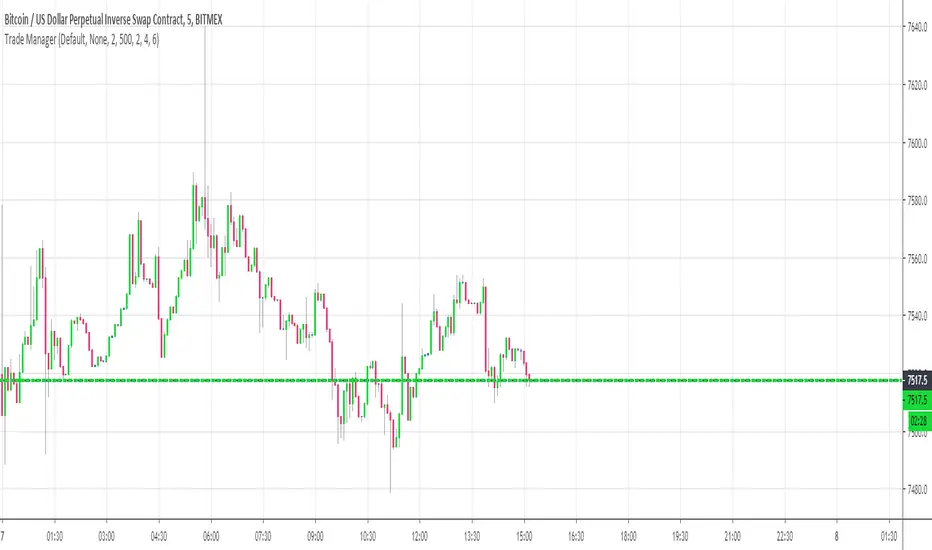
The Engine will capture the last signal from the MM cross or any indicator actually and will update the Stop Loss, Take Profit levels based on the parameters you set on the Trade Manager
Now I'll cover the different parameters of the tool
It should be straightforward but better to explain everything here
+Label lines : if unchecked, no SL/TPs/... will be displayed
+Show indicators : This does nothing. Tradingview doesn't give the possibility to set Labels on an UI so we have to use this hack with a useless checkbox
+Show PnL Panel : Will show a Panel at the right of your chart with the PnL updated for the last position only. In a future version, I'll make it work to list maybe the previous N positions defined by the user
+Show Stop Loss Signal : Will display the stop loss label. You have the choice between three options :
++Percentage : Will set the SL at a percent distance from the price
++Fixed : SL fixed at a static price
++SuperTrend : Trailing stop loss based on Supertrend
'll add many more options this week for sure
+Take Profit 1,2,3 : Visually define the three Take Profit levels
Please note that once a Take profit level is reached, it will magically disappear. This is to be expected
This indicator is a first draft of what I believe is such a great tool because can be connected to any indicator. I confess that I tried it only with a few... if you find any that's not working with the Trade manager, please let me know and I'll have a look (for free)
I'm so excited to share it with all of you and that's the best possible way I could ever dreamt of to start the week with my TradingView community
Wishing you all the best and a pleasant experience with my work
David
Stops
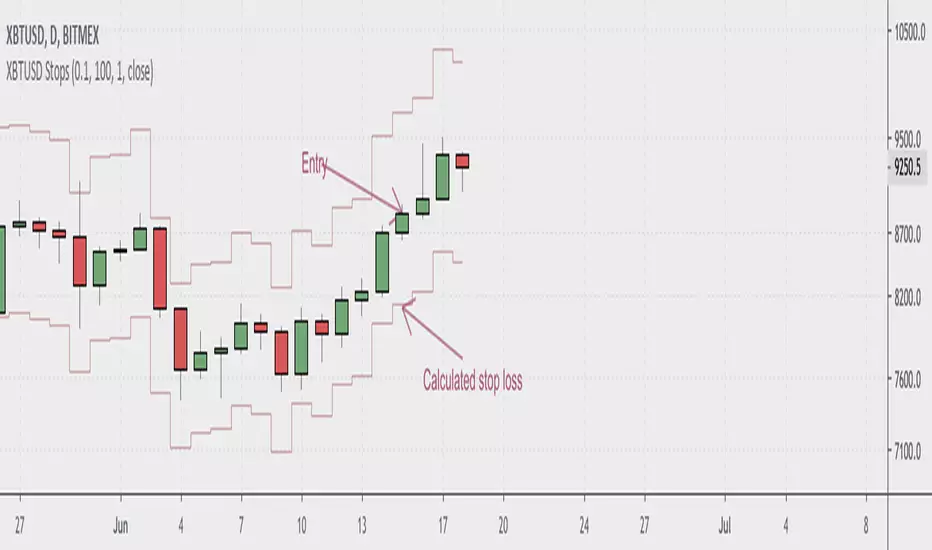
BitMex XBTUSD StopLossShows you where to place your stop loss when trading the Bitcoin swap and futures contracts on BitMex. Enter your account size, position size, and desired risk per trade in the indicator settings. If stop seems too tight, use a smaller position size. Most seamlessly used with cross leverage on BitMex. Make sure to keep an eye on the liquidation level for your trades.

ATR SL Visualization (on chart)This indicator plots 2 sets of dots (and lines) based on your chosen ATR multiplier (Average True Range).
Generally, when trading on the daily timeframe a good rule of thumb is to use the ATR * 1.5 (the default setting of this indicator).
I created this indicator to quickly test other indicators but I also find it helpful in live trading.
How to use this indicator:
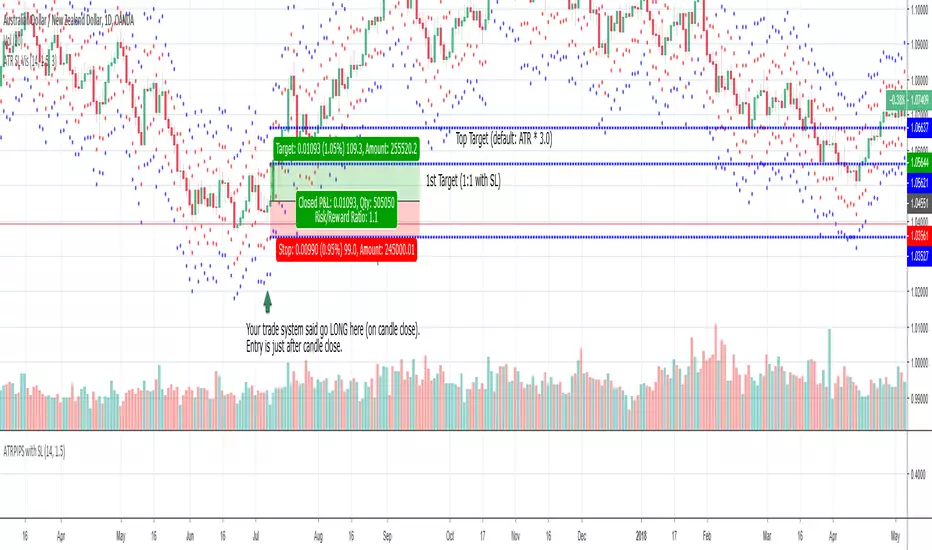
Your trade system provides an entry signal. The red dot (can be connected line in options) would be used as the stop loss for either a long or short.
Then the dot on the other side would be your first 1:1 target.
The blue line is the same ATR multiplier as a target (default but can be modified).
Using an additional tool like the horizontal ray can be helpful to see the exact location the SL might be hit or where the target might hit.
When drawing your ray ensure you’re using the right entry candle.
For instance, in a long scenario you would typically be entering a trade after your signal candle closes. So draw the ray at the point in price on the next candle for both stop loss and target.
Also use these dots (lines) as guides provides an easy way to plot SL and targets if you want to use the Long or Short tool.
For my trade systems I don’t use price targets (I exit when structure or indicators reveal to exit) but I do find it helpful to graph when testing. When something moves in my favor either the ATR or the ATR * 1.5 I take profit and typically move up my stop loss to break even or trailing.
The other strategy that could be possible but have not tested is as long as the SL is making a new high moving up a hard stop to the ATR SL each day the trade goes in your favor.
This should be obvious but if you want to use just the true ATR edit the multiplier to be 1.0
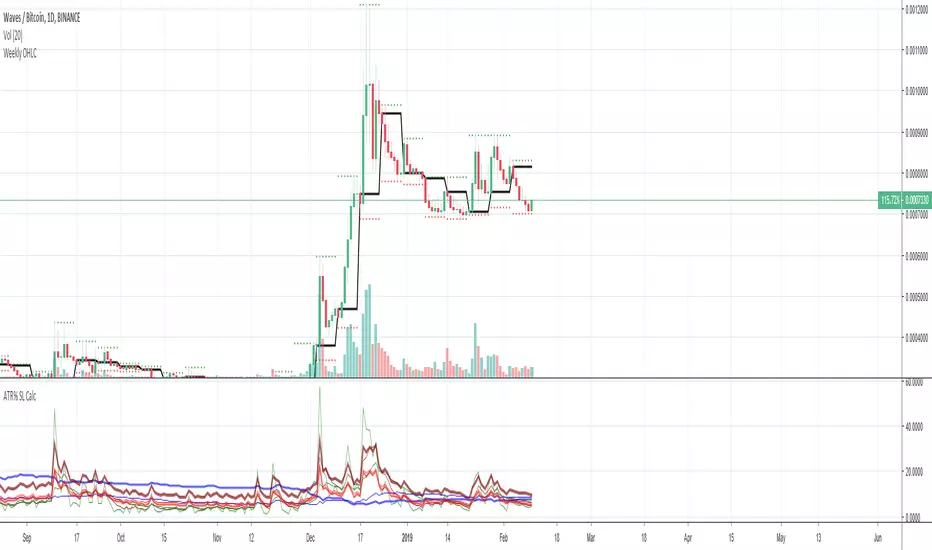
Average True Range (ATR %) Stop Loss CalculatorThis indicator takes the average of a series of ATR to calculate what I would consider an optimum stop loss placement represented in percentage (read below for full overview).
While the data is plotted what is most helpful are the actual numbers presented and for my charts I remove most of the plotting.
This indicator is most helpful on the daily timeframe but can be used for all timeframes such as the 4HR, 1HR or even 15M.
This indicator should not be used alone. It should be used in conjunction with proper price action analysis. It’s also a great indicator if you chart using Value Channels. Ideally you want your stop placement to be below at least one core Value Channel boundary range. In addition to standard support and resistance and some key moving averages the market respects. This also works best when trading with the prevailing BIAS of the instrument (bull or bear).
Cryptos: Generally, that means you’re buying on retracements that fit the end of a structured move. The other option is using this in a clear up trending market where the pull backs are clearly being supported with buying.
FOREX: I built another indicator for FOREX search: ATRPIPS with SL
WTI: Helpful but I have different rules for when I trade WTI. I rely upon VCs and diagnal VCs much more when trading this.
Equities: Helpful but with the increase of volatility as well as uncertainty of Bias of the market-- this should be used as more of a guide than
What is most important is the actual percentage numbers but I've found graphing 1-3 of the actual ATRs is helpful. The rest just uncheck the checkbox in the options.
Indicator Overview:
Value 1 - 3 Period ATR (maroon)
Value 2 - 7 Period ATR (green)
Value 3 - 30 Period ATR (blue)
Value 4 - 90 Period ATR (blue, bold)
Value 5 - 1 Period ATR (green)
Value 6 - 1 Period ATR (red)
Value 6 – Prime Stop Loss Placement (maroon). This is the average of all above ATRs multiplied by 1.5
Value 7 - Move Left (red). Experimental value. This is the difference between (prime stop loss) and 1 day period move. Two ways to use this value. Use as a tighter stop loss placement. The other option is to use as a retrace target for purchase and using the Prime Stop Placement value as you’re stop loss.
All ATRs use the LOW price of the period. After testing both the low and close I’ve settled on the low to capture the most volatility you will typically experience.
Once again, this indicator should be used in conjunction with your proven trade system.
Also, by knowing what the values are within the indicator you could just eye ball what would be the best stop placement depending on the ATR or 1 or 2 ATRs you find most represent the volatility of what you are trading.
I will be expanding on this indicator by bringing in average measured moves as well as volume analysis and most likely with color changes and modifications.
Background:
While using and refining my trade system I've noticed that most moves happen in 3 periods. So we start there. The 7 period is good for a 24 hour market such as crypto (although weekend trading can be a hit or miss) and to some extent FOREX. The longer periods of 30 & 90 are to smooth out the data set. The final value of the 1 period is to bring a little more recency to the calculation.
Why multiply the average by 1.5? I've found in my own trading and system I built to be the best placement (in conjunction with VCs) to ensure you're stop isn't to close and is within the instrument you are trading volatility .
I'm looking at making this more intelligent as well as take into account volume and structured moves.

ATR Pips with Stop LossThis indicator shares ATR pips and a calculated 1.5 x stop loss calculation.
1st number is ATR.
2nd number is ATR x 1.5 (a typical SL when trading daily time frame).
The plot lines are really not that important- it's the actual numbers.
What I do is uncheck the plot line checkboxes (ATR & SL) so it doesn't show up, that way I can reduce the indicator window.
This script is a modified script by ATR Pips . Kept the BB section for now as it might be useful, but doubt it.
Future updates:
- editable the multiple for SL
- static daily numbers (right now this shows the timeframe you are viewing, I'd keep that but add a static daily ATR so you have both)

Average True Range Stop Loss CalculatorThis indicator takes the average of a series of ATR to calculate what I would consider an optimum stop loss placement represented in percentage (read below for full overview).
While the data is plotted what is most helpful are the actual numbers presented.
This indicator is most helpful on the daily timeframe but can be used for all timeframes such as the 4HR or 1HR.
This indicator should not be used alone. It should be used in conjunction with proper price action analysis. It’s also a great indicator if you chart using Value Channels. Ideally you want your stop placement to be below at least one core Value Channel boundary range. In addition to standard support and resistance and some key moving averages the market respects. This also works best when trading with the prevailing BIAS of the instrument (bull or bear).
Cryptos: Generally, that means you’re buying on retracements that fit the end of a structured move. The other option is using this in a clear up trending market where the pull backs are clearly being supported with buying.
FOREX: I use this in my FOREX swing trades for my stop placements. Keep in mind I primarily trade my trade system and use this indicator to ensure my stop placements I define based on VCs are within the ATR tolerance. I’ve found that ATR * 1.5 is the best for my trade system.
WTI: Helpful but I have different rules for when I trade WTI. I rely upon VCs and diagnal VCs much more when trading this.
Equities: Helpful but with the increase of volatility as well as uncertainty of Bias of the market-- this should be used as more of a guide than
Indicator Overview:
Value 1 (maroon): 3 Period ATR
Value 2 (green): 7 Period ATR
Value 3 (blue): 30 Period ATR
Value 4 (blue, bold): 90 Period ATR
Value 5 (green): 1 Period ATR
Value 6 – Prime Stop Loss Placement (red): Average of all above ATR multiplied by 1.5
Value 7 (red): Difference between Value 6 (prime stop loss) and current period move. This is an experimental value. Two ways to use this value. Use as a tighter stop loss placement. The other option is to use as a retrace target for purchase and using the Prime Stop Placement value as you’re stop loss.
All ATRs use the LOW price of the period. After testing both the low and close I’ve settled on the low to capture the most volatility you will typically experience.
Once again, this indicator should be used in conjunction with your proven trade system.
Also, by knowing what the values are within the indicator you could just eye ball what would be the best stop placement depending on the ATR or 1 or 2 ATRs you find most represent the volatility of what you are trading.
I will be expanding on this indicator by bringing in average measured moves as well as volume analysis and most likely with color changes and modifications.
Background:
While using and refining my trade system I've noticed that most moves happen in 3 periods. So we start there. The 7 period is good for a 24 hour market such as crypto (although weekend trading can be a hit or miss) and to some extent FOREX. The longer periods of 30 & 90 are to smooth out the data set. The final value of the 1 period is to bring a little more recency to the calculation.
Why multiply the average by 1.5? I've found in my own trading and system I built to be the best placement (in conjunction with VCs) to ensure you're stop isn't to close and is within the instrument you are trading volatility.
I'm looking at making this more intelligent as well as take into account volume and structured moves.
Position Size for ATR Trailing StopThis indicator will calculate your position size, short or long, based on the ATR Trailing Stop indicator of mine, and are needed to be used together. General risk management suggests risking just 1 percent of your equity and using low leverage.
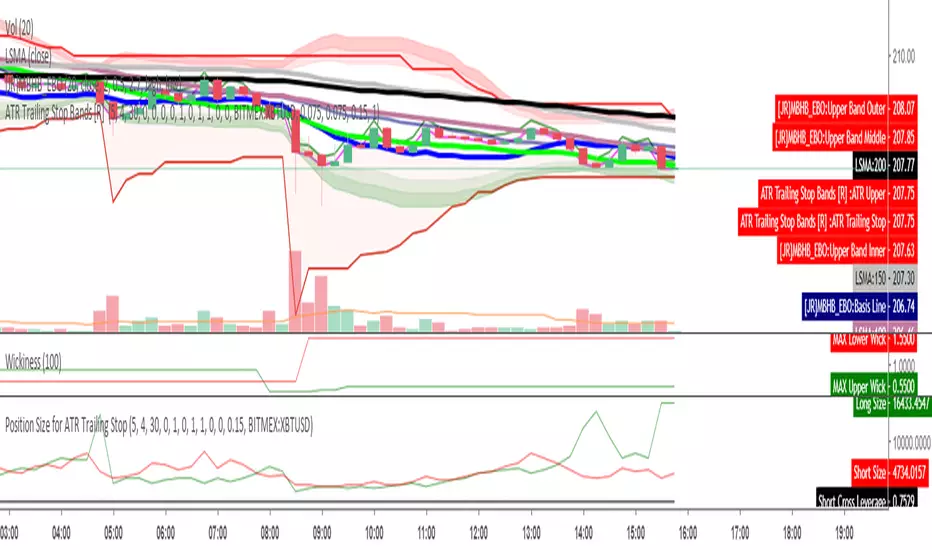
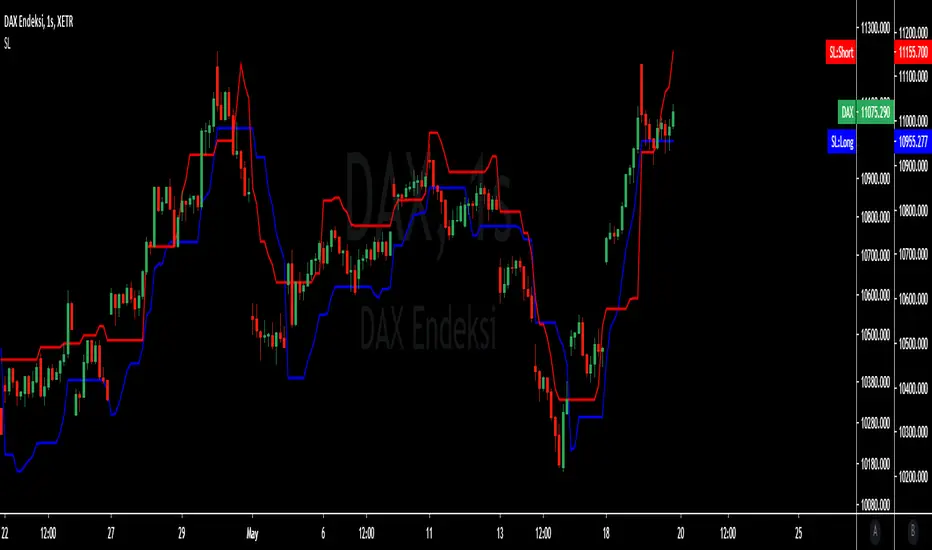
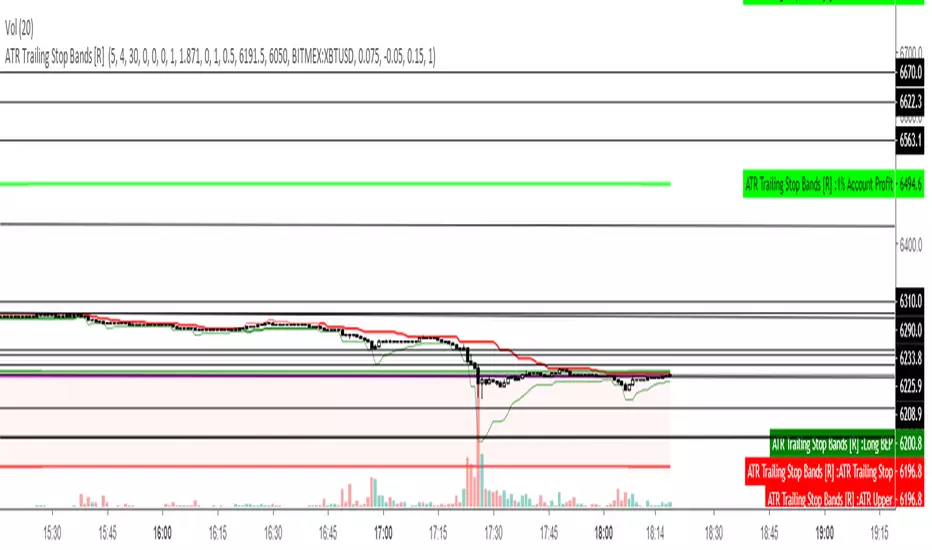
ATR Trailing Stop Bands [R] This is based on the Average True Range Trailing Stops Strategy by Sylvain Vervoort, coded on TV HPotter. I have added Bands to see potential short and long stop loss zones before the indicator signals to switch itself, also changed color on the main Trailing Stop based on whether it is short or long, added increased stop loss hunt protection by combining with my Wickiness indicator to add Wick Protection, based on either Average or Maximum Wicks, to prevent your stop getting wicked out. Experiment with different timeframes according to your trading style and how long you like to hold a trade. This indicator does not intend to tell you when to take profit, just how to place your stop to give you the best chance of not getting stopped out too early and to minimise risk by trailing it safely.
May you all never be stop hunted again.
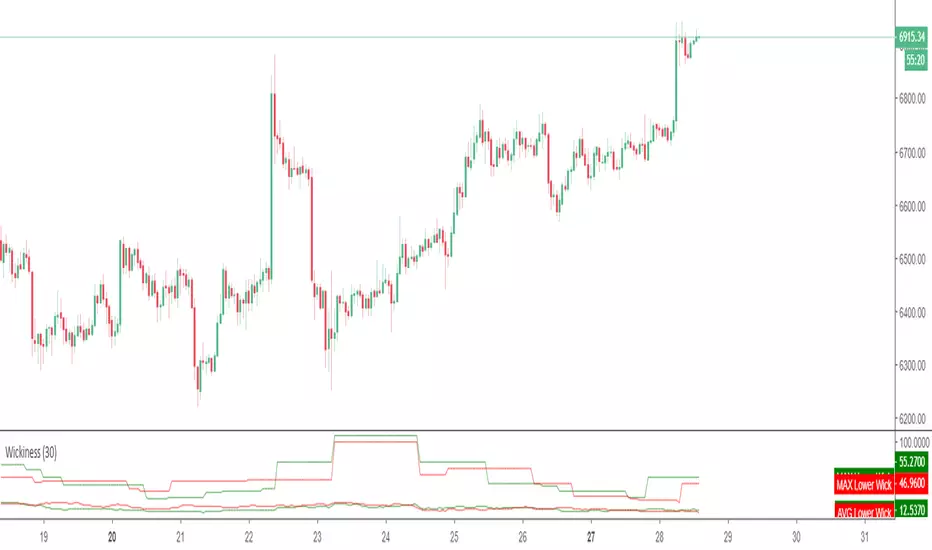
WickinessThis script measures the maximum and average length of upper and lower wicks. While this can be used as a volatility gauge and to see if there is more support or resistance, it's primary use is to not get wicked out on stops, by adding one of these numbers to the the Moving Average or S/R level that one is using for a Stop, plus maybe a few points of buffer.
Elder's SafeZoneSimilar indicators already published have modifications with respect to Elder's theory. This indicator fulfills literally what is described in the New Trading For A Living.

Double EMA with stop loss indicatorThis is an updated version of my previous stop loss script.
I've added a double EMA line and modified the stop as below;
In an uptrend....
1. a yellow dot will appear once it's time to move your stop. The yellow dot will display at the level of the stop loss. Place your stop 1 pip below the dot.
2. The yellow dot will only appear if a new higher low has formed and has been confirmed. Also the current candle must have broken the high of a previous bullish candle or the dot will not appear.
3. The dot will also appear if there is a likely reversal of the current trend.
Also works in downtrends.....

MG - Pivot trailing stopTrailing stop with alerts which automatically updates when a new pivot forms to maximize the ability to ride trends and get out in a timely fashion.
Contains long and short stop trigger alerts.

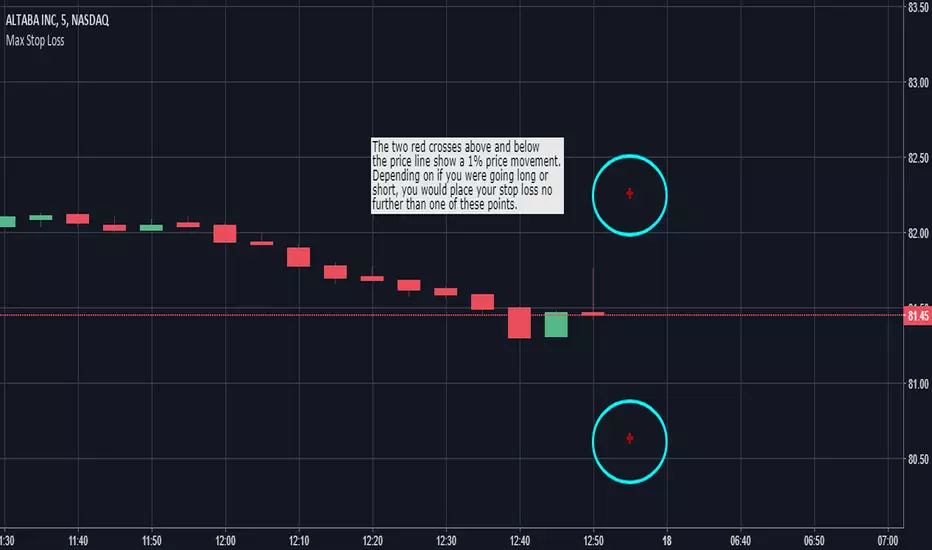
Max Stop Loss - Risk Management VisualizerThis indicator helps traders implement proper risk management in their trading. For example, let's say that you were trading a $1,000 account and didn't want to risk more than 1% of your account on any one trade. If you were placing $100 positions, you wouldn't want the price to move more than 10% against you (10% of $100 is $10, which is 1% of $1,000). So, assuming you were trading without any leverage, you would put "1000" into the "Max Stop Loss %" field in the format box and the indicator would display red crosses 10% above and below the current price of the market you are looking at. If you were going to take that same trade with 10x leverage, you would want to enter "100" into the indicator's format box and the red crosses would then plot themselves 1% above and below the current price.
"Max Stop Loss - Risk Management Visualizer" is able to show all the way down to a 0.01% price variation with no upper limit.
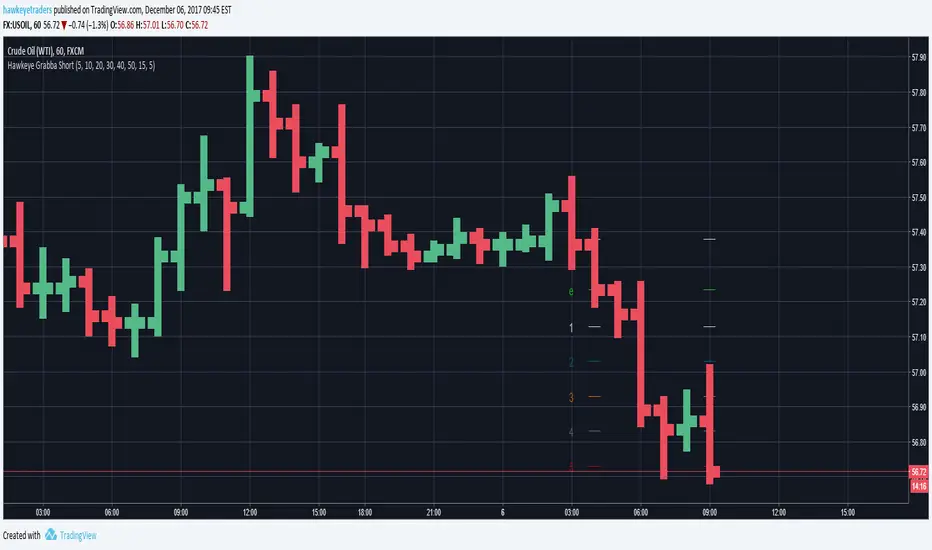
Hawkeye Grabba ShortGrab pips with Hawkeye Grabba
Grabba is a simple mechanical system that you can manage yourself, using your own risk and reward profile.
The Hawkeye Grabba is a risk management tool which provides traders with a visual representation of the risk-to-reward profile on every trade.
For example, you can apply your own profit targets (say 10 pips) and each line will show you that multiple.
As with all the Hawkeye Indicators, Grabba can be applied to any timeframe and any chart and can be custom set to be used on any market, i.e. Forex, stock indices, commodities, etc.
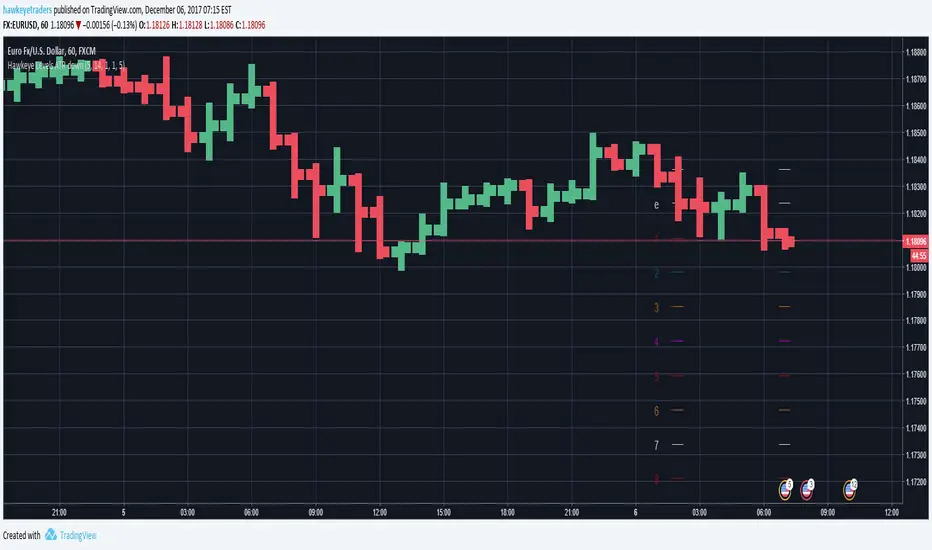
Hawkeye Grabba LongGrab pips with Hawkeye Grabba
Grabba is a simple mechanical system that you can manage yourself, using your own risk and reward profile.
The Hawkeye Grabba is a risk management tool which provides traders with a visual representation of the risk-to-reward profile on every trade.
For example, you can apply your own profit targets (say 10 pips) and each line will show you that multiple.
As with all the Hawkeye Indicators, Grabba can be applied to any timeframe and any chart and can be custom set to be used on any market, i.e. Forex, stock indices, commodities, etc.

Hawkeye Grabba AutoGrab pips with Hawkeye Grabba
Grabba is a simple mechanical system that you can manage yourself, using your own risk and reward profile.
The Hawkeye Grabba is a risk management tool which provides traders with a visual representation of the risk-to-reward profile on every trade.
For example, you can apply your own profit targets (say 10 pips) and each line will show you that multiple.
As with all the Hawkeye Indicators, Grabba can be applied to any timeframe and any chart and can be custom set to be used on any market, i.e. Forex, stock indices, commodities, etc.

Hawkeye Levels ATR downExit at the right time with Levels ATR!
Levels ATR is a powerful series of user pre-defined levels, which act as both potential exit positions and stop loss management.
The Levels ATR indicator helps traders identify clear exit strategies.
Inexperienced traders can:
spend too long focusing on where to enter the position
spend no time on where to exit or take profits
allow the market to dictate the exit following a particular chart pattern or set up
be panicked into exiting
Few traders concentrate on their exit strategies, yet this is where the big profits are made!
Hawkeye Levels ATR upExit at the right time with Levels ATR!
Levels ATR is a powerful series of user pre-defined levels, which act as both potential exit positions and stop loss management.
The Levels ATR indicator helps traders identify clear exit strategies.
Inexperienced traders can:
spend too long focusing on where to enter the position
spend no time on where to exit or take profits
allow the market to dictate the exit following a particular chart pattern or set up
be panicked into exiting
Few traders concentrate on their exit strategies, yet this is where the big profits are made!

Hawkeye Levels ATRExit at the right time with Levels ATR!
Levels ATR is a powerful series of user pre-defined levels, which act as both potential exit positions and stop loss management.
The Levels ATR indicator helps traders identify clear exit strategies.
Inexperienced traders can:
spend too long focusing on where to enter the position
spend no time on where to exit or take profits
allow the market to dictate the exit following a particular chart pattern or set up
be panicked into exiting
Few traders concentrate on their exit strategies, yet this is where the big profits are made!

CM ATR Stops/Bands - Multi-TimeFrameCM_MTF ATR Bands/Stops
Many Options Available Via Input Tab:
-Chart Defaults to Upper and Lower ATR's Based on Current Chart TimeFrame
-Ability to Plot either Upper and/or Lower ATR's
-Ability to Change the Time Frame ATR's are Based On!
-Ability to change Look Back Period and ATR Multiplier Individually for Both Time Frames
-This Gives you the ability to plot same Time Frame with (for ex.) a 5 ATR with a 1.5 Mult and a 14 ATR with a 2.0 Mult etc.
-Or you can plot Daily ATR's on a 60 minute Chart etc.
-ATR Multipliers are Calculated with Code that allows "Non Whole Numbers" Allowing Ability to use 1.5 ATR's, 1.8 ATR's etc.
***Endless # of Combinations can be used!!!!
