Trendline Breaks with Multi Fibonacci Supertrend StrategyTMFS Strategy: Advanced Trendline Breakouts with Multi-Fibonacci Supertrend
Elevate your algorithmic trading with institutional-grade signal confluence
Strategy Genesis & Evolution
This advanced trading system represents the culmination of a personal research journey, evolving from my custom " Multi Fibonacci Supertrend with Signals " indicator into a comprehensive trading strategy. Built upon the exceptional trendline detection methodology pioneered by LuxAlgo in their " Trendlines with Breaks " indicator, I've engineered a systematic framework that integrates multiple technical factors into a cohesive trading system.
Core Fibonacci Principles
At the heart of this strategy lies the Fibonacci sequence application to volatility measurement:
// Fibonacci-based factors for multiple Supertrend calculations
factor1 = input.float(0.618, 'Factor 1 (Weak/Fibonacci)', minval = 0.01, step = 0.01)
factor2 = input.float(1.618, 'Factor 2 (Medium/Golden Ratio)', minval = 0.01, step = 0.01)
factor3 = input.float(2.618, 'Factor 3 (Strong/Extended Fib)', minval = 0.01, step = 0.01)
These precise Fibonacci ratios create a dynamic volatility envelope that adapts to changing market conditions while maintaining mathematical harmony with natural price movements.
Dynamic Trendline Detection
The strategy incorporates LuxAlgo's pioneering approach to trendline detection:
// Pivotal swing detection (inspired by LuxAlgo)
pivot_high = ta.pivothigh(swing_length, swing_length)
pivot_low = ta.pivotlow(swing_length, swing_length)
// Dynamic slope calculation using ATR
slope = atr_value / swing_length * atr_multiplier
// Update trendlines based on pivot detection
if bool(pivot_high)
upper_slope := slope
upper_trendline := pivot_high
else
upper_trendline := nz(upper_trendline) - nz(upper_slope)
This adaptive trendline approach automatically identifies key structural market boundaries, adjusting in real-time to evolving chart patterns.
Breakout State Management
The strategy implements sophisticated state tracking for breakout detection:
// Track breakouts with state variables
var int upper_breakout_state = 0
var int lower_breakout_state = 0
// Update breakout state when price crosses trendlines
upper_breakout_state := bool(pivot_high) ? 0 : close > upper_trendline ? 1 : upper_breakout_state
lower_breakout_state := bool(pivot_low) ? 0 : close < lower_trendline ? 1 : lower_breakout_state
// Detect new breakouts (state transitions)
bool new_upper_breakout = upper_breakout_state > upper_breakout_state
bool new_lower_breakout = lower_breakout_state > lower_breakout_state
This state-based approach enables precise identification of the exact moment when price breaks through a significant trendline.
Multi-Factor Signal Confluence
Entry signals require confirmation from multiple technical factors:
// Define entry conditions with multi-factor confluence
long_entry_condition = enable_long_positions and
upper_breakout_state > upper_breakout_state and // New trendline breakout
di_plus > di_minus and // Bullish DMI confirmation
close > smoothed_trend // Price above Supertrend envelope
// Execute trades only with full confirmation
if long_entry_condition
strategy.entry('L', strategy.long, comment = "LONG")
This strict requirement for confluence significantly reduces false signals and improves the quality of trade entries.
Advanced Risk Management
The strategy includes sophisticated risk controls with multiple methodologies:
// Calculate stop loss based on selected method
get_long_stop_loss_price(base_price) =>
switch stop_loss_method
'PERC' => base_price * (1 - long_stop_loss_percent)
'ATR' => base_price - long_stop_loss_atr_multiplier * entry_atr
'RR' => base_price - (get_long_take_profit_price() - base_price) / long_risk_reward_ratio
=> na
// Implement trailing functionality
strategy.exit(
id = 'Long Take Profit / Stop Loss',
from_entry = 'L',
qty_percent = take_profit_quantity_percent,
limit = trailing_take_profit_enabled ? na : long_take_profit_price,
stop = long_stop_loss_price,
trail_price = trailing_take_profit_enabled ? long_take_profit_price : na,
trail_offset = trailing_take_profit_enabled ? long_trailing_tp_step_ticks : na,
comment = "TP/SL Triggered"
)
This flexible approach adapts to varying market conditions while providing comprehensive downside protection.
Performance Characteristics
Rigorous backtesting demonstrates exceptional capital appreciation potential with impressive risk-adjusted metrics:
Remarkable total return profile (1,517%+)
Strong Sortino ratio (3.691) indicating superior downside risk control
Profit factor of 1.924 across all trades (2.153 for long positions)
Win rate exceeding 35% with balanced distribution across varied market conditions
Institutional Considerations
The strategy architecture addresses execution complexities faced by institutional participants with temporal filtering and date-range capabilities:
// Time Filter settings with flexible timezone support
import jason5480/time_filters/5 as time_filter
src_timezone = input.string(defval = 'Exchange', title = 'Source Timezone')
dst_timezone = input.string(defval = 'Exchange', title = 'Destination Timezone')
// Date range filtering for precise execution windows
use_from_date = input.bool(defval = true, title = 'Enable Start Date')
from_date = input.time(defval = timestamp('01 Jan 2022 00:00'), title = 'Start Date')
// Validate trading permission based on temporal constraints
date_filter_approved = time_filter.is_in_date_range(
use_from_date, from_date, use_to_date, to_date, src_timezone, dst_timezone
)
These capabilities enable precise execution timing and market session optimization critical for larger market participants.
Acknowledgments
Special thanks to LuxAlgo for the pioneering work on trendline detection and breakout identification that inspired elements of this strategy. Their innovative approach to technical analysis provided a valuable foundation upon which I could build my Fibonacci-based methodology.
This strategy is shared under the same Attribution-NonCommercial-ShareAlike 4.0 International (CC BY-NC-SA 4.0) license as LuxAlgo's original work.
Past performance is not indicative of future results. Conduct thorough analysis before implementing any algorithmic strategy.
Strategy!

Rally Base Drop SND Pivots Strategy [LuxAlgo X PineIndicators]This strategy is based on the Rally Base Drop (RBD) SND Pivots indicator developed by LuxAlgo. Full credit for the concept and original indicator goes to LuxAlgo.
The Rally Base Drop SND Pivots Strategy is a non-repainting supply and demand trading system that detects pivot points based on Rally, Base, and Drop (RBD) candles. This strategy automatically identifies key market structure levels, allowing traders to:
Identify pivot-based supply and demand (SND) zones.
Use fixed criteria for trend continuation or reversals.
Filter out market noise by requiring structured price formations.
Enter trades based on breakouts of key SND pivot levels.
How the Rally Base Drop SND Pivots Strategy Works
1. Pivot Point Detection Using RBD Candles
The strategy follows a rigid market structure methodology, where pivots are detected only when:
A Rally (R) consists of multiple consecutive bullish candles.
A Drop (D) consists of multiple consecutive bearish candles.
A Base (B) is identified as a transition between Rallies and Drops, acting as a pivot point.
The pivot level is confirmed when the formation is complete.
Unlike traditional fractal-based pivots, RBD Pivots enforce stricter structural rules, ensuring that each pivot:
Has a well-defined bullish or bearish price movement.
Reduces false signals caused by single-bar fluctuations.
Provides clear supply and demand levels based on structured price movements.
These pivot levels are drawn on the chart using color-coded boxes:
Green zones represent bullish pivot levels (Rally Base formations).
Red zones represent bearish pivot levels (Drop Base formations).
Once a pivot is confirmed, the high or low of the base candle is used as the reference level for future trades.
2. Trade Entry Conditions
The strategy allows traders to select from three trading modes:
Long Only – Only takes long trades when bullish pivot breakouts occur.
Short Only – Only takes short trades when bearish pivot breakouts occur.
Long & Short – Trades in both directions based on pivot breakouts.
Trade entry signals are triggered when price breaks through a confirmed pivot level:
Long Entry:
A bullish pivot level is formed.
Price breaks above the bullish pivot level.
The strategy enters a long position.
Short Entry:
A bearish pivot level is formed.
Price breaks below the bearish pivot level.
The strategy enters a short position.
The strategy includes an optional mode to reverse long and short conditions, allowing traders to experiment with contrarian entries.
3. Exit Conditions Using ATR-Based Risk Management
This strategy uses the Average True Range (ATR) to calculate dynamic stop-loss and take-profit levels:
Stop-Loss (SL): Placed 1 ATR below entry for long trades and 1 ATR above entry for short trades.
Take-Profit (TP): Set using a Risk-Reward Ratio (RR) multiplier (default = 6x ATR).
When a trade is opened:
The entry price is recorded.
ATR is calculated at the time of entry to determine stop-loss and take-profit levels.
Trades exit automatically when either SL or TP is reached.
If reverse conditions mode is enabled, stop-loss and take-profit placements are flipped.
Visualization & Dynamic Support/Resistance Levels
1. Pivot Boxes for Market Structure
Each pivot is marked with a colored box:
Green boxes indicate bullish demand zones.
Red boxes indicate bearish supply zones.
These boxes remain on the chart to act as dynamic support and resistance levels, helping traders identify key price reaction zones.
2. Horizontal Entry, Stop-Loss, and Take-Profit Lines
When a trade is active, the strategy plots:
White line → Entry price.
Red line → Stop-loss level.
Green line → Take-profit level.
Labels display the exact entry, SL, and TP values, updating dynamically as price moves.
Customization Options
This strategy offers multiple adjustable settings to optimize performance for different market conditions:
Trade Mode Selection → Choose between Long Only, Short Only, or Long & Short.
Pivot Length → Defines the number of required Rally & Drop candles for a pivot.
ATR Exit Multiplier → Adjusts stop-loss distance based on ATR.
Risk-Reward Ratio (RR) → Modifies take-profit level relative to risk.
Historical Lookback → Limits how far back pivot zones are displayed.
Color Settings → Customize pivot box colors for bullish and bearish setups.
Considerations & Limitations
Pivot Breakouts Do Not Guarantee Reversals. Some pivot breaks may lead to continuation moves instead of trend reversals.
Not Optimized for Low Volatility Conditions. This strategy works best in trending markets with strong momentum.
ATR-Based Stop-Loss & Take-Profit May Require Optimization. Different assets may require different ATR multipliers and RR settings.
Market Noise May Still Influence Pivots. While this method filters some noise, fake breakouts can still occur.
Conclusion
The Rally Base Drop SND Pivots Strategy is a non-repainting supply and demand system that combines:
Pivot-based market structure analysis (using Rally, Base, and Drop candles).
Breakout-based trade entries at confirmed SND levels.
ATR-based dynamic risk management for stop-loss and take-profit calculation.
This strategy helps traders:
Identify high-probability supply and demand levels.
Trade based on structured market pivots.
Use a systematic approach to price action analysis.
Automatically manage risk with ATR-based exits.
The strict pivot detection rules and built-in breakout validation make this strategy ideal for traders looking to:
Trade based on market structure.
Use defined support & resistance levels.
Reduce noise compared to traditional fractals.
Implement a structured supply & demand trading model.
This strategy is fully customizable, allowing traders to adjust parameters to fit their market and trading style.
Full credit for the original concept and indicator goes to LuxAlgo.

Liquidity Sweep Filter Strategy [AlgoAlpha X PineIndicators]This strategy is based on the Liquidity Sweep Filter developed by AlgoAlpha. Full credit for the concept and original indicator goes to AlgoAlpha.
The Liquidity Sweep Filter Strategy is a non-repainting trading system designed to identify liquidity sweeps, trend shifts, and high-impact price levels. It incorporates volume-based liquidation analysis, trend confirmation, and dynamic support/resistance detection to optimize trade entries and exits.
This strategy helps traders:
Detect liquidity sweeps where major market participants trigger stop losses and liquidations.
Identify trend shifts using a volatility-based moving average system.
Analyze volume distribution with a built-in volume profile visualization.
Filter noise by differentiating between major and minor liquidity sweeps.
How the Liquidity Sweep Filter Strategy Works
1. Trend Detection Using Volatility-Based Filtering
The strategy applies a volatility-adjusted moving average system to determine trend direction:
A central trend line is calculated using an EMA smoothed over a user-defined length.
Upper and lower deviation bands are created based on the average price deviation over multiple periods.
If price closes above the upper band, the strategy signals an uptrend.
If price closes below the lower band, the strategy signals a downtrend.
This approach ensures that trend shifts are confirmed only when price significantly moves beyond normal market fluctuations.
2. Liquidity Sweep Detection
Liquidity sweeps occur when price temporarily breaks key levels, triggering stop-loss liquidations or margin call events. The strategy tracks swing highs and lows, marking potential liquidity grabs:
Bearish Liquidity Sweeps – Price breaks a recent high, then reverses downward.
Bullish Liquidity Sweeps – Price breaks a recent low, then reverses upward.
Volume Integration – The strategy analyzes trading volume at each sweep to differentiate between major and minor sweeps.
Key levels where liquidity sweeps occur are plotted as color-coded horizontal lines:
Red lines indicate bearish liquidity sweeps.
Green lines indicate bullish liquidity sweeps.
Labels are displayed at each sweep, showing the volume of liquidated positions at that level.
3. Volume Profile Analysis
The strategy includes an optional volume profile visualization, displaying how trading volume is distributed across different price levels.
Features of the volume profile:
Point of Control (POC) – The price level with the highest traded volume is marked as a key area of interest.
Bounding Box – The profile is enclosed within a transparent box, helping traders visualize the price range of high trading activity.
Customizable Resolution & Scale – Traders can adjust the granularity of the profile to match their preferred time frame.
The volume profile helps identify zones of strong support and resistance, making it easier to anticipate price reactions at key levels.
Trade Entry & Exit Conditions
The strategy allows traders to configure trade direction:
Long Only – Only takes long trades.
Short Only – Only takes short trades.
Long & Short – Trades in both directions.
Entry Conditions
Long Entry:
A bullish trend shift is confirmed.
A bullish liquidity sweep occurs (price sweeps below a key level and reverses).
The trade direction setting allows long trades.
Short Entry:
A bearish trend shift is confirmed.
A bearish liquidity sweep occurs (price sweeps above a key level and reverses).
The trade direction setting allows short trades.
Exit Conditions
Closing a Long Position:
A bearish trend shift occurs.
The position is liquidated at a predefined liquidity sweep level.
Closing a Short Position:
A bullish trend shift occurs.
The position is liquidated at a predefined liquidity sweep level.
Customization Options
The strategy offers multiple adjustable settings:
Trade Mode: Choose between Long Only, Short Only, or Long & Short.
Trend Calculation Length & Multiplier: Adjust how trend signals are calculated.
Liquidity Sweep Sensitivity: Customize how aggressively the strategy identifies sweeps.
Volume Profile Display: Enable or disable the volume profile visualization.
Bounding Box & Scaling: Control the size and position of the volume profile.
Color Customization: Adjust colors for bullish and bearish signals.
Considerations & Limitations
Liquidity sweeps do not always result in reversals. Some price sweeps may continue in the same direction.
Works best in volatile markets. In low-volatility environments, liquidity sweeps may be less reliable.
Trend confirmation adds a slight delay. The strategy ensures valid signals, but this may result in slightly later entries.
Large volume imbalances may distort the volume profile. Adjusting the scale settings can help improve visualization.
Conclusion
The Liquidity Sweep Filter Strategy is a volume-integrated trading system that combines liquidity sweeps, trend analysis, and volume profile data to optimize trade execution.
By identifying key price levels where liquidations occur, this strategy provides valuable insight into market behavior, helping traders make better-informed trading decisions.
Key use cases for this strategy:
Liquidity-Based Trading – Capturing moves triggered by stop hunts and liquidations.
Volume Analysis – Using volume profile data to confirm high-activity price zones.
Trend Following – Entering trades based on confirmed trend shifts.
Support & Resistance Trading – Using liquidity sweep levels as dynamic price zones.
This strategy is fully customizable, allowing traders to adapt it to different market conditions, timeframes, and risk preferences.
Full credit for the original concept and indicator goes to AlgoAlpha.

Market Trend Levels Non-Repainting [BigBeluga X PineIndicators]This strategy is based on the Market Trend Levels Detector developed by BigBeluga. Full credit for the concept and original indicator goes to BigBeluga.
The Market Trend Levels Detector Strategy is a non-repainting trend-following strategy that identifies market trend shifts using two Exponential Moving Averages (EMA). It also detects key price levels and allows traders to apply multiple filters to refine trade entries and exits.
This strategy is designed for trend trading and enables traders to:
Identify trend direction based on EMA crossovers.
Detect significant market levels using labeled trend lines.
Use multiple filter conditions to improve trade accuracy.
Avoid false signals through non-repainting calculations.
How the Market Trend Levels Detector Strategy Works
1. Core Trend Detection Using EMA Crossovers
The strategy detects trend shifts using two EMAs:
Fast EMA (default: 12 periods) – Reacts quickly to price movements.
Slow EMA (default: 25 periods) – Provides a smoother trend confirmation.
A bullish crossover (Fast EMA crosses above Slow EMA) signals an uptrend , while a bearish crossover (Fast EMA crosses below Slow EMA) signals a downtrend .
2. Market Level Detection & Visualization
Each time an EMA crossover occurs, a trend level line is drawn:
Bullish crossover → A green line is drawn at the low of the crossover candle.
Bearish crossover → A purple line is drawn at the high of the crossover candle.
Lines can be extended to act as support and resistance zones for future price action.
Additionally, a small label (●) appears at each crossover to mark the event on the chart.
3. Trade Entry & Exit Conditions
The strategy allows users to choose between three trading modes:
Long Only – Only enters long trades.
Short Only – Only enters short trades.
Long & Short – Trades in both directions.
Entry Conditions
Long Entry:
A bullish EMA crossover occurs.
The trade direction setting allows long trades.
Filter conditions (if enabled) confirm a valid long signal.
Short Entry:
A bearish EMA crossover occurs.
The trade direction setting allows short trades.
Filter conditions (if enabled) confirm a valid short signal.
Exit Conditions
Long Exit:
A bearish EMA crossover occurs.
Exit filters (if enabled) indicate an invalid long position.
Short Exit:
A bullish EMA crossover occurs.
Exit filters (if enabled) indicate an invalid short position.
Additional Trade Filters
To improve trade accuracy, the strategy allows traders to apply up to 7 additional filters:
RSI Filter: Only trades when RSI confirms a valid trend.
MACD Filter: Ensures MACD histogram supports the trade direction.
Stochastic Filter: Requires %K line to be above/below threshold values.
Bollinger Bands Filter: Confirms price position relative to the middle BB line.
ADX Filter: Ensures the trend strength is above a set threshold.
CCI Filter: Requires CCI to indicate momentum in the right direction.
Williams %R Filter: Ensures price momentum supports the trade.
Filters can be enabled or disabled individually based on trader preference.
Dynamic Level Extension Feature
The strategy provides an optional feature to extend trend lines until price interacts with them again:
Bullish support lines extend until price revisits them.
Bearish resistance lines extend until price revisits them.
If price breaks a line, the line turns into a dotted style , indicating it has been breached.
This helps traders identify key levels where trend shifts previously occurred, providing useful support and resistance insights.
Customization Options
The strategy includes several adjustable settings :
Trade Direction: Choose between Long Only, Short Only, or Long & Short.
Trend Lengths: Adjust the Fast & Slow EMA lengths.
Market Level Extension: Decide whether to extend support/resistance lines.
Filters for Trade Confirmation: Enable/disable individual filters.
Color Settings: Customize line colors for bullish and bearish trend shifts.
Maximum Displayed Lines: Limit the number of drawn support/resistance lines.
Considerations & Limitations
Trend Lag: As with any EMA-based strategy, signals may be slightly delayed compared to price action.
Sideways Markets: This strategy works best in trending conditions; frequent crossovers in sideways markets can produce false signals.
Filter Usage: Enabling multiple filters may reduce trade frequency, but can also improve trade quality.
Line Overlap: If many crossovers occur in a short period, the chart may become cluttered with multiple trend levels. Adjusting the "Display Last" setting can help.
Conclusion
The Market Trend Levels Detector Strategy is a non-repainting trend-following system that combines EMA crossovers, market level detection, and customizable filters to improve trade accuracy.
By identifying trend shifts and key price levels, this strategy can be used for:
Trend Confirmation – Using EMA crossovers and filters to confirm trend direction.
Support & Resistance Trading – Identifying dynamic levels where price reacts.
Momentum-Based Trading – Combining EMA crossovers with additional momentum filters.
This strategy is fully customizable and can be adapted to different trading styles, timeframes, and market conditions.
Full credit for the original concept and indicator goes to BigBeluga.

Gradient Trend Filter STRATEGY [ChartPrime/PineIndicators]This strategy is based on the Gradient Trend Filter indicator developed by ChartPrime. Full credit for the concept and indicator goes to ChartPrime.
The Gradient Trend Filter Strategy is designed to execute trades based on the trend analysis and filtering system provided by the Gradient Trend Filter indicator. It integrates a noise-filtered trend detection system with a color-gradient visualization, helping traders identify trend strength, momentum shifts, and potential reversals.
How the Gradient Trend Filter Strategy Works
1. Noise Filtering for Smoother Trends
To reduce false signals caused by market noise, the strategy applies a three-stage smoothing function to the source price. This function ensures that trend shifts are detected more accurately, minimizing unnecessary trade entries and exits.
The filter is based on an Exponential Moving Average (EMA)-style smoothing technique.
It processes price data in three successive passes, refining the trend signal before generating trade entries.
This filtering technique helps eliminate minor fluctuations and highlights the true underlying trend.
2. Multi-Layered Trend Bands & Color-Based Trend Visualization
The Gradient Trend Filter constructs multiple trend bands around the filtered trend line, acting as dynamic support and resistance zones.
The mid-line changes color based on the trend direction:
Green for uptrends
Red for downtrends
A gradient cloud is formed around the trend line, dynamically shifting colors to provide early warning signals of trend reversals.
The outer bands function as potential support and resistance, helping traders determine stop-loss and take-profit zones.
Visualization elements used in this strategy:
Trend Filter Line → Changes color between green (bullish) and red (bearish).
Trend Cloud → Dynamically adjusts color based on trend strength.
Orange Markers → Appear when a trend shift is confirmed.
Trade Entry & Exit Conditions
This strategy automatically enters trades based on confirmed trend shifts detected by the Gradient Trend Filter.
1. Trade Entry Rules
Long Entry:
A bullish trend shift is detected (trend direction changes to green).
The filtered trend value crosses above zero, confirming upward momentum.
The strategy enters a long position.
Short Entry:
A bearish trend shift is detected (trend direction changes to red).
The filtered trend value crosses below zero, confirming downward momentum.
The strategy enters a short position.
2. Trade Exit Rules
Closing a Long Position:
If a bearish trend shift occurs, the strategy closes the long position.
Closing a Short Position:
If a bullish trend shift occurs, the strategy closes the short position.
The trend shift markers (orange diamonds) act as a confirmation signal, reinforcing the validity of trade entries and exits.
Customization Options
This strategy allows traders to adjust key parameters for flexibility in different market conditions:
Trade Direction: Choose between Long Only, Short Only, or Long & Short .
Trend Length: Modify the length of the smoothing function to adapt to different timeframes.
Line Width & Colors: Customize the visual appearance of trend lines and cloud colors.
Performance Table: Enable or disable the equity performance table that tracks historical trade results.
Performance Tracking & Reporting
A built-in performance table is included to monitor monthly and yearly trading performance.
The table calculates monthly percentage returns, displaying them in a structured format.
Color-coded values highlight profitable months (blue) and losing months (red).
Tracks yearly cumulative performance to assess long-term strategy effectiveness.
Traders can use this feature to evaluate historical performance trends and optimize their strategy settings accordingly.
How to Use This Strategy
Identify Trend Strength & Reversals:
Use the trend line and cloud color changes to assess trend strength and detect potential reversals.
Monitor Momentum Shifts:
Pay attention to gradient cloud color shifts, as they often appear before the trend line changes color.
This can indicate early momentum weakening or strengthening.
Act on Trend Shift Markers:
Use orange diamonds as confirmation signals for trend shifts and trade entry/exit points.
Utilize Cloud Bands as Support/Resistance:
The outer bands of the cloud serve as dynamic support and resistance, helping with stop-loss and take-profit placement.
Considerations & Limitations
Trend Lag: Since the strategy applies a smoothing function, entries may be slightly delayed compared to raw price action.
Volatile Market Conditions: In high-volatility markets, trend shifts may occur more frequently, leading to higher trade frequency.
Optimized for Trend Trading: This strategy is best suited for trending markets and may produce false signals in sideways (ranging) conditions.
Conclusion
The Gradient Trend Filter Strategy is a trend-following system based on the Gradient Trend Filter indicator by ChartPrime. It integrates noise filtering, trend visualization, and gradient-based color shifts to help traders identify strong market trends and potential reversals.
By combining trend filtering with a multi-layered cloud system, the strategy provides clear trade signals while minimizing noise. Traders can use this strategy for long-term trend trading, momentum shifts, and support/resistance-based decision-making.
This strategy is a fully automated system that allows traders to execute long, short, or both directions, with customizable settings to adapt to different market conditions.
Credit for the original concept and indicator goes to ChartPrime.

Simple APF Strategy Backtesting [The Quant Science]Simple backtesting strategy for the quantitative indicator Autocorrelation Price Forecasting. This is a Buy & Sell strategy that operates exclusively with long orders. It opens long positions and generates profit based on the future price forecast provided by the indicator. It's particularly suitable for trend-following trading strategies or directional markets with an established trend.
Main functions
1. Cycle Detection: Utilize autocorrelation to identify repetitive market behaviors and cycles.
2. Forecasting for Backtesting: Simulate trades and assess the profitability of various strategies based on future price predictions.
Logic
The strategy works as follow:
Entry Condition: Go long if the hypothetical gain exceeds the threshold gain (configurable by user interface).
Position Management: Sets a take-profit level based on the future price.
Position Sizing: Automatically calculates the order size as a percentage of the equity.
No Stop-Loss: this strategy doesn't includes any stop loss.
Example Use Case
A trader analyzes a dayli period using 7 historical bars for autocorrelation.
Sets a threshold gain of 20 points using a 5% of the equity for each trade.
Evaluates the effectiveness of a long-only strategy in this period to assess its profitability and risk-adjusted performance.
User Interface
Length: Set the length of the data used in the autocorrelation price forecasting model.
Thresold Gain: Minimum value to be considered for opening trades based on future price forecast.
Order Size: percentage size of the equity used for each single trade.
Strategy Limit
This strategy does not use a stop loss. If the price continues to drop and the future price forecast is incorrect, the trader may incur a loss or have their capital locked in the losing trade.
Disclaimer!
This is a simple template. Use the code as a starting point rather than a finished solution. The script does not include important parameters, so use it solely for educational purposes or as a boilerplate.

3Commas Multicoin Scalper LITE [SwissAlgo]
Introduction
Are you tired of tracking cryptocurrency charts and placing orders manually on your Exchange?
The 3Commas Multicoin Scalper LITE is an automated trading system designed to identify and execute potential trading setups on multiple cryptocurrencies ( simultaneously ) on your preferred Exchange (Binance, Bybit, OKX, Gate.io, Bitget) via 3Commas integration.
It analyzes price action, volume, momentum, volatility, and trend patterns across two categories of USDT Perpetual coins: the 'Top Major Coins' category (11 established cryptocurrencies) and your Custom Category (up to 10 coins of your choice).
The indicator sends real-time trading signals directly to your 3Commas bots for automated execution, identifying both trend-following and contrarian trading opportunities in all market conditions.
Trade automatically all coins of one or more selected categories:
----------------------------------------------
What it Does
The 3Commas Multicoin Scalper LITE is a technical analysis tool that monitors multiple cryptocurrency pairs simultaneously and connects with 3Commas for signal delivery and execution.
Here's how the strategy works:
🔶 Technical Analysis : Analyzes price action, volume, momentum, volatility, and trend patterns across USDT Perpetual Futures contracts simultaneously.
🔶 Pattern Detection : Identifies specific candle patterns and technical confluences that suggest potential trading setups across USDT.P contracts of the selected category.
🔶 Signal Generation : When technical criteria are met at bar close, the indicator creates deal-start signals for the relevant pairs.
🔶 3Commas Integration : Packages these signals and delivers them to 3Commas through TradingView alerts, allowing 3Commas bots to receive specific pair information ('Deal-Start' signals).
🔶 Category Management : Each TradingView alert monitors an entire category, allowing selective activation of different crypto categories.
🔶 Visual Feedback : Provides color-coded candles and backgrounds to visualize technical conditions, with optional pivot points and trend visualization.
Candle types
Signals
----------------------------------------------
Quick Start Guide
1. Setup 3Commas Bots : Configure two DCA bots in 3Commas (All USDT pairs) - one for LONG positions and one for SHORT positions.
2. Define Trading Parameters : Set your budget for each trade and adjust your preferred sensitivity within the indicator settings.
3. Create Category Alerts : Set up one TradingView alert for each crypto category you want to trade.
That's it! Once configured, the system automatically sends signals to your 3Commas bots when predefined trading setups are detected across coins in your selected/activated categories. The indicator scans all coins at bar close (for example, every hour on the 1H timeframe) and triggers trade execution only for those showing technical confluences.
Important : Consider your total capital when enabling categories. More details about the setup process are provided below (see paragraph "Detailed Setup & Configuration").
----------------------------------------------
Built-in Backtesting
The 3Commas Multicoin Scalper LITE includes backtesting visualization for each coin. When viewing any USDT Perpetual pair on your chart, you can visualize how the strategy would have performed historically on that specific asset.
Color-coded candles and signal markers show past trading setups, helping you evaluate which coins responded best to the strategy. This built-in backtesting capability can support your selection of assets/categories to trade before deploying real capital.
As backtesting results are hypothetical and do not guarantee future performance, your research and analysis are essential for selecting the crypto categories/coins to trade.
The default strategy settings are: Start Capital 1,000$, leverage 10X, Commissions 0.1% (average Taker Fee on Exchanges for average users), Order Amount 200$ for Longs/Shorts, Slippage 4
Example of backtesting view
----------------------------------------------
Key Features
🔶 Multi-Exchange Support : Compatible with BINANCE, BYBIT, BITGET, GATEIO, and OKX USDT Perpetual markets (USDT.P)
🔶 Category Options : Analyze cryptocurrencies in the Top Major Coins category or create your custom watchlist
🔶 Custom Category Option : Create your watchlist with up to 10 custom USDT Perpetual pairs
🔶 3Commas Integration : Seamlessly connects with 3Commas bots to automate trade entries and exits
🔶 Dual Strategy Approach : Identifies both "trend following" and "contrarian" potential setups
🔶 Confluence-Based Signals : Uses a combination of multiple technical factors - price spikes, price momentum, volume spikes, volume momentum, trend analysis, and volatility spikes - to generate potential trading setups
🔶 Risk Management : Adjustable sensitivity/risk levels, leverage settings, and budget allocation for each trade
🔶 Visual Indicators : Color-coded candles and trading signals provide visual feedback on market conditions
🔶 Trend Indication : Background colors showing ongoing uptrends/downtrends
🔶 Pivot Points & Daily Open : Optional display of pivot points and daily open price for additional context
🔶 Liquidity Analysis : Optional display of high/low liquidity timeframes throughout the trading week
🔶 Trade Control : Configurable limit for the maximum number of signals sent to 3Commas for execution (per bar close and category)
5 Available Exchanges
Pick coins/tokens and defined your Custom Category
----------------------------------------------
Methodology
The 3Commas Multicoin Scalper LITE utilizes a multi-faceted approach to identify potential trading setups:
1. Price Action Analysis : Detects abnormal price movements by comparing the current candle's range to historical averages and standard deviations, helping identify potential "pump and dump" scenarios or new-trends start
2. Price Momentum : Evaluates the relative strength of bullish vs. bearish price movements over time, indicating the build-up of buying or selling pressure.
3. Volume Analysis: Identifies unusual volume spikes by comparing current volume to historical averages, signaling strong market interest in a particular direction.
4. Volume Momentum : Measures the ratio of bullish to bearish volume, revealing the dominance of buyers or sellers over time.
5. Trend Analysis : Combines EMA slopes, RSI, and Stochastic RSI to determine overall trend direction and strength.
6. Volatility : Monitors the ATR (Average True Range) to detect periods of increased market volatility, which may indicate potential breakouts or reversals
7. Candle Wick Analysis : Evaluates upper and lower wick percentages to detect potential rejection patterns and reversals.
8. Pivot Point Analysis : Uses pivot points (PP, R1-R3, S1-S3) for identifying key support/resistance areas and potential breakout/breakdown levels.
9. Daily Open Reference: Analyzes price action relative to the daily open for potential setups related to price movement vs. the opening price
10. Market Timing/Liquidity : Evaluates high/low liquidity periods, specific days/times of heightened risk, and potential market manipulation timeframes.
11. Boost Factors : Applies additional weight to certain confluence patterns to adjust global scores
These factors are combined into a "Global Score" ranging from -1 to +1 , applied at bar close to the newly formed candles.
Scores above predefined thresholds (configurable via the Sensitivity Settings) indicate strong bullish or bearish conditions and trigger signals based on predefined patterns. The indicator then applies additional filters to generate specific "Trend Following" and "Contrarian" trading signals. The identified signals are packaged and sent to 3Commas for execution.
Pivot Points
Trend Background
----------------------------------------------
Who This Strategy Is For
The 3Commas Multicoin Scalper LITE may benefit:
Crypto Traders seeking to automate their trading across multiple coins simultaneously
3Commas Users looking to enhance their bot performance with technical signals
Busy Traders who want to monitor market opportunities without constant chart-watching
Multi-strategy traders interested in both trend-following and reversal trading approaches
Traders of Various Experience Levels from intermediate traders wanting to save time to advanced traders seeking to optimize their operations
Perpetual Futures Traders on major exchanges (Binance, Bybit, OKX, Gate.io, Bitget)
Swing and Scalp Traders seeking to identify short to medium-term profit opportunities
----------------------------------------------
Visual Indicators
The indicator provides visual feedback through:
1. Candlestick Colors :
* Lime: Strong bullish candle (High positive score)
* Blue: Moderate bullish candle (Medium positive score)
* Red: Strong bearish candle (High negative score)
* Purple: Moderate bearish candle (Medium negative score)
* Pale Green/Red: Mild bullish/bearish candle
2. Signal Markers :
* ↗: Trend following Long signal
* ↘: Trend following Short signal
* ⤴: Contrarian Long signal
* ⤵: Contrarian Short signal
3. Optional Elements :
* Pivot Points: Daily support/resistance levels (R1-R3, S1-S3, PP)
* Daily Open: Reference price level for the current trading day
* Trend Background: Color-coded background suggesting potential ongoing uptrend/downtrend
* Liquidity Highlighting: Background colors indicating typical high/low market liquidity periods
4. TradingView Strategy Plots and Backtesting Data : Standard performance metrics showing entry/exit points, equity curves, and trade statistics, based on the signals generated by the script.
----------------------------------------------
Detailed Setup & Configuration
The indicator features a user-friendly input panel organized in sequential steps to guide you through the complete setup process. Tooltips for each step provide additional information to help you understand the actions required to get the strategy running.
Informative tables provide additional details and instructions for critical setup steps such as 3Commas bot configuration and TradingView alert creation (to activate trading on specific categories).
1. Choose Exchange, Crypto Category & Sensitivity
* Select your USDT Perpetual Exchange (BINANCE, BYBIT, BITGET, GATEIO, or OKX) - i.e. the same Exchange connected in your 3Commas account
* Choose your preferred crypto category, or define your watchlist
* Choose from three sensitivity levels: Default, Aggressive, or Test Mode (test mode is designed to generate more signals, a potentially helpful feature when you are testing the indicator and alerts)
2. Setup 3Commas Bots and integrate them with the algo
* Create both LONG and SHORT DCA Bots in 3Commas
* Configure bots to accept signals for 'All USDT Pairs' with "TradingView Custom Signal" as deal start condition
* Enter your Bot IDs and Email Token in the indicator settings
* Set a maximum budget for LONG and SHORT trades
* Choose whether to allow LONG trades, SHORT trades, or both, according to your preference and market analysis
* Set maximum trades per bar/category (i.e. the max. number of simultaneous signals that the algo may send to your 3Commas bots for execution at every bar close - every hour if you set the 1H timeframe)
* Access the detailed setup guide table for step-by-step 3Commas configuration instructions
3Commas integration
3. Choose Visuals
* Toggle various optional visual elements to add to the chart: category metrics, fired alerts, coin metrics, daily open, pivot points
* Select a color theme: Dark or Light
4. Activate Trading via Alerts
* Create TradingView alerts for each category you want to trade
* Set alert condition to "3Commas Multicoin Scalper" with "Any alert() function call"
* Set the content of the message field to: {{Message}}, deleting the default content shown in this text field, to enable proper 3Commas integration (any other text than {{Message}}, would break the delivery trading signals from Tradingview to 3Commas)
* View the alerts setup instruction table for visual guidance on this critical step
Alerts
Fired Alerts (example at a single bar)
Fired Alerts (frequency)
Important Configuration Notes
Ensure that the TradingView chart's exchange matches your selected exchange in the indicator settings and your 3Commas bot settings.
You must configure the same leverage in both the script and your 3Commas bots
Your 3Commas bots must be configured for All USDT pairs
You must enter the exact Bot IDs and Email Token from 3Commas (these remain confidential - no one, including us, has access to them)
If you activate multiple categories without sufficient capital, 3Commas will display " insufficient funds " errors - align your available capital with the number of categories you activate (each deal will use the budget amount specified in user inputs)
You are free to set your Take Profit % / trailing on 3Commas
We recommend not to use DCA orders (i.e. set the number of DCA orders at zero)
Legend of symbols and plots on the chart
----------------------------------------------
FAQs
General Questions
❓ Q: What features are included in this indicator? A: This indicator provides access to the "Top Major Coins" category and a custom category option where you can define up to 10 pairs of your choice. It includes multi-exchange support, 3Commas integration, a dual strategy approach, visual indicators, trade controls, and comprehensive backtesting capabilities. The indicator is optimized to manage up to 2 trades per hour/category with leverage up to 10x and trade sizes up to 500 USDT - everything needed for traders looking to automate their crypto trading across multiple pairs simultaneously.
❓ Q: What is Global Score? A: The Global Score serves as a foundation for signal generation. When a candle's score exceeds certain thresholds (defined by your Risk Level setting), it becomes a candidate for signal generation. However, not all high-scoring candles generate trading signals - the indicator applies additional pattern recognition and contextual filters. For example, a strongly positive score (lime candle) in an established uptrend may trigger a "Trend Following" signal, while a strongly negative score (red candle) in a downtrend might generate a "Trend following Short" signal. Similarly, contrarian signals are generated when specific reversal patterns occur alongside appropriate Global Score values, often involving wick analysis and pivot point interactions. This multi-layer approach helps filter out false positives and identify higher-probability trading setups.
❓ Q: What's the difference between "Trend following" and "Contrarian" signals in the script? A: "Trend Following" signals follow the identified trends while "Contrarian" signals anticipate potential trend reversals.
❓ Q: Why don't I see any signals on my chart? A: Make sure you're viewing a USDT Perpetual pair from your selected exchange that belongs to the crypto category you've chosen to analyze. For example, if you've selected the "Top Major Coins" category with Binance as your exchange, you need to view a chart of one of those specific pairs (like BINANCE:BTCUSDT.P) to see signals. If you switch exchanges, for example from Binance to Bybit, you need to pull a Bybit pair on the chart to see backtesting data and signals.
❓ Q: Does this indicator guarantee profits? A: No. Trading cryptocurrencies involves significant risk, and past performance is not indicative of future results. This indicator is a tool to help you identify potential trading setups, but it does not and cannot guarantee profits.
❓ Q: Does this indicator repaint or use lookahead bias? A: No. All trading signals generated by this indicator are based only on completed price data and do not repaint. The system is designed to ensure that backtesting results reflect as closely as possible what you should experience in live trading.
While reference levels like pivot points are kept stable throughout the day using lookahead on, the actual buy and sell signals are calculated using only historical data (lookahead off) that would have been available at that moment in time. This ensures reliability and consistency between backtesting and real-time trading performance.
Technical Setup
❓ Q: What exchanges are supported? A: The strategy supports BINANCE, BYBIT, BITGET, GATEIO, and OKX USDT Perpetual markets (i.e. all the Exchanges you can connect to your 3Commas account for USDT Perpetual trading, excluding Coinbase Perpetual that offers USDC pairs, instead of USDT).
❓ Q: What timeframe should I use? A: The indicator is optimized for the 1-hour (1H) timeframe but may run on any timeframe.
❓ Q: How many coins can I trade at once? A: You can trade all coins within the selected category. You can activate categories by setting up alerts.
❓ Q: How many alerts do I need to set up? A: You need to set up one alert for each crypto category you want to trade. We recommend starting with one category, testing the results carefully, monitoring performance daily, and perhaps activating additional categories in a second stage.
❓ Q: Are there any specific risk management features built into the indicator? A: Yes, the indicator includes risk management features: adjustable maximum trades per hour/category, the ability to enable/disable long or short signals depending on market conditions, customizable trade size for both long and short positions, and different sensitivity/risk level settings.
❓ Q: What happens if 3Commas can't execute a signal? A: If 3Commas cannot execute a signal (due to insufficient funds, bot offline, etc.), the trade will be skipped. The indicator will continue sending signals for other valid setups, but it doesn't retry failed signals.
❓ Q: Can I run this indicator on multiple charts at once? A: Yes, but it's not necessary. The indicator analyzes all coins in your selected categories regardless of which chart you apply it to. For optimal resource usage, apply it to a single chart of a USDT Perpetual pair from your selected exchange. To stop trading a category, simply delete the alert created for that category.
❓ Q: How frequently does the indicator scan for new signals? A: The indicator scans all coins in your selected categories at the close of each bar (every hour if you selected the 1H timeframe).
----------------------------------------------
⚠️
Disclaimer
This indicator is for informational and educational purposes only and does not constitute financial advice. Trading cryptocurrencies involves significant risk, including the potential loss of all invested capital, and past performance is not indicative of future results.
Always conduct your own thorough research (DYOR) and understand the risks involved before making any trading decisions. Trading with leverage significantly amplifies both potential profits and losses - exercise extreme caution when using leverage and never risk more than you can afford to lose.
The Bot ID and Email Token information are transmitted directly from TradingView to 3Commas via secure connections. No third party or entity will ever have access to this data (including the Author). Do not share your 3Commas credentials with anyone.
This indicator is not affiliated with, endorsed by, or sponsored by TradingView or 3Commas.

TEMA OBOS Strategy PakunTEMA OBOS Strategy
Overview
This strategy combines a trend-following approach using the Triple Exponential Moving Average (TEMA) with Overbought/Oversold (OBOS) indicator filtering.
By utilizing TEMA crossovers to determine trend direction and OBOS as a filter, it aims to improve entry precision.
This strategy can be applied to markets such as Forex, Stocks, and Crypto, and is particularly designed for mid-term timeframes (5-minute to 1-hour charts).
Strategy Objectives
Identify trend direction using TEMA
Use OBOS to filter out overbought/oversold conditions
Implement ATR-based dynamic risk management
Key Features
1. Trend Analysis Using TEMA
Uses crossover of short-term EMA (ema3) and long-term EMA (ema4) to determine entries.
ema4 acts as the primary trend filter.
2. Overbought/Oversold (OBOS) Filtering
Long Entry Condition: up > down (bullish trend confirmed)
Short Entry Condition: up < down (bearish trend confirmed)
Reduces unnecessary trades by filtering extreme market conditions.
3. ATR-Based Take Profit (TP) & Stop Loss (SL)
Adjustable ATR multiplier for TP/SL
Default settings:
TP = ATR × 5
SL = ATR × 2
Fully customizable risk parameters.
4. Customizable Parameters
TEMA Length (for trend calculation)
OBOS Length (for overbought/oversold detection)
Take Profit Multiplier
Stop Loss Multiplier
EMA Display (Enable/Disable TEMA lines)
Bar Color Change (Enable/Disable candle coloring)
Trading Rules
Long Entry (Buy Entry)
ema3 crosses above ema4 (Golden Cross)
OBOS indicator confirms up > down (bullish trend)
Execute a buy position
Short Entry (Sell Entry)
ema3 crosses below ema4 (Death Cross)
OBOS indicator confirms up < down (bearish trend)
Execute a sell position
Take Profit (TP)
Entry Price + (ATR × TP Multiplier) (Default: 5)
Stop Loss (SL)
Entry Price - (ATR × SL Multiplier) (Default: 2)
TP/SL settings are fully customizable to fine-tune risk management.
Risk Management Parameters
This strategy emphasizes proper position sizing and risk control to balance risk and return.
Trading Parameters & Considerations
Initial Account Balance: $7,000 (adjustable)
Base Currency: USD
Order Size: 10,000 USD
Pyramiding: 1
Trading Fees: $0.94 per trade
Long Position Margin: 50%
Short Position Margin: 50%
Total Trades (M5 Timeframe): 128
Deep Test Results (2024/11/01 - 2025/02/24)BTCUSD-5M
Total P&L:+1638.20USD
Max equity drawdown:694.78USD
Total trades:128
Profitable trades:44.53
Profit factor:1.45
These settings aim to protect capital while maintaining a balanced risk-reward approach.
Visual Support
TEMA Lines (Three EMAs)
Trend direction is indicated by color changes (Blue/Orange)
ema3 (short-term) and ema4 (long-term) crossover signals potential entries
OBOS Histogram
Green → Strong buying pressure
Red → Strong selling pressure
Blue → Possible trend reversal
Entry & Exit Markers
Blue Arrow → Long Entry Signal
Red Arrow → Short Entry Signal
Take Profit / Stop Loss levels displayed
Strategy Improvements & Uniqueness
This strategy is based on indicators developed by "l_lonthoff" and "jdmonto0", but has been significantly optimized for better entry accuracy, visual clarity, and risk management.
Enhanced Trend Identification with TEMA
Detects early trend reversals using ema3 & ema4 crossover
Reduces market noise for a smoother trend-following approach
Improved OBOS Filtering
Prevents excessive trading
Reduces unnecessary risk exposure
Dynamic Risk Management with ATR-Based TP/SL
Not a fixed value → TP/SL adjusts to market volatility
Fully customizable ATR multiplier settings
(Default: TP = ATR × 5, SL = ATR × 2)
Summary
The TEMA + OBOS Strategy is a simple yet powerful trading method that integrates trend analysis and oscillators.
TEMA for trend identification
OBOS for noise reduction & overbought/oversold filtering
ATR-based TP/SL settings for dynamic risk management
Before using this strategy, ensure thorough backtesting and demo trading to fine-tune parameters according to your trading style.

Non-Repainting Renko Emulation Strategy [PineIndicators]Introduction: The Repainting Problem in Renko Strategies
Renko charts are widely used in technical analysis for their ability to filter out market noise and emphasize price trends. Unlike traditional candlestick charts, which are based on fixed time intervals, Renko charts construct bricks only when price moves by a predefined amount. This makes them useful for trend identification while reducing small fluctuations.
However, Renko-based trading strategies often fail in live trading due to a fundamental issue: repainting .
Why Do Renko Strategies Repaint?
Most trading platforms, including TradingView, generate Renko charts retrospectively based on historical price data. This leads to the following issues:
Renko bricks can change or disappear when new data arrives.
Backtesting results do not reflect real market conditions. Strategies may appear highly profitable in backtests because historical data is recalculated with hindsight.
Live trading produces different results than backtesting. Traders cannot know in advance whether a new Renko brick will form until price moves far enough.
Objective of the Renko Emulator
This script simulates Renko behavior on a standard time-based chart without repainting. Instead of using TradingView’s built-in Renko charting, which recalculates past bricks, this approach ensures that once a Renko brick is formed, it remains unchanged .
Key benefits:
No past bricks are recalculated or removed.
Trading strategies can execute reliably without false signals.
Renko-based logic can be applied on a time-based chart.
How the Renko Emulator Works
1. Parameter Configuration & Initialization
The script defines key user inputs and variables:
brickSize : Defines the Renko brick size in price points, adjustable by the user.
renkoPrice : Stores the closing price of the last completed Renko brick.
prevRenkoPrice : Stores the price level of the previous Renko brick.
brickDir : Tracks the direction of Renko bricks (1 = up, -1 = down).
newBrick : A boolean flag that indicates whether a new Renko brick has been formed.
brickStart : Stores the bar index at which the current Renko brick started.
2. Identifying Renko Brick Formation Without Repainting
To ensure that the strategy does not repaint, Renko calculations are performed only on confirmed bars.
The script calculates the difference between the current price and the last Renko brick level.
If the absolute price difference meets or exceeds the brick size, a new Renko brick is formed.
The new Renko price level is updated based on the number of bricks that would fit within the price movement.
The direction (brickDir) is updated , and a flag ( newBrick ) is set to indicate that a new brick has been formed.
3. Visualizing Renko Bricks on a Time-Based Chart
Since TradingView does not support live Renko charts without repainting, the script uses graphical elements to draw Renko-style bricks on a standard chart.
Each time a new Renko brick forms, a colored rectangle (box) is drawn:
Green boxes → Represent bullish Renko bricks.
Red boxes → Represent bearish Renko bricks.
This allows traders to see Renko-like formations on a time-based chart, while ensuring that past bricks do not change.
Trading Strategy Implementation
Since the Renko emulator provides a stable price structure, it is possible to apply a consistent trading strategy that would otherwise fail on a traditional Renko chart.
1. Entry Conditions
A long trade is entered when:
The previous Renko brick was bearish .
The new Renko brick confirms an upward trend .
There is no existing long position .
A short trade is entered when:
The previous Renko brick was bullish .
The new Renko brick confirms a downward trend .
There is no existing short position .
2. Exit Conditions
Trades are closed when a trend reversal is detected:
Long trades are closed when a new bearish brick forms.
Short trades are closed when a new bullish brick forms.
Key Characteristics of This Approach
1. No Historical Recalculation
Once a Renko brick forms, it remains fixed and does not change.
Past price action does not shift based on future data.
2. Trading Strategies Operate Consistently
Since the Renko structure is stable, strategies can execute without unexpected changes in signals.
Live trading results align more closely with backtesting performance.
3. Allows Renko Analysis Without Switching Chart Types
Traders can apply Renko logic without leaving a standard time-based chart.
This enables integration with indicators that normally cannot be used on traditional Renko charts.
Considerations When Using This Strategy
Trade execution may be delayed compared to standard Renko charts. Since new bricks are only confirmed on closed bars, entries may occur slightly later.
Brick size selection is important. A smaller brickSize results in more frequent trades, while a larger brickSize reduces signals.
Conclusion
This Renko Emulation Strategy provides a method for using Renko-based trading strategies on a time-based chart without repainting. By ensuring that bricks do not change once formed, it allows traders to use stable Renko logic while avoiding the issues associated with traditional Renko charts.
This approach enables accurate backtesting and reliable live execution, making it suitable for trend-following and swing trading strategies that rely on Renko price action.

is_strategyCorrection-Adaptive Trend Strategy (Open-Source)
Core Advantage: Designed specifically for the is_correction indicator, with full transparency and customization options.
Key Features:
Open-Source Code:
✅ Full access to the strategy logic – study how every trade signal is generated.
✅ Freedom to customize – modify entry/exit rules, risk parameters, or add new indicators.
✅ No black boxes – understand and trust every decision the strategy makes.
Built for is_correction:
Filters out false signals during market noise.
Works only in confirmed trends (is_correction = false).
Adaptable for Your Needs:
Change Take Profit/Stop Loss ratios directly in the code.
Add alerts, notifications, or integrate with other tools (e.g., Volume Profile).
For Developers/Traders:
Use the code as a template for your own strategies.
Test modifications risk-free on historical data.
How the Strategy Works:
Main Goal:
Automatically buys when the price starts rising and sells when it starts falling, but only during confirmed trends (ignoring temporary pullbacks).
What You See on the Chart:
📈 Up arrows ▼ (below the candle) = Buy signal.
📉 Down arrows ▲ (above the candle) = Sell signal.
Gray background = Market is in a correction (no trades).
Key Mechanics:
Buy Condition:
Price closes higher than the previous candle + is_correction confirms the main trend (not a pullback).
Example: Red candle → green candle → ▼ arrow → buy.
Sell Condition:
Price closes lower than the previous candle + is_correction confirms the trend (optional: turn off short-selling in settings).
Exit Rules:
Closes trades automatically at:
+0.5% profit (adjustable in settings).
-0.5% loss (adjustable).
Or if a reverse signal appears (e.g., sell signal after a buy).
User-Friendly Settings:
Sell – On (default: ON):
ON → Allows short-selling (selling when price falls).
OFF → Strategy only buys and closes positions.
Revers (default: OFF):
ON → Inverts signals (▼ = sell, ▲ = buy).
%Profit & %Loss:
Adjust these values (0-30%) to increase/decrease profit targets and risk.
Example Scenario:
Buy Signal:
Price rises for 3 days → green ▼ arrow → strategy buys.
Stop loss set 0.5% below entry price.
If price keeps rising → trade closes at +0.5% profit.
Correction Phase:
After a rally, price drops for 1 day → gray background → strategy ignores the drop (no action).
Stop Loss Trigger:
If price drops 0.5% from entry → trade closes automatically.
Key Features:
Correction Filter (is_correction):
Acts as a “noise filter” → avoids trades during temporary pullbacks.
Flexibility:
Disable short-selling, flip signals, or tweak profit/loss levels in seconds.
Transparency:
Open-source code → see exactly how every signal is generated (click “Source” in TradingView).
Tips for Beginners:
Test First:
Run the strategy on historical data (click the “Chart” icon in TradingView).
See how it performed in the past.
Customize It:
Increase %Profit to 2-3% for volatile assets like crypto.
Turn off Sell – On if short-selling confuses you.
Trust the Stop Loss:
Even if you think the price will rebound, the strategy will close at -0.5% to protect your capital.
Where to Find Settings:
Click the strategy name on the top-left of your chart → adjust sliders/toggles in the menu.
Русская Версия
Трендовая стратегия с открытым кодом
Главное преимущество: Полная прозрачность логики и адаптация под ваши нужды.
Особенности:
Открытый исходный код:
✅ Видите всю «кухню» стратегии – как формируются сигналы, когда открываются сделки.
✅ Меняйте правила – корректируйте тейк-профит, стоп-лосс или добавляйте новые условия.
✅ Никаких секретов – вы контролируете каждое правило.
Заточка под is_correction:
Игнорирует ложные сигналы в коррекциях.
Работает только в сильных трендах (is_correction = false).
Гибкая настройка:
Подстройте параметры под свой риск-менеджмент.
Добавьте свои индикаторы или условия для входа.
Для трейдеров и разработчиков:
Используйте код как основу для своих стратегий.
Тестируйте изменения на истории перед реальной торговлей.
Простыми словами:
Почему это удобно:
Открытый код = полный контроль. Вы можете:
Увидеть, как именно стратегия решает купить или продать.
Изменить правила закрытия сделок (например, поставить TP=2% вместо 1.5%).
Добавить новые условия (например, торговать только при высоком объёме).
Примеры кастомизации:
Новички: Меняйте только TP/SL в настройках (без кодинга).
Продвинутые: Добавьте RSI-фильтр, чтобы избегать перекупленности.
Разработчики: Встройте стратегию в свою торговую систему.
Как начать:
Скачайте код из TradingView.
Изучите логику в разделе strategy.entry/exit.
Меняйте параметры в блоке input.* (безопасно!).
Тестируйте изменения и оптимизируйте под свои цели.
Как работает стратегия:
Главная задача:
Автоматически покупает, когда цена начинает расти, и продаёт, когда падает. Но делает это «умно» — только когда рынок в основном тренде, а не во временном откате (коррекции).
Что видно на графике:
📈 Стрелки вверх ▼ (под свечой) — сигнал на покупку.
📉 Стрелки вниз ▲ (над свечой) — сигнал на продажу.
Серый фон — рынок в коррекции (не торгуем).
Как это работает:
Когда покупаем:
Если цена закрылась выше предыдущей и индикатор is_correction показывает «основной тренд» (не коррекция).
Пример: Была красная свеча → стала зелёная → появилась стрелка ▼ → покупаем.
Когда продаём:
Если цена закрылась ниже предыдущей и is_correction подтверждает тренд (опционально, можно отключить в настройках).
Когда закрываем сделку:
Автоматически при достижении:
+0.5% прибыли (можно изменить в настройках).
-0.5% убытка (можно изменить).
Или если появился противоположный сигнал (например, после покупки пришла стрелка продажи).
Настройки для чайников:
«Sell – On» (включено по умолчанию):
Если включено → стратегия будет продавать в шорт.
Если выключено → только покупки и закрытие позиций.
«Revers» (выключено по умолчанию):
Если включить → стратегия будет работать наоборот (стрелки ▼ = продажа, ▲ = покупка).
«%Profit» и «%Loss»:
Меняйте эти цифры (от 0 до 30), чтобы увеличить/уменьшить прибыль и риски.
Пример работы:
Сигнал на покупку:
Цена 3 дня растет → появляется зелёная стрелка ▼ → стратегия покупает.
Стоп-лосс ставится на 0.5% ниже цены входа.
Если цена продолжает расти → сделка закрывается при +0.5% прибыли.
Коррекция:
После роста цена падает на 1 день → фон становится серым → стратегия игнорирует это падение (не закрывает сделку).
Стоп-лосс:
Если цена упала на 0.5% от точки входа → сделка закрывается автоматически.
Важные особенности:
Фильтр коррекций (is_correction):
Это «защита от шума» — стратегия не реагирует на мелкие откаты, работая только в сильных трендах.
Гибкие настройки:
Можно запретить шорты, перевернуть сигналы или изменить уровни прибыли/убытка за 2 клика.
Прозрачность:
Весь код открыт → вы можете увидеть, как формируется каждый сигнал (меню «Исходник» в TradingView).
Советы для новичков:
Начните с теста:
Запустите стратегию на исторических данных (кнопка «Свеча» в окне TradingView).
Посмотрите, как она работала в прошлом.
Настройте под себя:
Увеличьте %Profit до 2-3%, если торгуете валюты.
Отключите «Sell – On», если не понимаете шорты.
Доверяйте стоп-лоссу:
Даже если кажется, что цена развернётся — стратегия закроет сделку при -0.5%, защитив ваш депозит.
Где найти настройки:
Кликните на название стратегии в верхнем левом углу графика → откроется меню с ползунками и переключателями.
Важно: Стратегия предоставляет «рыбу» – чтобы она стала «уловистой», адаптируйте её под свой стиль торговли!

Breakouts With Timefilter Strategy [LuciTech]This strategy captures breakout opportunities using pivot high/low breakouts while managing risk through dynamic stop-loss placement and position sizing. It includes a time filter to limit trades to specific sessions.
How It Works
A long trade is triggered when price closes above a pivot high, and a short trade when price closes below a pivot low.
Stop-loss can be set using ATR, prior candle high/low, or a fixed point value. Take-profit is based on a risk-reward multiplier.
Position size adjusts based on the percentage of equity risked.
Breakout signals are marked with triangles, and entry, stop-loss, and take-profit levels are plotted.
moving average filter: Bullish breakouts only trigger above the MA, bearish breakouts below.
The time filter shades the background during active trading hours.
Customization:
Adjustable pivot length for breakout sensitivity.
Risk settings: percentage risked, risk-reward ratio, and stop-loss type.
ATR settings: length, smoothing method (RMA, SMA, EMA, WMA).
Moving average filter (SMA, EMA, WMA, VWMA, HMA) to confirm breakouts.

ADX for BTC [PineIndicators]The ADX Strategy for BTC is a trend-following system that uses the Average Directional Index (ADX) to determine market strength and momentum shifts. Designed for Bitcoin trading, this strategy applies a customizable ADX threshold to confirm trend signals and optionally filters entries using a Simple Moving Average (SMA). The system features automated entry and exit conditions, dynamic trade visualization, and built-in trade tracking for historical performance analysis.
⚙️ Core Strategy Components
1️⃣ Average Directional Index (ADX) Calculation
The ADX indicator measures trend strength without indicating direction. It is derived from the Positive Directional Movement (+DI) and Negative Directional Movement (-DI):
+DI (Positive Directional Index): Measures upward price movement.
-DI (Negative Directional Index): Measures downward price movement.
ADX Value: Higher values indicate stronger trends, regardless of direction.
This strategy uses a default ADX length of 14 to smooth out short-term fluctuations while detecting sustainable trends.
2️⃣ SMA Filter (Optional Trend Confirmation)
The strategy includes a 200-period SMA filter to validate trend direction before entering trades. If enabled:
✅ Long Entry is only allowed when price is above a long-term SMA multiplier (5x the standard SMA length).
✅ If disabled, the strategy only considers the ADX crossover threshold for trade entries.
This filter helps reduce entries in sideways or weak-trend conditions, improving signal reliability.
📌 Trade Logic & Conditions
🔹 Long Entry Conditions
A buy signal is triggered when:
✅ ADX crosses above the threshold (default = 14), indicating a strengthening trend.
✅ (If SMA filter is enabled) Price is above the long-term SMA multiplier.
🔻 Exit Conditions
A position is closed when:
✅ ADX crosses below the stop threshold (default = 45), signaling trend weakening.
By adjusting the entry and exit ADX levels, traders can fine-tune sensitivity to trend changes.
📏 Trade Visualization & Tracking
Trade Markers
"Buy" label (▲) appears when a long position is opened.
"Close" label (▼) appears when a position is exited.
Trade History Boxes
Green if a trade is profitable.
Red if a trade closes at a loss.
Trend Tracking Lines
Horizontal lines mark entry and exit prices.
A filled trade box visually represents trade duration and profitability.
These elements provide clear visual insights into trade execution and performance.
⚡ How to Use This Strategy
1️⃣ Apply the script to a BTC chart in TradingView.
2️⃣ Adjust ADX entry/exit levels based on trend sensitivity.
3️⃣ Enable or disable the SMA filter for trend confirmation.
4️⃣ Backtest performance to analyze historical trade execution.
5️⃣ Monitor trade markers and history boxes for real-time trend insights.
This strategy is designed for trend traders looking to capture high-momentum market conditions while filtering out weak trends.

MACD Volume Strategy for XAUUSD (15m) [PineIndicators]The MACD Volume Strategy is a momentum-based trading system designed for XAUUSD on the 15-minute timeframe. It integrates two key market indicators: the Moving Average Convergence Divergence (MACD) and a volume-based oscillator to identify strong trend shifts and confirm trade opportunities. This strategy uses dynamic position sizing, incorporates leverage customization, and applies structured entry and exit conditions to improve risk management.
⚙️ Core Strategy Components
1️⃣ Volume-Based Momentum Calculation
The strategy includes a custom volume oscillator to filter trade signals based on market activity. The oscillator is derived from the difference between short-term and long-term volume trends using Exponential Moving Averages (EMAs)
Short EMA (default = 5) represents recent volume activity.
Long EMA (default = 8) captures broader volume trends.
Positive values indicate rising volume, supporting momentum-based trades.
Negative values suggest weak market activity, reducing signal reliability.
By requiring positive oscillator values, the strategy ensures momentum confirmation before entering trades.
2️⃣ MACD Trend Confirmation
The strategy uses the MACD indicator as a trend filter. The MACD is calculated as:
Fast EMA (16-period) detects short-term price trends.
Slow EMA (26-period) smooths out price fluctuations to define the overall trend.
Signal Line (9-period EMA) helps identify crossovers, signaling potential trend shifts.
Histogram (MACD – Signal) visualizes trend strength.
The system generates trade signals based on MACD crossovers around the zero line, confirming bullish or bearish trend shifts.
📌 Trade Logic & Conditions
🔹 Long Entry Conditions
A buy signal is triggered when all the following conditions are met:
✅ MACD crosses above 0, signaling bullish momentum.
✅ Volume oscillator is positive, confirming increased trading activity.
✅ Current volume is at least 50% of the previous candle’s volume, ensuring market participation.
🔻 Short Entry Conditions
A sell signal is generated when:
✅ MACD crosses below 0, indicating bearish momentum.
✅ Volume oscillator is positive, ensuring market activity is sufficient.
✅ Current volume is less than 50% of the previous candle’s volume, showing decreasing participation.
This multi-factor approach filters out weak or false signals, ensuring that trades align with both momentum and volume dynamics.
📏 Position Sizing & Leverage
Dynamic Position Calculation:
Qty = strategy.equity × leverage / close price
Leverage: Customizable (default = 1x), allowing traders to adjust risk exposure.
Adaptive Sizing: The strategy scales position sizes based on account equity and market price.
Slippage & Commission: Built-in slippage (2 points) and commission (0.01%) settings provide realistic backtesting results.
This ensures efficient capital allocation, preventing overexposure in volatile conditions.
🎯 Trade Management & Exits
Take Profit & Stop Loss Mechanism
Each position includes predefined profit and loss targets:
Take Profit: +10% of risk amount.
Stop Loss: Fixed at 10,100 points.
The risk-reward ratio remains balanced, aiming for controlled drawdowns while maximizing trade potential.
Visual Trade Tracking
To improve trade analysis, the strategy includes:
📌 Trade Markers:
"Buy" label when a long position opens.
"Close" label when a position exits.
📌 Trade History Boxes:
Green for profitable trades.
Red for losing trades.
📌 Horizontal Trade Lines:
Shows entry and exit prices.
Helps identify trend movements over multiple trades.
This structured visualization allows traders to analyze past performance directly on the chart.
⚡ How to Use This Strategy
1️⃣ Apply the script to a XAUUSD (Gold) 15m chart in TradingView.
2️⃣ Adjust leverage settings as needed.
3️⃣ Enable backtesting to assess past performance.
4️⃣ Monitor volume and MACD conditions to understand trade triggers.
5️⃣ Use the visual trade markers to review historical performance.
The MACD Volume Strategy is designed for short-term trading, aiming to capture momentum-driven opportunities while filtering out weak signals using volume confirmation.

Balance of Power for US30 4H [PineIndicators]The Balance of Power (BoP) Strategy is a momentum-based trading system for the US30 index on a 4-hour timeframe. It measures the strength of buyers versus sellers in each candle using the Balance of Power (BoP) indicator and executes trades based on predefined threshold crossovers. The strategy includes dynamic position sizing, adjustable leverage, and visual trade tracking.
⚙️ Core Strategy Mechanics
Positive values indicate buying strength.
Negative values indicate selling strength.
Values close to 1 suggest strong bullish momentum.
Values close to -1 indicate strong bearish pressure.
The strategy uses fixed threshold crossovers to determine trade entries and exits.
📌 Trade Logic
Entry Conditions
Long Entry: When BoP crosses above 0.8, signaling strong buying pressure.
Exit Conditions
Position Close: When BoP crosses below -0.8, indicating a shift to selling pressure.
This threshold-based system filters out low-confidence signals and focuses on high-momentum shifts.
📏 Position Sizing & Leverage
Leverage: Adjustable by the user (default = 5x).
Risk Management: Position size adapts dynamically based on equity fluctuations.
📊 Trade Visualization & History Tracking
Trade Markers:
"Buy" labels appear when a long position is opened.
"Close" labels appear when a position is exited.
Trade History Boxes:
Green for profitable trades.
Red for losing trades.
These elements provide clear visual tracking of past trade execution.
⚡ Usage & Customization
1️⃣ Apply the script to a US30 4H chart in TradingView.
2️⃣ Adjust leverage settings as needed.
3️⃣ Review trade signals and historical performance with visual markers.
4️⃣ Enable backtesting to evaluate past performance.
This strategy is designed for momentum-based trading and is best suited for volatile market conditions.

Btc and Eth 5 min winnerWhat the Strategy Does
Finding the Trend (Like Watching the Bus Move): The strategy uses special tools called Hull Moving Averages (HMAs) to figure out if Bitcoin (BTC) Ethereum (ETH) prices are generally going up or down. It looks at short-term (5 minutes) and long-term (10 minutes) price movements to make sure the “bus” (the market) is moving strongly in one direction—up for buying, down for selling.
Spotting Good Times to Jump On (Buy or Sell Signals): It looks for two types of opportunities:
Pullbacks: When the price dips a little while still moving up (like the bus slowing down but not stopping), it’s a chance to buy.
Breakouts: When the price suddenly jumps higher after being stuck (like the bus speeding up), it’s another chance to buy. It does the opposite for selling when prices are dropping.
It also checks if there’s enough “passenger activity” (volume) and momentum (speed of price change) to make sure it’s a good move.
Avoiding Traffic Jams (Filters): The strategy uses tools like RSI (to check if the market’s too fast or too slow), volume (to see if enough people are trading), and ATR (to measure how wild the price swings are). It skips trades if things look too chaotic or if the trend isn’t strong enough.
Setting Safety Stops and Profit Targets: Once you’re on the “bus,” it sets rules to protect you:
Stop-Loss: If the price moves against you by a small amount (0.5% of the typical price swing), you jump off to avoid losing too much—think of it as getting off before the bus crashes.
Take-Profit: If the price moves in your favor by a small amount (1.0% of the typical swing), you cash out—imagine getting off at your stop with a profit.
Trailing Stop: If the price keeps moving your way, it adjusts your exit point to lock in more profit, like moving your stop closer as the bus keeps going.
Using Leverage (10x Boost): This strategy uses 10x leverage on Binance futures, meaning for every $1 you have, you trade like you have $10. This can make profits (or losses) 10 times bigger, so it’s risky but can be rewarding if you’re careful.
Why 5 Minutes and Bitcoin and Ethereum?
5-Minute Chart: This is like checking the bus every 5 minutes to make quick, small trades—perfect for fast, short profits.
Bitcoin Ethereum (BTC/USD)(ETH/USD): It’s the most popular and liquid crypto, so there’s lots of activity, making it easier to jump on and off without getting stuck.
Why It Aims for 90% Wins (But Be Realistic)
The goal is to win 9 out of 10 trades by being super picky about when to trade—only jumping on when the trend, momentum, and volume are all perfect. But in real trading, markets can be unpredictable, so 90% is very hard to achieve. Still, this strategy tries to be as accurate as possible by avoiding bad moves and focusing on strong trends.
Risks for a New Trader
Leverage: Trading with 10x leverage means small price moves can lead to big losses if you’re not careful. Start with a demo account (pretend money) on TradingView or Binance to practice.
Learning Curve: This strategy uses technical terms (like HMAs, RSI) and tools you’ll need to learn over time. Don’t rush—just practice and ask questions!
How to Use It
Go to TradingView, load this strategy on a 5-minute BTC/USD futures chart on Binance.
Watch the green triangles (buy signals) and red triangles (sell signals) on the chart—they tell you when to trade.
Use the stops and targets to manage your trades—don’t guess, let the strategy guide you.
Start small, learn from each trade, and don’t risk money you can’t afford to lose.
This is like learning to ride a bike—start slow, practice, and you’ll get better. If you have more questions or want simpler tips, feel free to ask! Trading can be fun and rewarding, but it takes patience and practice.

TSI Long/Short for BTC 2HThe TSI Long/Short for BTC 2H strategy is an advanced trend-following system designed specifically for trading Bitcoin (BTC) on a 2-hour timeframe. It leverages the True Strength Index (TSI) to identify momentum shifts and executes both long and short trades in response to dynamic market conditions.
Unlike traditional moving average-based strategies, this script uses a double-smoothed momentum calculation, enhancing signal accuracy and reducing noise. It incorporates automated position sizing, customizable leverage, and real-time performance tracking, ensuring a structured and adaptable trading approach.
🔹 What Makes This Strategy Unique?
Unlike simple crossover strategies or generic trend-following approaches, this system utilizes a customized True Strength Index (TSI) methodology that dynamically adjusts to market conditions.
🔸 True Strength Index (TSI) Filtering – The script refines the TSI by applying double exponential smoothing, filtering out weak signals and capturing high-confidence momentum shifts.
🔸 Adaptive Entry & Exit Logic – Instead of fixed thresholds, it compares the TSI value against a dynamically determined high/low range from the past 100 bars to confirm trade signals.
🔸 Leverage & Risk Optimization – Position sizing is dynamically adjusted based on account equity and leverage settings, ensuring controlled risk exposure.
🔸 Performance Monitoring System – A built-in performance tracking table allows traders to evaluate monthly and yearly results directly on the chart.
📊 Core Strategy Components
1️⃣ Momentum-Based Trade Execution
The strategy generates long and short trade signals based on the following conditions:
✅ Long Entry Condition – A buy signal is triggered when the TSI crosses above its 100-bar highest value (previously set), confirming bullish momentum.
✅ Short Entry Condition – A sell signal is generated when the TSI crosses below its 100-bar lowest value (previously set), indicating bearish pressure.
Each trade execution is fully automated, reducing emotional decision-making and improving trading discipline.
2️⃣ Position Sizing & Leverage Control
Risk management is a key focus of this strategy:
🔹 Dynamic Position Sizing – The script calculates position size based on:
Account Equity – Ensuring trade sizes adjust dynamically with capital fluctuations.
Leverage Multiplier – Allows traders to customize risk exposure via an adjustable leverage setting.
🔹 No Fixed Stop-Loss – The strategy relies on reversals to exit trades, meaning each position is closed when the opposite signal appears.
This design ensures maximum capital efficiency while adapting to market conditions in real time.
3️⃣ Performance Visualization & Tracking
Understanding historical performance is crucial for refining strategies. The script includes:
📌 Real-Time Trade Markers – Buy and sell signals are visually displayed on the chart for easy reference.
📌 Performance Metrics Table – Tracks monthly and yearly returns in percentage form, helping traders assess profitability over time.
📌 Trade History Visualization – Completed trades are displayed with color-coded boxes (green for long trades, red for short trades), visually representing profit/loss dynamics.
📢 Why Use This Strategy?
✔ Advanced Momentum Detection – Uses a double-smoothed TSI for more accurate trend signals.
✔ Fully Automated Trading – Removes emotional bias and enforces discipline.
✔ Customizable Risk Management – Adjust leverage and position sizing to suit your risk profile.
✔ Comprehensive Performance Tracking – Integrated reporting system provides clear insights into past trades.
This strategy is ideal for Bitcoin traders looking for a structured, high-probability system that adapts to both bullish and bearish trends on the 2-hour timeframe.
📌 How to Use: Simply add the script to your 2H BTC chart, configure your leverage settings, and let the system handle trade execution and tracking! 🚀

Flux Charts - S&D Automation💎 GENERAL OVERVIEW
The MTF Supply & Demand Zones (S&D) Automation is a powerful and versatile tool designed to help traders rigorously test their trading strategies against historical market data. With various advanced settings, traders can fine-tune their strategies, assess performance, and identify key improvements before deploying in live trading environments. This tool offers a wide range of configurable settings, explained within this write-up.
Features of the new S&D Automation:
Step By Step : Configure your strategy step by step, which will allow you to have OR & AND logic in your strategies.
Highly Configurable : Offers multiple parameters for fine-tuning trade entry and exit conditions.
Multi-Timeframe Analysis : Allows traders to analyze multiple timeframes simultaneously for enhanced accuracy.
Provides advanced stop-loss, take-profit, and break-even settings.
Incorporates Supply & Demand Zone conditions, with settings like Sensitivity, Zone Invalidation, Minimum Zone Width & Minimum Zone Length settings for refined strategy execution.
🚩 UNIQUENESS
The S&D Automation stands out from conventional backtesting tools due to its unparalleled flexibility, precision, and advanced trading logic integration. Key factors that make it unique include:
✅ Comprehensive Strategy Customization – Unlike traditional backtesters that offer basic entry and exit conditions, S&D Automation provides a highly detailed parameter set, allowing traders to fine-tune their strategies with precision.
✅ Multi-Timeframe Supply & Demand Zones – This is the first-ever tool that allows traders to backtest Supply & Demand zones on multiple timeframes.
✅ Customizable Take-Profit Conditions – Offers various methods to set take-profit exits, including using core features from Supply & Demand Zones, and fixed exits like ATR, % change or price change, enabling traders to tailor their exit strategies to specific market behaviors.
✅ Customizable Stop-Loss Conditions – Provides several ways to set up stop losses, including using concepts from Supply & Demand Zones and trailing stops or fixed exits like ATR, % change or price change, allowing for dynamic risk management tailored to individual strategies.
✅ Integration of External Indicators – Allows the inclusion of other indicators or data sources from TradingView for creating strategy conditions, enabling traders to enhance their strategies with additional insights and data points.
By integrating these advanced features, S&D Automation ensures that traders can rigorously test and optimize their strategies with great accuracy and efficiency.
📌 HOW DOES IT WORK ?
The first setting you will want to set it the pyramiding setting. This setting controls the number of simultaneous trades in the same direction allowed in the strategy. For example, if you set it to 1, only one trade can be active in any time, and the second trade will not be entered unless the first one is exited. If it is set to 2, the script will handle both of them at the same time. Note that you should enter the same value to this pyramiding setting, and the pyramiding setting in the "Properties" tab of the script for this to work.
You can enable and set a backtesting window that will limit the entries to between the start date & end date.
Then, you can enter your desired settings for Supply & Demand Zones. You can also enable and set up to 3 timeframes, which you can use later on when customizing your strategies enter / exit conditions.
Entry Conditions
From the "Long Conditions" or the "Short Conditions" groups, you can set your position entry conditions. For settings like "initial capital" or "order size", you can open the "Properties" tab, where these are handled.
The S&D Automation can use the following conditions for entry conditions :
1. Demand Zone
Detection: Triggered when a Demand Zone forms or is detected
Retest: Triggered when price retests a Demand Zone. A retest is confirmed when a candle enters a Demand Zone and closes outside of it.
2nd Retest: Triggered when price retests a Demand Zone for the second time. A retest is confirmed when a candle enters a Demand Zone and closes outside of it.
3rd Retest: Triggered when price retests a Demand Zone for the third time. A retest is confirmed when a candle enters a Demand Zone and closes outside of it.
Retracement: Triggered when price touches a Demand Zone
Break: Triggered when a Demand Zone is invalidated by candle close or wick, depending on the user's input.
2. Supply Zone
Detection: Triggered when a Supply Zone forms or is detected
Retest: Triggered when price retests a Supply Zone. A retest is confirmed when a candle enters a Supply Zone and closes outside of it.
2nd Retest: Triggered when price retests a Supply Zone for the second time. A retest is confirmed when a candle enters a Supply Zone and closes outside of it.
3rd Retest: Triggered when price retests a Supply Zone for the third time. A retest is confirmed when a candle enters a Supply Zone and closes outside of it.
Retracement: Triggered when price touches a Supply Zone
Break: Triggered when a Supply Zone is invalidated by candle close or wick, depending on the user's input.
3. Any Zone
Detection: Triggered when any Supply or Demand Zone forms or is detected
Retest: Triggered when price retests any Supply or Demand Zone. A retest is confirmed when a candle enters any Supply or Demand Zone and closes outside of it.
2nd Retest: Triggered when price retests any Supply or Demand Zone for the second time. A retest is confirmed when a candle enters any Supply or Demand Zone and closes outside of it.
3rd Retest: Triggered when price retests any Supply or Demand Zone for the third time. A retest is confirmed when a candle enters any Supply or Demand Zone and closes outside of it.
Retracement: Triggered when price touches any Supply or Demand Zone
Break: Triggered when any Supply or Demand Zone is invalidated by candle close or wick, depending on the user's input.
🕒 TIMEFRAME CONDITIONS
The S&D Automation supports Multi-Timeframe (MTF) features, just like the Supply & Demand indicator. When setting an entry condition, you can also choose the timeframe.
To set up MTF conditions, navigate to the 'Timeframes' section in the settings, select your desired timeframes, and enable them. You can choose up to three timeframes.
Once you've selected your timeframes, you can use them in your strategy. When setting long and short entry/exit conditions, you can choose from Timeframe 1, Timeframe 2, or Timeframe 3.
External Conditions
Users can use external indicators on the chart to set entry conditions.
The second dropdown in the external condition settings allows you to choose a conditional operator to compare external outputs. Available options include:
Less Than or Equal To: <=
Less Than: <
Equal To: =
Greater Than: >
Greater Than or Equal To: >=
The position entry conditions work like this ;
Each side has 5 S&D Zone conditions and 1 Source condition. Each condition can be enabled or disabled using the checkbox on the left side of them.
The next selection is the alert type, which you can select between "Detection", "Retest", "Retracement" or "Break".
You can select which timeframe this condition should work on from Timeframe 1, 2, or 3. If you select "Any Timeframe", the condition will work for all timeframes.
Lastly select the step of this condition from 1 to 6.
The Source Condition
The last condition on each side is a source condition that is different from the others. Using this condition, you can create your own logic using other indicators' outputs on your chart. For example, suppose that you have an EMA indicator in your chart. You can have the source condition to something like "EMA > high".
The Step System
Each condition has a step number, and conditions are in topological order based on them.
The conditions are executed step by step. This means the condition with step 2 cannot be executed before the condition with step 1 is executed.
Conditions with the same step numbers have "OR" logic. This means that if you have 2 conditions with step 3, the condition with step 4 can trigger after only one of the step 3 conditions is executed.
➕ OTHER ENTRY FEATURES
The S&D Automation allows traders to choose when to execute trades and when not to execute trades.
1. Only Take Trades
This setting lets users specify the time period when their strategy can open or execute trades.
2. Don't Take Trades
This setting lets users specify time periods when their strategy can't open or execute trades.
↩️ EXIT CONDITIONS
1. Exit on Opposite Signal
When enabled, a long position will close when short entry conditions are met, and a short position will close when long entry conditions are met.
2. Exit on Session End
When enabled, positions will be closed at the end of the trading session.
📈 TAKE PROFIT CONDITIONS
There are several methods available for setting take profit exits and conditions.
1. Entry Condition TP
Users can use entry conditions as triggers for take-profit exits. This setting can be found under the long and short exit conditions.
2. Fixed TP
Users can set a fixed TP for exits. This setting can be found under the long and short exit conditions. Users can choose between the following:
Price: This method triggers a TP exit when price reaches a specified level. For example, if you set the Price TP to 10 and buy NASDAQ:TSLA at $190, the trade will automatically exit when the price reaches $200 ($190 + $10).
Ticks: This method triggers a TP exit when price moves a specified number of ticks.
Percentage (%): This method triggers a TP exit when price moves a specified percentage.
ATR: This method triggers a TP exit based on a specified multiple of the Average True Range (ATR).
📉 STOP LOSS CONDITIONS
There are several methods available for setting stop-loss exits and conditions.
1. Entry Condition SL
Users can use entry conditions as triggers for stop-loss exits. This setting can be found under the long and short exit conditions.
2. Fixed SL
Users can set a fixed SL for exits. This setting can be found under the long and short exit conditions. Users can choose between the following:
Price: This method triggers a SL exit when price reaches a specified level. For example, if you set the Price SL to 10 and buy NASDAQ:TSLA at $200, the trade will automatically exit when the price reaches $190 ($200 - $10).
Ticks: This method triggers a SL exit when price moves a specified number of ticks.
Percentage (%): This method triggers a SL exit when price moves a specified percentage.
ATR: This method triggers a SL exit based on a specified multiple of the Average True Range (ATR).
3. Trailing Stop
An explanation & example for the trailing stop feature is present on the write-up within the next section.
Exit conditions have the same logic of constructing conditions like the entry ones. You can construct a Take-Profit Condition & a Stop-Loss Condition. Note that the Take-Profit condition will only work if the position is in profit, regardless of if it's triggered or not. The same applies for the Stop-Loss condition, meaning that it will only work if the position is in loss.
You can also set a Fixed TP & Fixed SL based on the price movement after the position is entered. You have options like "Price", "Ticks", "%", or "Average True Range". For example, you can set a Fixed TP like "5%", and the position will be entered once it moves 5% up in a long position.
Trailing Stop
For the Fixed SL, you also have a "Trailing" stop option, for which you can set its activation level as well. The Trailing stop activation level and its value are expressed in ticks. Check this scenario for an example :
We have a ticker with a tick value of $1. Our Trailing Stop is set to 10 ticks, and the activation level is set to 30 ticks.
We buy 1 contract when the price is $100.
When the price becomes $110, we are in $10 (10 ticks) profit and the trailing stop is now activated.
The current price our stop's on is $110 - $30 (30 ticks), which is the level of $80.
The trailing stop will only move if the price moves up the highest high the price has been after we entered the position.
Let's suppose that price moves up $40 right after our trailing stop is activated. The price will now be $150, and our trailing stop will sit on $150 - $30 (30 ticks) = $120.
If the price is down the $120 level, our stop loss will be triggered.
There is also a "Hard SL" option designed for a backup stop-loss when trailing stops are enabled. You can enable & set this option and if the price goes down before our trailing stop even activates, the position will be exited.
You can also move stop-loss to the break-even (entry price of the position) after a certain profit is achieved using the last setting of the exit conditions. Note that for this to work, you must have a Fixed SL set-up.
➕ OTHER EXIT FEATURES
1. Move Stop Loss to Breakeven
This setting allows the strategy to automatically move the SL to Breakeven (BE) when the position is in profit by a certain amount. Users can choose between the following:
Price: This method moves the SL to BE when price reaches a specified level.
Ticks: This method moves the SL to BE when price moves a specified number of ticks.
Percentage (%): This method moves the SL to BE when price moves a specified percentage.
ATR: This method moves the SL to BE when price moves a specified multiple of the Average True Range (ATR).
Example Entry Scenario
To give an example , check this scenario; out conditions are :
LONG CONDITIONS
Demand Zone Detection, Step 1
Supply Zone Retest, Step 2
Demand Zone Break, Step 2
open > close, Step 3
First, the strategy needs to detect a Demand Zone Detection in order to start working.
After it's detected, now it's looking for either a Supply Zone Retest, or a Demand Zone Break to proceed to the next step, the reason for this is that they both have the same step number.
After one of them is detected, the strategy will consistently check candlesticks for the condition open > close. If a bullish candlestick occurs, a long position will be entered.
⏰ ALERTS
This indicator uses TradingView's strategy alert system. All entries and exits will be sent as an alert if configured. It's possible to further customize these alerts to your liking. For more information check TradingView's strategy alert customization page : www.tradingview.com
⚙️ SETTINGS
1. Backtesting Settings
Pyramiding: Controls the number of simultaneous trades allowed in the strategy. This setting must have the same value that is entered on the script's properties tab on the settings pane.
Enable Custom Backtesting Period: Restricts backtesting to a specific date range.
Start & End Time Configuration: Define precise start and end dates for historical analysis.
2. General Configuration
Detection Method: There are two detection methods you can choose from for identifying Supply & Demand Zones. Both methods aim to identify key areas where price is likely to react, but they do so using different approaches. Traders can choose the method that aligns with their trading style and time horizon.
Sensitivity: The Sensitivity setting allows traders to adjust how aggressively the script identifies supply and demand zones when using the Momentum Detection Method. This setting directly impacts the threshold for detecting zones when using the momentum detection method.
Zone Invalidation: The Zone Invalidation setting determines how supply and demand zones are invalidated.
Wick -> A zone is invalidated if a candle’s wick goes below a demand zone or above a supply zone.
Close -> A zone is invalidated if a candle closes below a demand zone or above a supply zone.
Zone Visibility Range: The Zone Visibility Range setting controls how far from the current price supply and demand zones are displayed on the chart. It helps traders focus on relevant zones while avoiding clutter from distant or less impactful areas.
Minimum Zone Width: The Minimum Zone Width setting defines the smallest size a supply or demand zone must have to be displayed on the chart. It uses the Average True Range (ATR) as a reference to ensure zones are proportionate to current market volatility.
Minimum Zone Length: The Minimum Zone Length setting determines the minimum number of bars a supply or demand zone must span to be displayed on the chart. This setting helps filter out short-lived or insignificant zones, ensuring only meaningful areas of supply or demand are highlighted.
3. Multi-Timeframe Analysis
Enable Up to Three Timeframes: Select and analyze trades across multiple timeframes.
4. Entry Conditions for Long & Short Trades
Multiple Conditions (1-6): Configure up to six independent conditions per trade direction.
Condition Types: Options include Detection, Retest, 2nd Retest, 3rd Retest, Retracement, and Break.
Timeframe Specification: Choose between "Any Timeframe", "Timeframe 1", "Timeframe 2", or "Timeframe 3".
Trade Execution Filters: Restrict trades within specific trading sessions.
5. Exit Conditions for Long & Short Trades
Exit on Opposite Signal: Automatically exit trades upon opposite trade conditions.
Exit on Session End: Closes all positions at the end of the trading session.
Multiple Take-Profit (TP) and Stop-Loss (SL) Configurations:
TP/SL based on % move, ATR, Ticks, or Fixed Price.
Hard SL option for additional risk control.
Move SL to BE (Break Even) after a certain profit threshold.

Flux Charts - SFX Automation💎 GENERAL OVERVIEW
The SFX Automation is a powerful and versatile tool designed to help traders rigorously test their trading strategies against historical market data. With various advanced settings, traders can fine-tune their strategies, assess performance, and identify key improvements before deploying in live trading environments. This tool offers a wide range of configurable settings, explained within this write-up.
Features of the new SFX Automation :
Step By Step : Configure your strategy step by step, which will allow you to have OR & AND logic in your strategies.
Highly Configurable : Offers multiple parameters for fine-tuning trade entry and exit conditions.
Multi-Timeframe Analysis : Allows traders to analyze multiple timeframes simultaneously for enhanced accuracy.
Provides advanced stop-loss, take-profit, and break-even settings.
Incorporates Buy & Sell signals, with settings like Signal Sensitivity, Strength, Time Weighting, Dynamic TP & SL Methods and more for refined strategy execution.
🚩 UNIQUENESS
The SFX Automation stands out from conventional backtesting tools due to its unparalleled flexibility, precision, and advanced trading logic integration. Key factors that make it unique include:
✅ Comprehensive Strategy Customization – Unlike traditional backtesters that offer basic entry and exit conditions, SFX Automation provides a highly detailed parameter set, allowing traders to fine-tune their strategies with precision.
✅ Multi-Timeframe Signals – This is the first-ever tool that allows traders to backtest Buy & Sell Signals on multiple timeframes.
✅ Customizable Take-Profit Conditions – Offers various methods to set take-profit exits, including using core features from SFX Algo, and dynamic exits like signal rating upgrades/downgrades, enabling traders to tailor their exit strategies to specific market behaviors.
✅ Customizable Stop-Loss Conditions – Provides several ways to set up stop losses, including using concepts from SFX Algo and trailing stops or dynamic exits like signal rating upgrades/downgrades, allowing for dynamic risk management tailored to individual strategies.
✅ Integration of External Indicators – Allows the inclusion of other indicators or data sources from TradingView for creating strategy conditions, enabling traders to enhance their strategies with additional insights and data points.
By integrating these advanced features, SFX Automation ensures that traders can rigorously test and optimize their strategies with great accuracy and efficiency.
📌 HOW DOES IT WORK ?
The first setting you will want to set it the pyramiding setting. This setting controls the number of simultaneous trades in the same direction allowed in the strategy. For example, if you set it to 1, only one trade can be active in any time, and the second trade will not be entered unless the first one is exited. If it is set to 2, the script will handle both of them at the same time. Note that you should enter the same value to this pyramiding setting, and the pyramiding setting in the "Properties" tab of the script for this to work.
You can enable and set a backtesting window that will limit the entries to between the start date & end date.
Entry Conditions
From the "Long Conditions" or the "Short Conditions" groups, you can set your position entry conditions. For settings like "initial capital" or "order size", you can open the "Properties" tab, where these are handled.
The SFX Algo can use the following conditions for entry conditions :
1. Buy Signal (Any, or 1-5 ☆)
This condition is triggered when a Buy Signal occurs. Other timeframes are supported with this condition.
2. Buy | TP (1, 2 or 3)
This condition is triggered when a TP signal of any Buy signal occurs.
3. Buy | SL
This condition is triggered when a SL signal of any Buy signal occurs.
4. Buy | Rating Upgrade
This condition is triggered when the rating of a buy signal is increased.
5. Buy | Rating Downgrade
This condition is triggered when the rating of a buy signal is decreased.
6. Sell Signal (Any, or 1-5 ☆)
This condition is triggered when a Sell Signal occurs. Other timeframes are supported with this condition.
7. Sell | TP (1, 2 or 3)
This condition is triggered when a TP signal of any Sell signal occurs.
8. Sell | SL
This condition is triggered when a SL signal of any Sell signal occurs.
9. Sell | Rating Upgrade
This condition is triggered when the rating of a sell signal is increased.
10. Sell | Rating Downgrade
This condition is triggered when the rating of a sell signal is decreased.
11. Retracement Wave Retest (Bullish or Bearish)
A retest on the Retracement Wave occurs when the price temporarily moves against the prevailing trend, touching or entering the wave before continuing in the original trend direction. This retest serves as a confirmation that the wave is acting as dynamic support or resistance.
12. Retracement Wave Retracement (Bullish or Bearish)
A retracement on the Retracement Wave occurs when the price touches the wave, the condition is triggered immediately.
13. Volatility Bands Retest (Bullish or Bearish)
A retest of Volatility Bands occurs when the price initially moves beyond the bands, then pulls back to "retest" the band it just broke through before continuing its move. This can provide traders with confirmation of a breakout or signal a potential reversal.
14. Volatility Bands Retracement (Bullish or Bearish)
A retracement on the Volatility Bands occur when the price touches the band, the condition is triggered immediately.
🕒 TIMEFRAME CONDITIONS
The SFX Automation supports Multi-Timeframe (MTF) features for Buy & Sell signals. When setting an entry condition, you can also choose the timeframe.
External Conditions
Users can use external indicators on the chart to set entry conditions.
The second dropdown in the external condition settings allows you to choose a conditional operator to compare external outputs. Available options include:
Less Than or Equal To: <=
Less Than: <
Equal To: =
Greater Than: >
Greater Than or Equal To: >=
The position entry conditions work like this ;
Each side has 3 SFX Algo conditions and 2 Source conditions. Each condition can be enabled or disabled using the checkbox on the left side of them.
You can select which timeframe this condition should work on for Buy & Sell signals. If you select "Chart", the condition will work for the chart's current timeframe.
Lastly select the step of this condition from 1 to 6.
The Source Condition
The last condition on each side is a source condition that is different from the others. Using this condition, you can create your own logic using other indicators' outputs on your chart. For example, suppose that you have an EMA indicator in your chart. You can have the source condition to something like "EMA > high".
The Step System
Each condition has a step number, and conditions are in topological order based on them.
The conditions are executed step by step. This means the condition with step 2 cannot be executed before the condition with step 1 is executed.
Conditions with the same step numbers have "OR" logic. This means that if you have 2 conditions with step 3, the condition with step 4 can trigger after only one of the step 3 conditions is executed.
➕ OTHER ENTRY FEATURES
The SFX Automation allows traders to choose when to execute trades and when not to execute trades.
1. Only Take Trades
This setting lets users specify the time period when their strategy can open or execute trades.
2. Don't Take Trades
This setting lets users specify time periods when their strategy can't open or execute trades.
↩️ EXIT CONDITIONS
1. Exit on Opposite Signal
When enabled, a long position will close when short entry conditions are met, and a short position will close when long entry conditions are met.
2. Exit on Session End
When enabled, positions will be closed at the end of the trading session.
📈 TAKE PROFIT CONDITIONS
There are several methods available for setting take profit exits and conditions.
1. Entry Condition TP
Users can use entry conditions as triggers for take profit exits. This setting can be found under the long and short exit conditions.
2. Fixed TP
Users can set a fixed TP for exits. This setting can be found under the long and short exit conditions. Users can choose between the following:
Price: This method triggers a TP exit when price reaches a specified level. For example, if you set the Price TP to 10 and buy NASDAQ:TSLA at $190, the trade will automatically exit when the price reaches $200 ($190 + $10).
Ticks: This method triggers a TP exit when price moves a specified number of ticks.
Percentage (%): This method triggers a TP exit when price moves a specified percentage.
ATR: This method triggers a TP exit based on a specified multiple of the Average True Range (ATR).
🧩EXIT PERCENTAGES
For each 3 dynamic take-profit conditions, you can set the amount of the position to exit in terms of percentage. It's important to make sure that the total of the exit percentages are 100%.
📉 STOP LOSS CONDITIONS
There are several methods available for setting stop-loss exits and conditions.
1. Entry Condition SL
Users can use entry conditions as triggers for stop-loss exits. This setting can be found under the long and short exit conditions.
2. Fixed SL
Users can set a fixed SL for exits. This setting can be found under the long and short exit conditions. Users can choose between the following:
Price: This method triggers a SL exit when price reaches a specified level. For example, if you set the Price SL to 10 and buy NASDAQ:TSLA at $200, the trade will automatically exit when the price reaches $190 ($200 - $10).
Ticks: This method triggers a SL exit when price moves a specified number of ticks.
Percentage (%): This method triggers a SL exit when price moves a specified percentage.
ATR: This method triggers a SL exit based on a specified multiple of the Average True Range (ATR).
3. Trailing Stop
An explanation & example for the trailing stop feature is present on the write-up within the next section.
Exit conditions have the same logic of constructing conditions like the entry ones. You can construct a Take-Profit Condition & a Stop-Loss Condition. Note that the Take-Profit condition will only work if the position is in profit, regardless of if it's triggered or not. The same applies for the Stop-Loss condition, meaning that it will only work if the position is in loss.
You can also set a Fixed TP & Fixed SL based on the price movement after the position is entered. You have options like "Price", "Ticks", "%", or "Average True Range". For example, you can set a Fixed TP like "5%", and the position will be entered once it moves 5% up in a long position.
Trailing Stop
For the Fixed SL, you also have a "Trailing" stop option, which you can set it's activation level as well. The Trailing stop activation level and it's value are expressed in ticks. Check this scenerio for an example :
We have a ticker with a tick value of $1. Our Trailing Stop is set to 10 ticks, and the activation level is set to 30 ticks.
We buy 1 contract when the price is $100.
When the price becomes $110, we are in $10 (10 ticks) profit and the trailing stop is now activated.
The current price our stop's on is $110 - $30 (30 ticks), which is the level of $80.
The trailing stop will only move if the price moves up the highest high the price has been after we entered the position.
Let's suppose that price moves up $40 right after our trailing stop is activated. The price will now be $150, and our trailing stop will sit on $150 - $30 (30 ticks) = $120.
If the price is down the $120 level, our stop loss will be triggered.
There is also a "Hard SL" option designed for a backup stop-loss when trailing stops are enabled. You can enable & set this option and if the price goes down before our trailing stop even activates, the position will be exited.
You can also move stop-loss to the break-even (entry price of the position) after a certain profit is achieved using the last setting of the exit conditions. Note that for this to work, you will need to have a Fixed SL setup.
➕ OTHER EXIT FEATURES
1. Move Stop Loss to Breakeven
This setting allows the strategy to automatically move the SL to Breakeven (BE) when the position is in profit by a certain amount. Users can choose between the following:
Price: This method moves the SL to BE when price reaches a specified level.
Ticks: This method moves the SL to BE when price moves a specified number of ticks.
Percentage (%): This method moves the SL to BE when price moves a specified percentage.
ATR: This method moves the SL to BE when price moves a specified multiple of the Average True Range (ATR).
Example Entry Scenario
To give an example , check this scenario; out conditions are :
LONG CONDITIONS
Buy Signal Any☆, Step 1
Bullish R. Wave Retest, Step 2
Bullish V. Bands Retest, Step 2
open > close, Step 3
First, the strategy needs to detect a Buy Signal with any star rating in order to start working.
After it's detected, now it's looking for either a Bullish R. Wave Retest, or a Bullish V. Bands Retest to proceed to the next step, the reason for this is that they both have the same step number.
After one of them is detected, the strategy will consistently check candlesticks for the condition open > close. If a bullish candlestick occurs, a long position will be entered.
⏰ ALERTS
This indicator uses TradingView's strategy alert system. All entries and exits will be sent as an alert if configured. It's possible to further customize these alerts to your liking. For more information, check TradingView's strategy alert customization page: www.tradingview.com
⚙️ SETTINGS
1. Backtesting Settings
Pyramiding: Controls the number of simultaneous trades allowed in the strategy. This setting must have the same value that is entered on the script's properties tab on the settings pane.
Enable Custom Backtesting Period: Restricts backtesting to a specific date range.
Start & End Time Configuration: Define precise start and end dates for historical analysis.
2. Algorithm Settings
Sensitivity: The sensitivity setting is a key parameter that influences the number of signals the SFX Algo generates. By adjusting this parameter, you can control the frequency of signals produced by the algorithm.
Signal Strength: The Signal Strength setting filters signals based on their quality, allowing traders to focus on the most reliable opportunities. This feature helps traders balance the quantity and reliability of the algorithm’s signals to suit their trading strategy.
Time Weighting: The Time Weighting setting determines how the SFX Algo evaluates historical market data to generate signals.
a) Recent Trends
Focuses on the most recent movements for short-term analysis. This setting is good for scalpers and intraday traders who need to react quickly to market changes.
b) Mixed Trends
Balances recent and historical price movements for a comprehensive market view. This setting is well-suited for swing traders and those who want to capture medium-term opportunities by combining the benefits of short-term responsiveness with the reliability of long-term trends.
c) Long-term Trends
Relies on extended historical market data to identify broader market trends, making it an excellent choice for traders focused on long-term strategies.
Minimum Star Rating: The Minimum Star Rating setting allows you to filter signals based on their strength, showing only those that meet or exceed your chosen threshold. For instance, setting the minimum star rating to 3 ensures you only receive signals with a rating of 3 stars or higher.
3. Take Profit / Stop Loss Methods
Key Levels
The Key Levels method uses pivot points to set take profit and stop-loss levels. The TP and SL levels are shown when a new signal is generated.
Volatility Bands
This TP/SL method uses the Volatility Bands overlay to set dynamic TP and SL levels. These levels are not predetermined so they will not be shown in advance when a signal is generated.
Signal Rating
Sets take profit and stop-loss levels based on changes in a signal's rating strength. These levels are not predetermined so they will not be shown in advance when a signal is generated.
Auto Stop-Loss
The auto method can only be applied to the SL. The auto method allows the algorithm to detect SL automatically when a momentum shift is detected. You can adjust the risk tolerance of the Auto SL by adjusting the ‘Auto Risk Tolerance’ setting. You can choose between Low, Medium, and High. A high-risk tolerance will result in stop losses being triggered less often.
4. Entry Conditions for Long & Short Trades
Multiple Conditions (1-6): Configure up to six independent conditions per trade direction.
Timeframe Specification: Choose between timeframes for Buy & Sell signals.
Trade Execution Filters: Restrict trades within specific trading sessions.
5. Exit Conditions for Long & Short Trades
Exit on Opposite Signal: Automatically exit trades upon opposite trade conditions.
Exit on Session End: Closes all positions at the end of the trading session.
Multiple Take-Profit (TP) and Stop-Loss (SL) Configurations:
TP/SL based on % move, ATR, Ticks, or Fixed Price.
Hard SL option for additional risk control.
Move SL to BE (Break Even) after a certain profit threshold.

highs&lowsone of my first strategy: highs&lows
This strategy takes the highest high and the lowest low of a specified timeframe and specified bar count.
It will then takes the average between these two extremes to create a center line.
This creates a range of high middle and low.
Then the strategy takes the current market movement
which is the direct average(no specified timeframe and specified bar count) of the current high and low.
Using this "current market movement" within the range of high middle and low it determins when to buy and then sell the asset.
*********note***************
-this strategy is (bullish)
-works good with most futures assets that have volatility/ decent movement
(might add more details if I forget any)
(work in progress)

3x Supertrend (for Vietnamese stock market and vn30f1m)The 4Vietnamese 3x Supertrend Strategy is an advanced trend-following trading system developed in Pine Script™ and designed for publication on TradingView as an open-source strategy under the Mozilla Public License 2.0. This strategy leverages three Supertrend indicators with different ATR lengths and multipliers to identify optimal trade entries and exits while dynamically managing risk.
Key Features:
Option to build and hold long term positions with entry stop order. Try this to avoid market complex movement and retain long term investment style's benefits.
Advanced Entry & Exit Optimization: Includes configurable stop-loss mechanisms, pyramiding, and exit conditions tailored for different market scenarios.
Dynamic Risk Management: Implements features like selective stop-loss activation, trade window settings, and closing conditions based on trend reversals and loss management.
This strategy is particularly suited for traders seeking a systematic and rule-based approach to trend trading. By making it open-source, we aim to provide transparency, encourage community collaboration, and help traders refine and optimize their strategies for better performance.
License:
This script is released under the Mozilla Public License 2.0, allowing modifications and redistribution while maintaining open-source integrity.
Happy trading!

Statistical Arbitrage Pairs Trading - Long-Side OnlyThis strategy implements a simplified statistical arbitrage (" stat arb ") approach focused on mean reversion between two correlated instruments. It identifies opportunities where the spread between their normalized price series (Z-scores) deviates significantly from historical norms, then executes long-only trades anticipating reversion to the mean.
Key Mechanics:
1. Spread Calculation: The strategy computes Z-scores for both instruments to normalize price movements, then tracks the spread between these Z-scores.
2. Modified Z-Score: Uses a robust measure combining the median and Median Absolute Deviation (MAD) to reduce outlier sensitivity.
3. Entry Signal: A long position is triggered when the spread’s modified Z-score falls below a user-defined threshold (e.g., -1.0), indicating extreme undervaluation of the main instrument relative to its pair.
4. Exit Signal: The position closes automatically when the spread reverts to its historical mean (Z-score ≥ 0).
Risk management:
Trades are sized as a percentage of equity (default: 10%).
Includes commissions and slippage for realistic backtesting.

Tutorial - Adding sessions to strategiesA simple script to illustrate how to add sessions to trading strategies.
In this interactive tutorial, you'll learn how to add trading sessions to your strategies using Pine Script. By the end of this session (pun intended!), you'll be able to create custom trading windows that adapt to changing market conditions.
What You'll Learn:
Defining Trading Sessions: Understand how to set up specific time frames for buying and selling, tailored to your unique trading style.
RSI-Based Entry Signals: Discover how to use the Relative Strength Index (RSI) as a trigger for buy and sell signals, helping you capitalize on market trends.
Combining Session Logic with Trading Decisions: Learn how to integrate session-based logic into your strategy, ensuring that trades are executed only during designated times.
By combining these elements, we create an interactive strategy that:
1. Generates buy and sell signals based on RSI levels.
2. Checks if the market is open during a specific trading session (e.g., 1300-1700).
3. Executes trades only when both conditions are met.
**Tips & Variations:**
* Experiment with different RSI periods, thresholds, and sessions to optimize your strategy for various markets and time frames.
* Consider adding more advanced logic, such as stop-losses or position sizing, to further refine your trading approach.
Get ready to take your Pine Script skills to the next level!
~Description partially generated with Llama3_8B
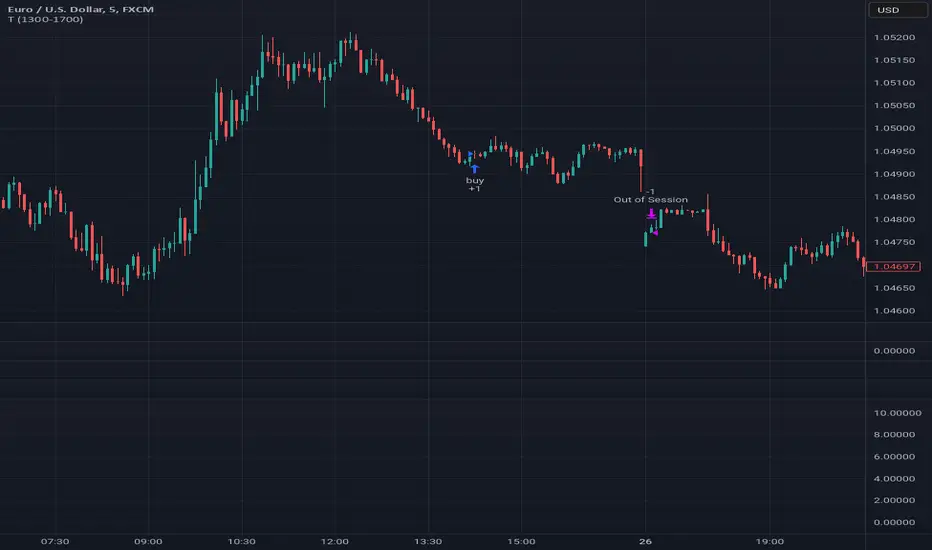
Mean Reversion Pro Strategy [tradeviZion]Mean Reversion Pro Strategy : User Guide
A mean reversion trading strategy for daily timeframe trading.
Introduction
Mean Reversion Pro Strategy is a technical trading system that operates on the daily timeframe. The strategy uses a dual Simple Moving Average (SMA) system combined with price range analysis to identify potential trading opportunities. It can be used on major indices and other markets with sufficient liquidity.
The strategy includes:
Trading System
Fast SMA for entry/exit points (5, 10, 15, 20 periods)
Slow SMA for trend reference (100, 200 periods)
Price range analysis (20% threshold)
Position management rules
Visual Elements
Gradient color indicators
Three themes (Dark/Light/Custom)
ATR-based visuals
Signal zones
Status Table
Current position information
Basic performance metrics
Strategy parameters
Optional messages
📊 Strategy Settings
Main Settings
Trading Mode
Options: Long Only, Short Only, Both
Default: Long Only
Position Size: 10% of equity
Starting Capital: $20,000
Moving Averages
Fast SMA: 5, 10, 15, or 20 periods
Slow SMA: 100 or 200 periods
Default: Fast=5, Slow=100
🎯 Entry and Exit Rules
Long Entry Conditions
All conditions must be met:
Price below Fast SMA
Price below 20% of current bar's range
Price above Slow SMA
No existing position
Short Entry Conditions
All conditions must be met:
Price above Fast SMA
Price above 80% of current bar's range
Price below Slow SMA
No existing position
Exit Rules
Long Positions
Exit when price crosses above Fast SMA
No fixed take-profit levels
No stop-loss (mean reversion approach)
Short Positions
Exit when price crosses below Fast SMA
No fixed take-profit levels
No stop-loss (mean reversion approach)
💼 Risk Management
Position Sizing
Default: 10% of equity per trade
Initial capital: $20,000
Commission: 0.01%
Slippage: 2 points
Maximum one position at a time
Risk Control
Use daily timeframe only
Avoid trading during major news events
Consider market conditions
Monitor overall exposure
📊 Performance Dashboard
The strategy includes a comprehensive status table displaying:
Strategy Parameters
Current SMA settings
Trading direction
Fast/Slow SMA ratio
Current Status
Active position (Flat/Long/Short)
Current price with color coding
Position status indicators
Performance Metrics
Net Profit (USD and %)
Win Rate with color grading
Profit Factor with thresholds
Maximum Drawdown percentage
Average Trade value
📱 Alert Settings
Entry Alerts
Long Entry (Buy Signal)
Short Entry (Sell Signal)
Exit Alerts
Long Exit (Take Profit)
Short Exit (Take Profit)
Alert Message Format
Strategy name
Signal type and direction
Current price
Fast SMA value
Slow SMA value
💡 Usage Tips
Consider starting with Long Only mode
Begin with default settings
Keep track of your trades
Review results regularly
Adjust settings as needed
Follow your trading plan
⚠️ Disclaimer
This strategy is for educational and informational purposes only. It is not financial advice. Always:
Conduct your own research
Test thoroughly before live trading
Use proper risk management
Consider your trading goals
Monitor market conditions
Never risk more than you can afford to lose
📋 Release Notes
14 January 2025
Added New Fast & Slow SMA Options:
Fibonacci-based periods: 8, 13, 21, 144, 233, 377
Additional period: 50
Complete Fast SMA options now: 5, 8, 10, 13, 15, 20, 21, 34, 50
Complete Slow SMA options now: 100, 144, 200, 233, 377
Bug Fixes:
Fixed Maximum Drawdown calculation in the performance table
Now using strategy.max_drawdown_percent for accurate DD reporting
Previous version showed incorrect DD values
Performance metrics now accurately reflect trading results
Performance Note:
Strategy tested with Fast/Slow SMA 13/377
Test conducted with 10% equity risk allocation
Daily Timeframe
For Beginners - How to Modify SMA Levels:
Find this line in the code:
fastLength = input.int(title="Fast SMA Length", defval=5, options= )
To add a new Fast SMA period: Add the number to the options list, e.g.,
To remove a Fast SMA period: Remove the number from the options list
For Slow SMA, find:
slowLength = input.int(title="Slow SMA Length", defval=100, options= )
Modify the options list the same way
⚠️ Note: Keep the periods that make sense for your trading timeframe
💡 Tip: Test any new combinations thoroughly before live trading
"Trade with Discipline, Manage Risk, Stay Consistent" - tradeviZion
