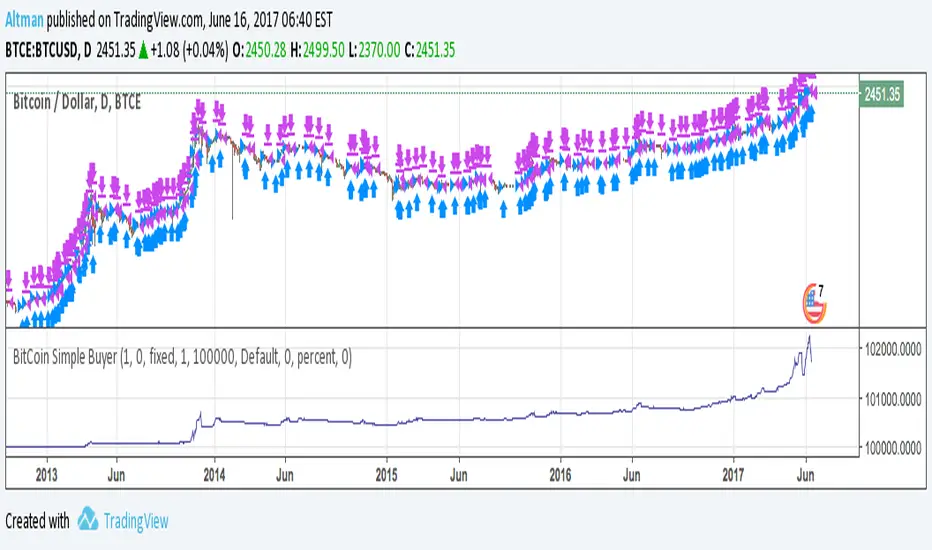
BitCoin Simple BuyerMany people asking me: How to find the right time to exit BitCoin long position? First, that comes to mind is Do Not use simple Buy-and-Hold strategy, but make short-term trades. Here is the simple algorithm for D1 or 4H timeframes.
Strategy!
Gann Trend Oscillator Strategy The Gann Swing Oscillator has been adapted from Robert Krausz's book,
"A W.D. Gann Treasure Discovered". The Gann Swing Oscillator helps
define market swings.

Gann Swing Oscillator The Gann Swing Oscillator has been adapted from Robert Krausz's book,
"A W.D. Gann Treasure Discovered". The Gann Swing Oscillator helps
define market swings.
You can change long to short in the Input Settings
Please, use it only for learning or paper trading. Do not for real trading.

Gann Swing Oscillator Strategy The Gann Swing Oscillator has been adapted from Robert Krausz's book,
"A W.D. Gann Treasure Discovered". The Gann Swing Oscillator helps
define market swings.

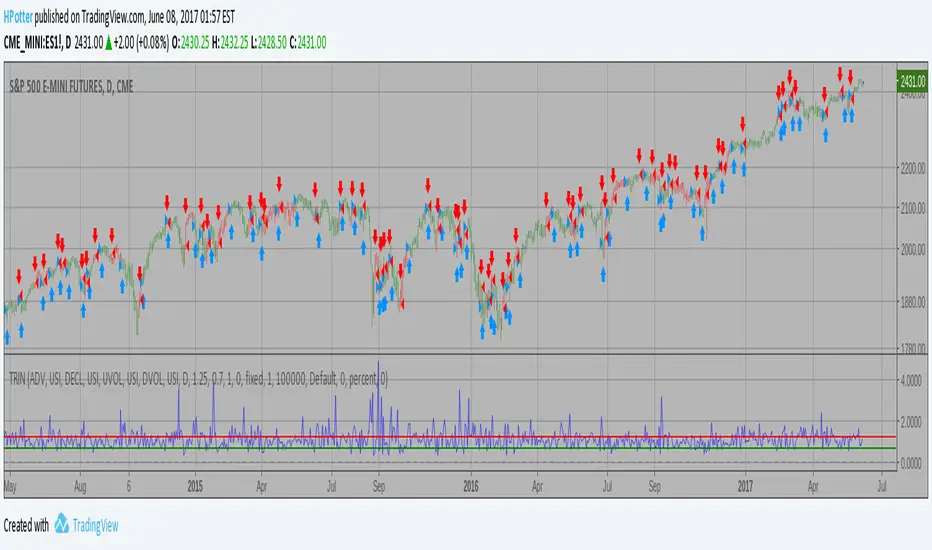
Arms Index (TRIN) Backtest The Arms index (TRIN) is a technical analysis indicator that compares advancing
and declining stock issues and trading volume as an indicator of overall market
sentiment. It measures the relationship between market supply and demand and is
used as a predictor of future price movements in the market, primarily on an
intraday basis. The Arms index seeks to provide a more dynamic explanation of
overall movements in the composite value of stock exchanges, such as the NYSE or
NASDAQ, by analyzing the strength and breadth of these movements.
You can change long to short in the Input Settings
Please, use it only for learning or paper trading. Do not for real trading.
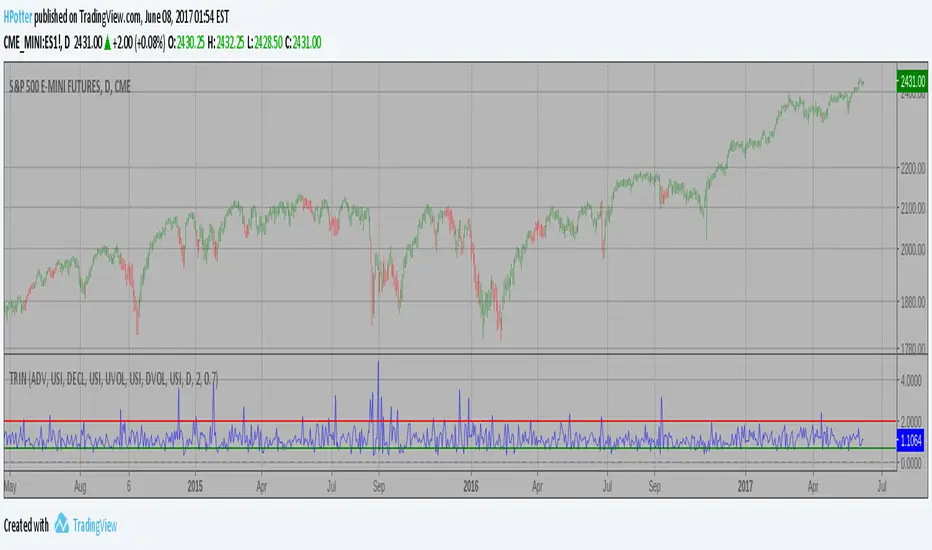
Arms Index (TRIN) Strategy The Arms index (TRIN) is a technical analysis indicator that compares advancing
and declining stock issues and trading volume as an indicator of overall market
sentiment. It measures the relationship between market supply and demand and is
used as a predictor of future price movements in the market, primarily on an
intraday basis. The Arms index seeks to provide a more dynamic explanation of
overall movements in the composite value of stock exchanges, such as the NYSE or
NASDAQ, by analyzing the strength and breadth of these movements.
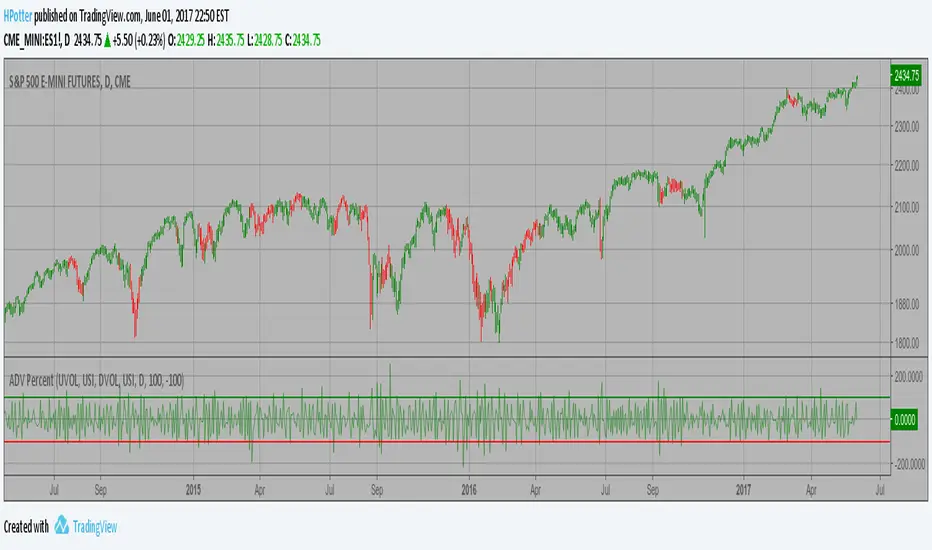
Advance-Decline Volume Percent Backtest Advance-Decline Volume Percent (AD Volume Percent) is a breadth indicator
that measures the percentage of Net Advancing Volume for a particular group
of stocks, such as an index or ETF. Net Advancing Volume equals the volume
of advances less the volume of declines. AD Volume Percent equals Net Advancing
Volume divided by total volume for the group. AD Volume Percent fluctuates
between -100% and +100%.
You can change long to short in the Input Settings
Please, use it only for learning or paper trading. Do not for real trading

Advance-Decline Volume Percent Advance-Decline Volume Percent (AD Volume Percent) is a breadth indicator
that measures the percentage of Net Advancing Volume for a particular group
of stocks, such as an index or ETF. Net Advancing Volume equals the volume
of advances less the volume of declines. AD Volume Percent equals Net Advancing
Volume divided by total volume for the group. AD Volume Percent fluctuates
between -100% and +100%.
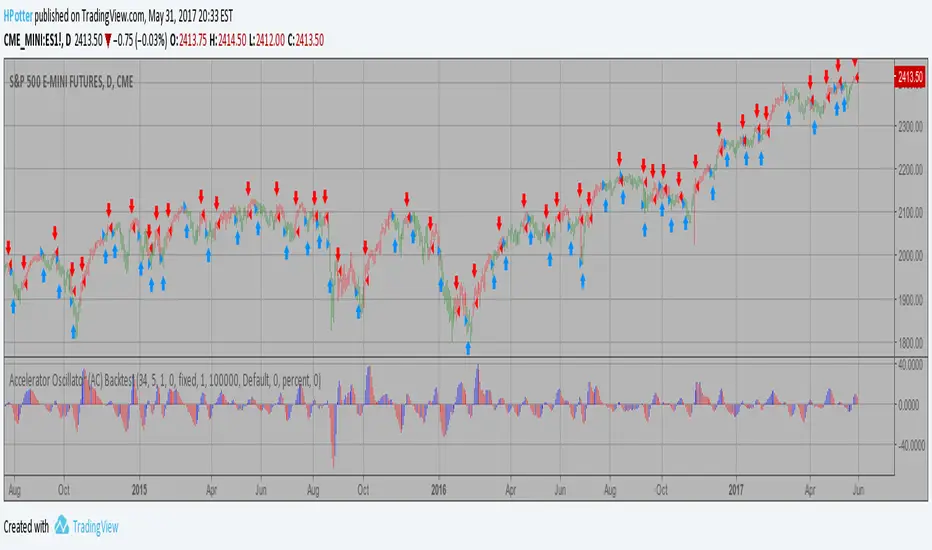
Accelerator Oscillator (AC) Backtest The Accelerator Oscillator has been developed by Bill Williams
as the development of the Awesome Oscillator. It represents the
difference between the Awesome Oscillator and the 5-period moving
average, and as such it shows the speed of change of the Awesome
Oscillator, which can be useful to find trend reversals before the
Awesome Oscillator does.
You can change long to short in the Input Settings
Please, use it only for learning or paper trading. Do not for real trading
Accelerator Oscillator (AC) Strategy The Accelerator Oscillator has been developed by Bill Williams
as the development of the Awesome Oscillator. It represents the
difference between the Awesome Oscillator and the 5-period moving
average, and as such it shows the speed of change of the Awesome
Oscillator, which can be useful to find trend reversals before the
Awesome Oscillator does.

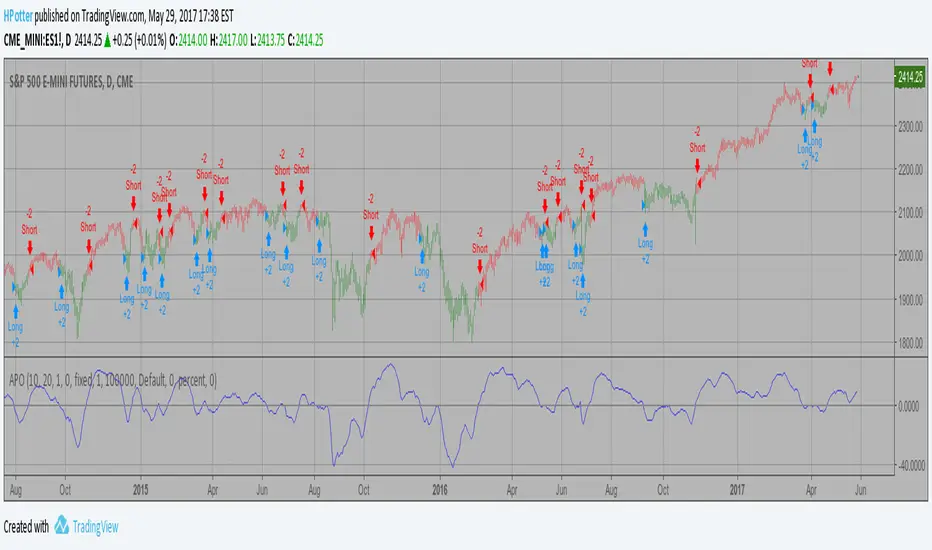
Absolute Price Oscillator (APO) Backtest The Absolute Price Oscillator displays the difference between two exponential
moving averages of a security's price and is expressed as an absolute value.
How this indicator works
APO crossing above zero is considered bullish, while crossing below zero is bearish.
A positive indicator value indicates an upward movement, while negative readings
signal a downward trend.
Divergences form when a new high or low in price is not confirmed by the Absolute Price
Oscillator (APO). A bullish divergence forms when price make a lower low, but the APO
forms a higher low. This indicates less downward momentum that could foreshadow a bullish
reversal. A bearish divergence forms when price makes a higher high, but the APO forms a
lower high. This shows less upward momentum that could foreshadow a bearish reversal.
You can change long to short in the Input Settings
Please, use it only for learning or paper trading. Do not for real trading.
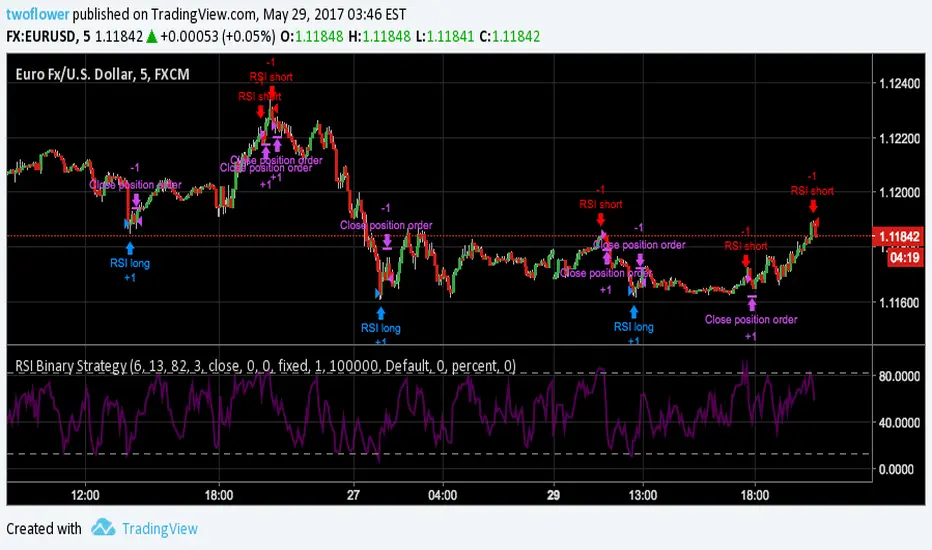
RSI Binary StrategyAnother basic strategy most people learn at the beginning of their trading carreer (like me) is the RSI strategy. This is an adaptation of the built-in RSI strategy for use in binary options. Who knows, maybe one day i will graduate to CFD trading, but my time for trading in general is limited at the moment and I am very much still at the beginning of this entire topic.
The rather specific values for the RSI bounds and length I saved have been developed for the EURUSD short term (5min.) interval, giving the highest amount of winning vs. loosing trades as of the publishing date of this script, which is the only important factor for binary options in my understanding. Use at your own risk.
Feel free to comment, give me pointers and/or recommendations.
Absolute Price Oscillator (APO) The Absolute Price Oscillator displays the difference between two exponential
moving averages of a security's price and is expressed as an absolute value.
How this indicator works
APO crossing above zero is considered bullish, while crossing below zero is bearish.
A positive indicator value indicates an upward movement, while negative readings
signal a downward trend.
Divergences form when a new high or low in price is not confirmed by the Absolute Price
Oscillator (APO). A bullish divergence forms when price make a lower low, but the APO
forms a higher low. This indicates less downward momentum that could foreshadow a bullish
reversal. A bearish divergence forms when price makes a higher high, but the APO forms a
lower high. This shows less upward momentum that could foreshadow a bearish reversal.

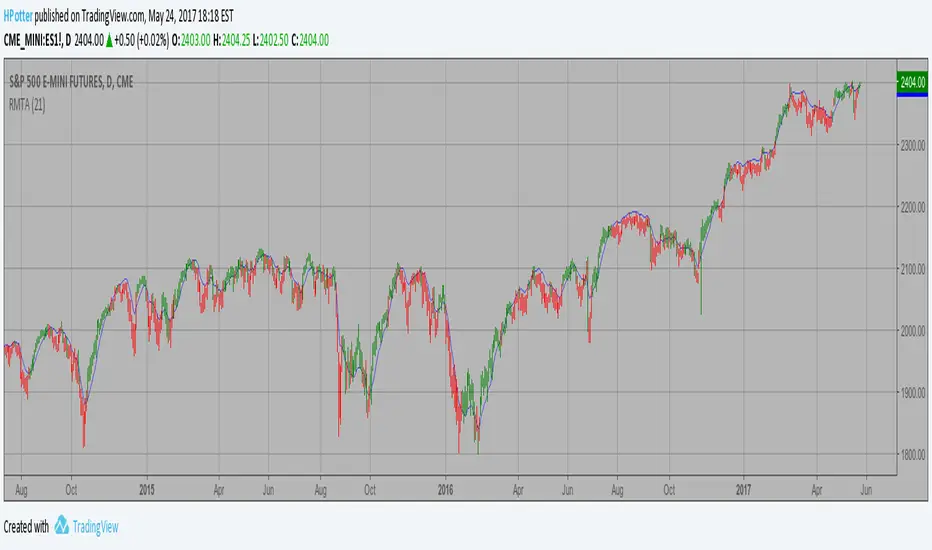
Recursive Moving Trend Average Taken from an article "The Yen Recused" in the December 1998 issue of TASC,
written by Dennis Meyers. He describes the Recursive MA in mathematical terms
as "recursive polynomial fit, a technique that uses a small number of past values
of the estimated price and today's price to predict tomorrows price."
Red bars color - short position. Green is long.
You can change long to short in the Input Settings
Please, use it only for learning or paper trading. Do not for real trading.

Juiced Ichimoku StratI saw this indicator and thought I'd try to make it into a script. I can't get an exit when the EMA is between signal lines so it's a long/short strategy until I can figure that part out.

Recursive Moving Trend Average Strategy Taken from an article "The Yen Recused" in the December 1998 issue of TASC,
written by Dennis Meyers. He describes the Recursive MA in mathematical terms
as "recursive polynomial fit, a technique that uses a small number of past values
of the estimated price and today's price to predict tomorrows price."
Red bars color - short position. Green is long.
Glory Hole with SMA + ADX - StrategyHere you get a script with the rules for "Glory Hole"-Strategy from Linda Raschke.
In Addition, I choose the SMA - not the EMA for this script.
MY RECOMMONDATION:
If you get a trade Signal, then set an sell- oder buy-order on the high or low. If the next bar doesn't touch into the trade, then delete your order.
Have fun and good look.

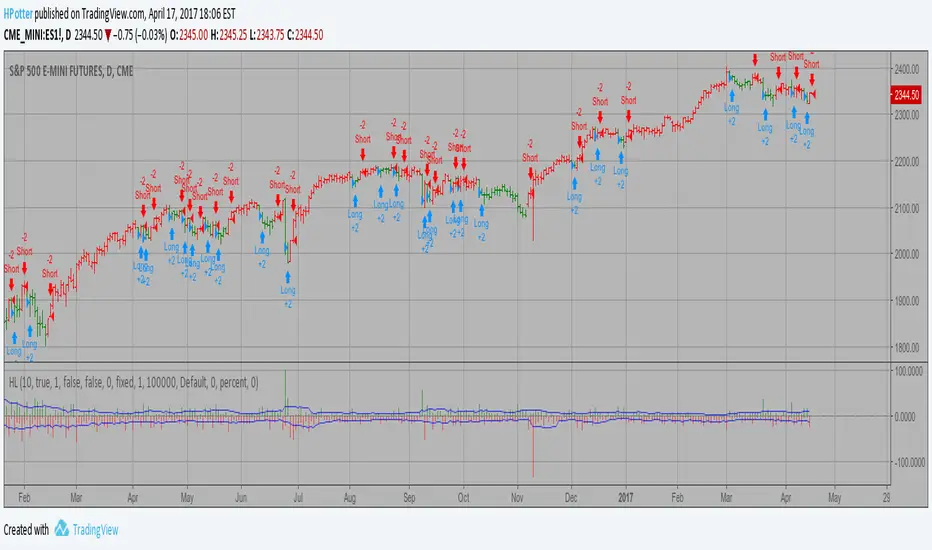
HiLoHi Everyone,
Do you guys know how can I add an exit strategy to this hilo.
I would like it to exit either with hilo invertion (already does) or with profit/loss (it doesn't work)
Thank you

Indecision Candle IdentifierThis script helps identify indecision candles on for better entries into trade reversals. Note that I don't believe this signal/indicator should be used as a sole basis for entering/exiting a trade. This is simply to help you have an edge in terms of your chart/candle analysis when your brain fails to keep up with your trades.

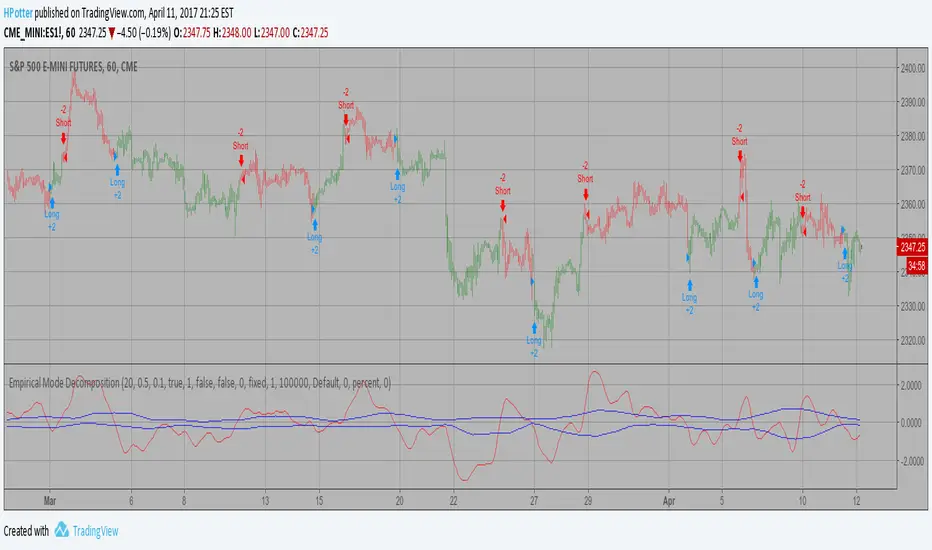
Empirical Mode Decomposition Strategy Backtest The related article is copyrighted material from Stocks & Commodities Mar 2010
You can use in the xPrice any series: Open, High, Low, Close, HL2, HLC3, OHLC4 and ect...
You can change long to short in the Input Settings
Please, use it only for learning or paper trading. Do not for real trading.
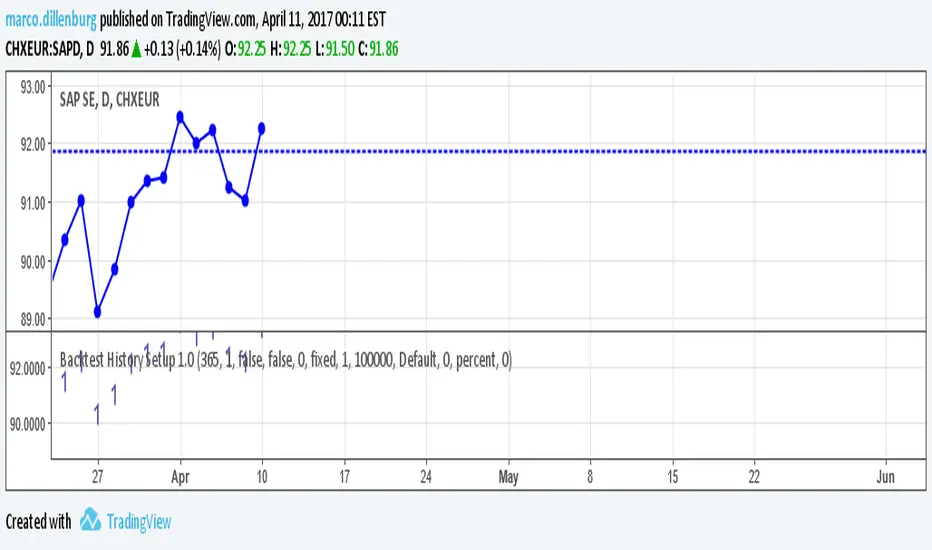
Backtest History Setup 1.0Script of strategy component to setup the backtext lookback. You setup the maximum days back in the history, which will be used for backtest.
Empirical Mode Decomposition Strategy The related article is copyrighted material from Stocks & Commodities Mar 2010
You can use in the xPrice any series: Open, High, Low, Close, HL2, HLC3, OHLC4 and ect...
