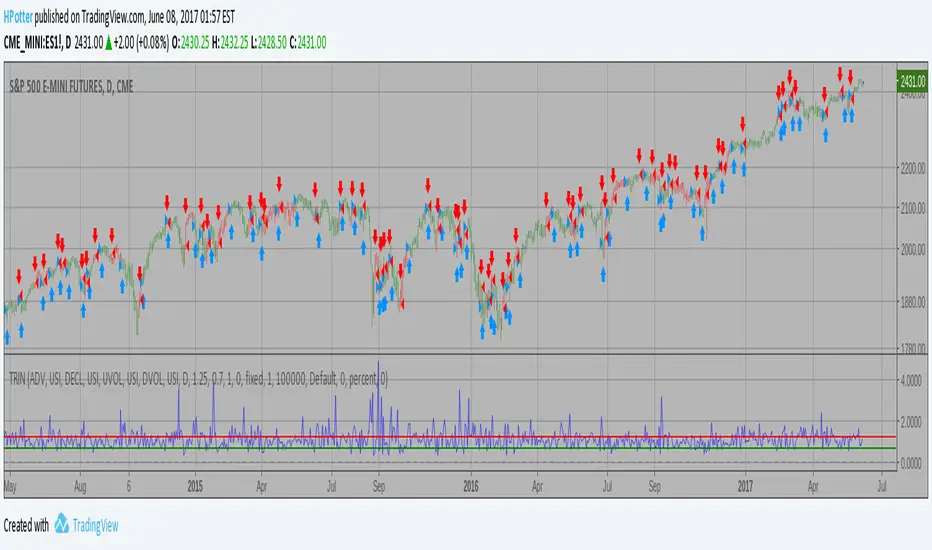
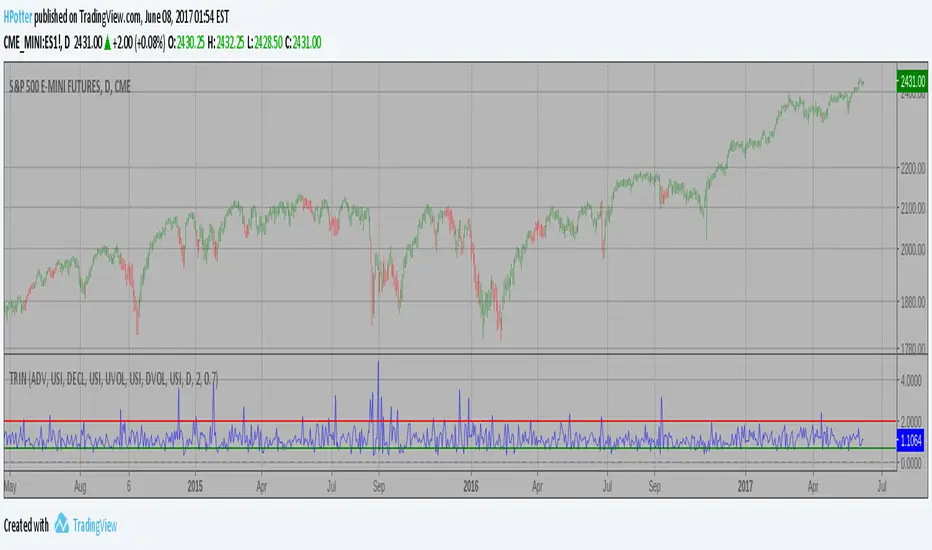
Arms Index (TRIN) Backtest The Arms index (TRIN) is a technical analysis indicator that compares advancing
and declining stock issues and trading volume as an indicator of overall market
sentiment. It measures the relationship between market supply and demand and is
used as a predictor of future price movements in the market, primarily on an
intraday basis. The Arms index seeks to provide a more dynamic explanation of
overall movements in the composite value of stock exchanges, such as the NYSE or
NASDAQ, by analyzing the strength and breadth of these movements.
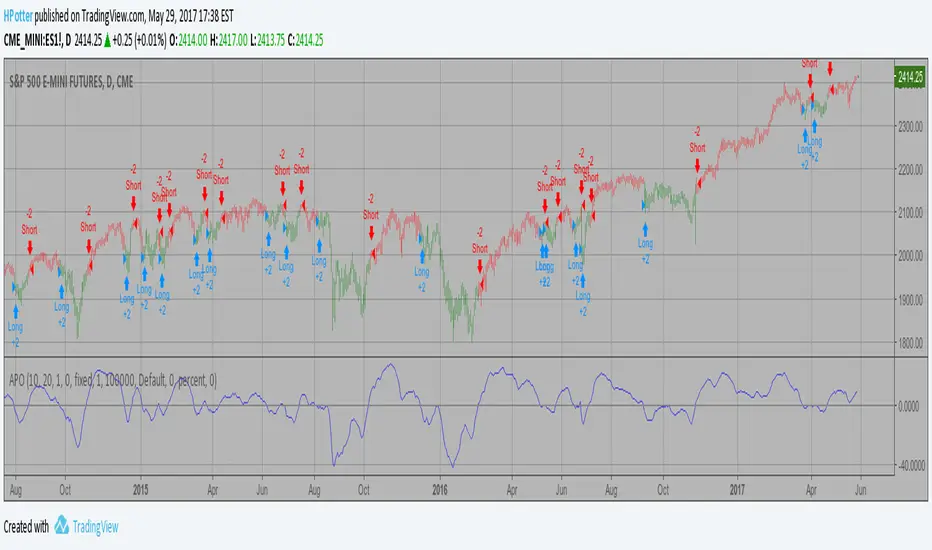
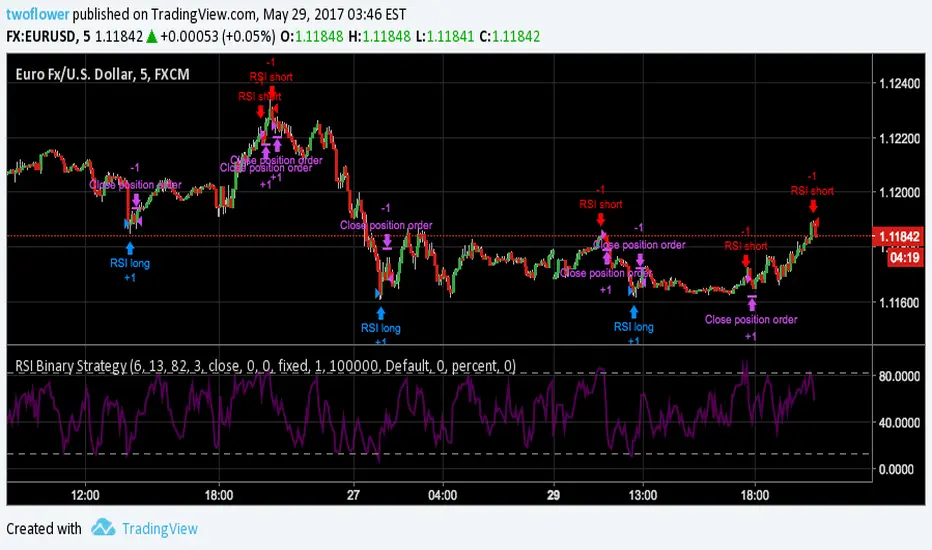
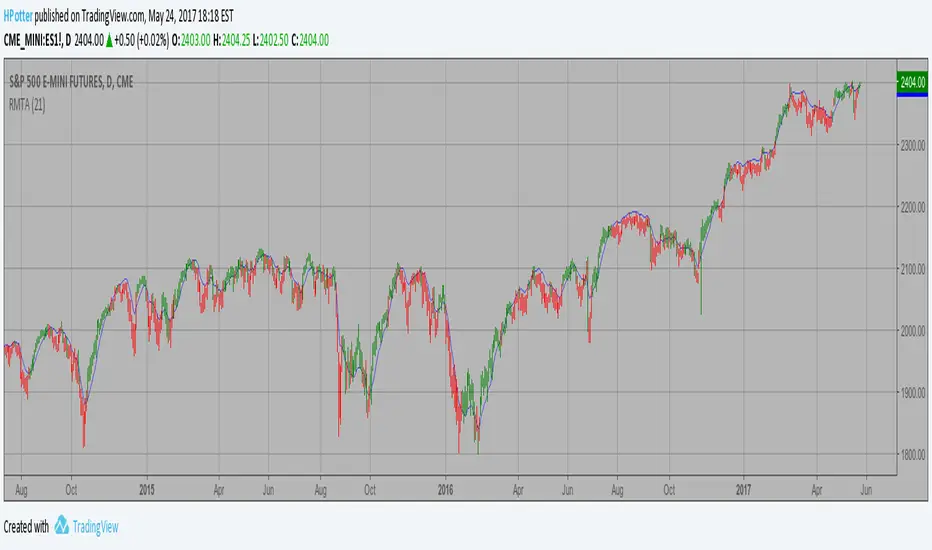
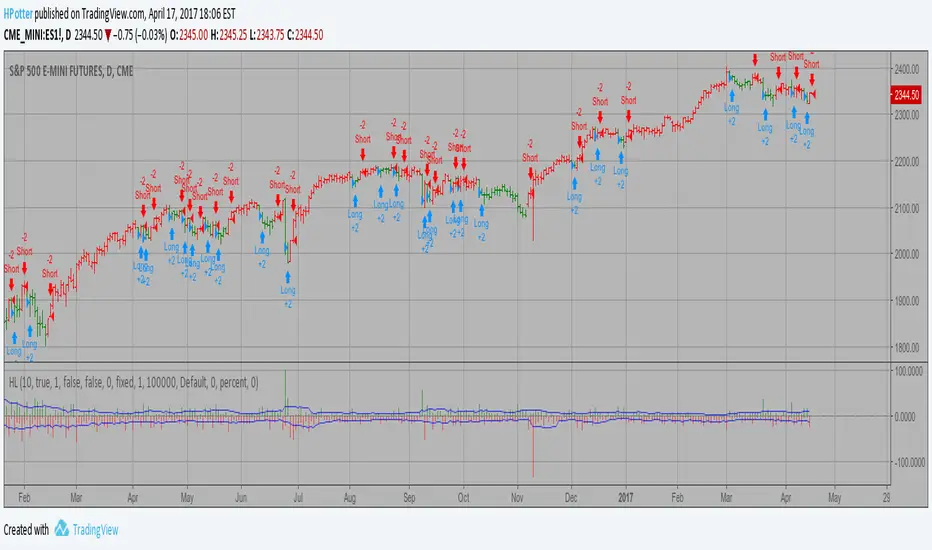
You can change long to short in the Input Settings
Please, use it only for learning or paper trading. Do not for real trading.
Strategi Pine Script®