Absolute ZigZagThis ZigZag Indicator is a bit unique in it's kind.
It uses my own Absolute ZigZag Lib to calculate the pivots:
Instead of using percentages or looking more than 1 bar left or right, this Zigzag library calculates pivots by just looking at the current bar highs and lows and the ones of one bar earlier. This is a very fast and accurate way of calculating pivots.
The library also features a solution for bars that have both a higher high and a higher low like seen below.
You can also use your own colors for the labels and the lines:
You can also quickly select a one-colored theme without changing all colors at once:
Structure

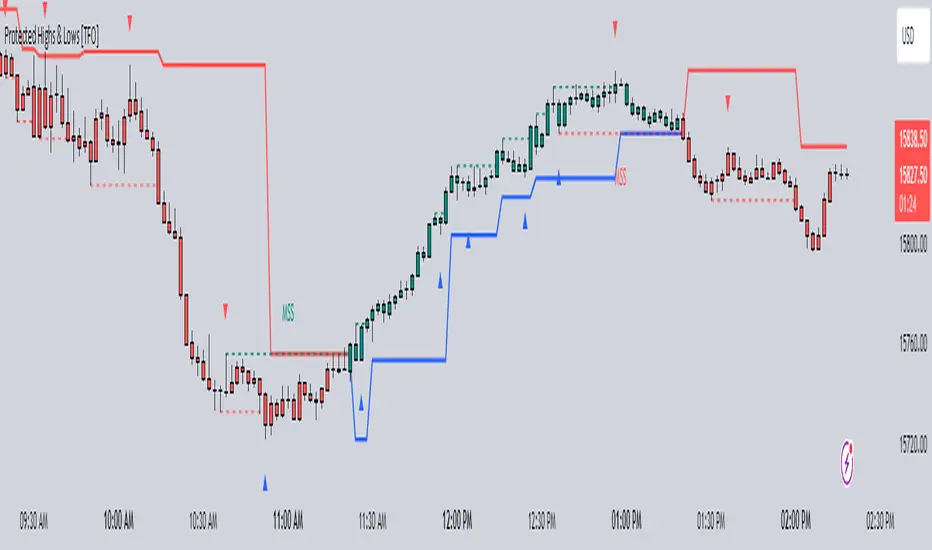
Protected Highs & Lows [TFO]This indicator presents an alternative approach to identify Market Structure. The logic used is derived from learning material created by @DaveTeaches
When quantifying Market Structure, it is common to use fractal highs and lows to identify "significant" swing pivots. When price closes through these pivots, we may identify a Market Structure Shift (MSS) for reversals or a Break of Structure (BOS) for continuations. The main difference with this "protected" logic is in how we determine the pivots/levels that are utilized to determine a valid MSS or BOS.
Nonetheless, the significance of our swing pivots is still governed by the input Pivot Strength parameter, which requires valid swing pivots to be compared to this many bars to the left and right of them. This is an optional parameter as it is traditionally set to 1 by default.
When identifying a BOS: When price closes below a valid swing low, we look back from the current bar to find the highest high that was made in that range. This becomes our protected high; similarly, when price closes above a valid swing high, we look back from the current bar to find the lowest low that was made in that range, which then becomes our protected low.
Note these valid highs and lows are the first swing pivots created after a MSS/BOS. For example, when price makes a bullish BOS/MSS and then trades away, a swing high is formed. This first swing high is what needs to be traded through to see a valid BOS.
When identifying a MSS: If the current trend is bearish and we're looking for a bullish reversal, we would need price to close above the most recent protected high. When this happens, we still look back to find the lowest low that was created in that range, and make that our new protected low. Likewise when looking for a bearish reversal, price would need to close below the most recent protected low, which would then give us a new protected high as a result (the highest point in that range).
The Trend Candles option allows users to easily visualize the current state of Market Structure with bullish and bearish colors. Users may also show BOS and MSS labels if desired.
Show Protected Highs & Lows will annotate the protected highs and lows, just note that the labels themselves are plotted in the past due to the lookback function required to identify them.
Lastly, the Show Protected Trail option will draw a line to essentially indicate a trailing stop-like line to denote the most recent protected low (if bullish) or protected high (if bearish).
I am simply a student of Dave's concepts, so please feel free to leave feedback if you are familiar with his concepts and have suggestions/improvements.
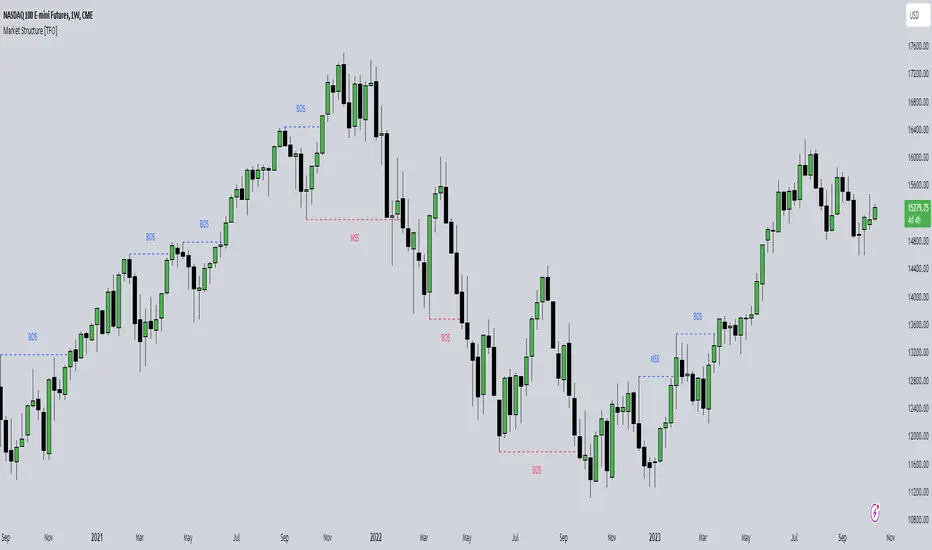
Market Structure [TFO]The purpose of this indicator is to provide a simple approach to Market Structure. When price is closing over swing highs, we may categorize that as bullish structure; and when price is closing below swing lows, we may categorize that as bearish structure.
We can easily find swing highs and lows via the following built-in Pine Script functions:
ta.pivothigh()
ta.pivotlow()
We can pass in our Pivot Strength parameter to determine the size/significance of these pivots. The lowest value of 1 will validate a swing high when a given high is larger than that of 1 bar to the left and right of it. A pivot strength of 3, for example, would validate a swing high only when a high is larger than that of the 3 bars to the left and right of it, making it much more selective.
In any case, we can simply track the most recent swing highs and lows and check for when price through them. Enabling the Show Pivots option will mark all the swing highs and lows that are being considered for future structure breaks.
If the trend is bearish and we begin closing over swing highs, that would mark a Market Structure Shift (MSS). If the trend is already bullish and we are closing over swing highs, that would mark a Break of Structure (BOS), and vice versa for bearish conditions. MSS essentially signifies reversals in Market Structure while BOS signifies continuations.
Users may also create alerts for Any/Bull/Bear BOS or MSS. Simply create a new alert, select this indicator, and select the desired BOS or MSS criteria.
Smart money conceptThe indicator tracks the smallest movements of price action. It can monitor and analyze market context, attempting to identify trends within each time frame.
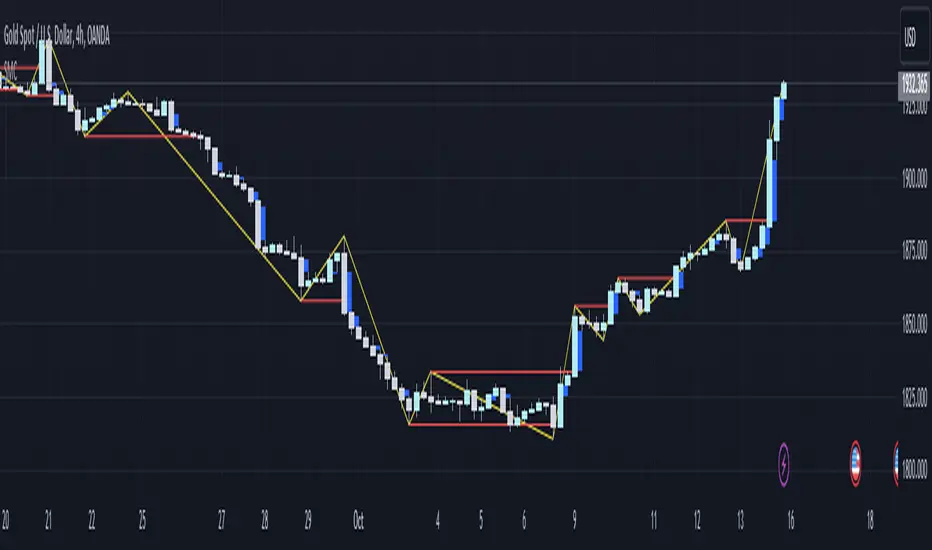
If a candle has its entire body above the previous swing high, it indicates a strong upward momentum. The market is leaning towards an upward direction. If the candle remains within the range of the previous swing high, it signifies weak upward momentum. The market is reluctant to move higher.
If a candle has its entire body below the previous swing low, it reflects a strong downward momentum. The market is leaning towards a downward direction. If the candle remains within the range of the previous swing low, it indicates weak downward momentum. The market is reluctant to move lower.
Absolute ZigZag LibLibrary "Absolute_ZigZag_Lib"
This ZigZag Library is a Bit different. Instead of using percentages or looking more than 1 bar left or right, this Zigzag library calculates pivots by just looking at the current bar highs and lows and the ones of one bar earlier.
This is the most accurate way of calculating pivots and it also eliminates lag.
The library also features a solution for bars that have both a higher high and a higher low like seen below.
You can also use your own colors for the labels and the lines.
You can also quickly select a one-colored theme without changing all colors at once
method isHigherHigh(this)
Checks if current pivot is a higher high
Namespace types: Pivot
Parameters:
this (Pivot) : (Pivot) The object to work with.
@return (bool) True if the pivot is a higher high, false if not.
method isLowerHigh(this)
Checks if current pivot is a lower high
Namespace types: Pivot
Parameters:
this (Pivot) : (Pivot) The object to work with.
@return (bool) True if the pivot is a lower high, false if not.
method isHigherLow(this)
Checks if current pivot is a higher low
Namespace types: Pivot
Parameters:
this (Pivot) : (Pivot) The object to work with.
@return (bool) True if the pivot is a higher low, false if not.
method isLowerLow(this)
Checks if current pivot is a lower low
Namespace types: Pivot
Parameters:
this (Pivot) : (Pivot) The object to work with.
@return (bool) True if the pivot is a lower low, false if not.
method getLastPivotHigh(this)
Gets the last Pivot High
Namespace types: Pivot
Parameters:
this (Pivot ) : (array) The object to work with.
@return (Pivot) The latest Pivot High
method getLastPivotLow(this)
Gets the last Pivot Low
Namespace types: Pivot
Parameters:
this (Pivot ) : (array) The object to work with.
@return (Pivot) The latest Pivot Low
method prev(this, index)
Namespace types: Pivot
Parameters:
this (Pivot )
index (int)
method last(this, throwError)
Namespace types: Pivot
Parameters:
this (Pivot )
throwError (bool)
new(highFirst, theme)
Parameters:
highFirst (bool)
theme (Theme)
getLowerTimeframePeriod()
Theme
Used to create a (color) theme to draw Zigzag
Fields:
colorDefault (series color)
colorNeutral (series color)
colorBullish (series color)
colorBearish (series color)
coloredLines (series bool)
Point
Used to determine a coordination on the chart
Fields:
x (series int)
y (series float)
Pivot
Used to determine pivots on the chart
Fields:
point (Point)
isHigh (series bool)
isHigher (series bool)
ln (series line)
lb (series label)

CommonTypesMathLibrary "CommonTypesMath"
Provides a common library source for common types of useful mathematical structures.
Includes: `complex, Vector2, Vector3, Vector4, Quaternion, Segment2, Segment3, Pole, Plane, M32, M44`
complex
Representation of a Complex Number, a complex number `z` is a number in the form `z = x + yi`,
Fields:
re : Real part of the complex number.
im : Imaginary part of the complex number.
Vector2
Representation of a two dimentional vector with components `(x:float,y:float)`.
Fields:
x : Coordinate `x` of the vector.
y : Coordinate `y` of the vector.
Vector3
Representation of a three dimentional vector with components `(x:float,y:float,z:float)`.
Fields:
x : Coordinate `x` of the vector.
y : Coordinate `y` of the vector.
z : Coordinate `z` of the vector.
Vector4
Representation of a four dimentional vector with components `(x:float,y:float,z:float,w:float)`.
Fields:
x : Coordinate `x` of the vector.
y : Coordinate `y` of the vector.
z : Coordinate `z` of the vector.
w : Coordinate `w` of the vector.
Quaternion
Representation of a four dimentional vector with components `(x:float,y:float,z:float,w:float)`.
Fields:
x : Coordinate `x` of the vector.
y : Coordinate `y` of the vector.
z : Coordinate `z` of the vector.
w : Coordinate `w` of the vector, specifies the rotation component.
Segment2
Representation of a line in two dimentional space.
Fields:
origin : Origin coordinates.
target : Target coordinates.
Segment3
Representation of a line in three dimentional space.
Fields:
origin : Origin coordinates.
target : Target coordinates.
Pole
Representation of polar coordinates `(radius:float,angle:float)`.
Fields:
radius : Radius of the pole.
angle : Angle in radians of the pole.
Plane
Representation of a 3D plane.
Fields:
normal : Normal vector of the plane.
distance : Distance of the plane along its normal from the origin.
M32
Representation of a 3x2 matrix.
Fields:
m11 : First element of the first row.
m12 : Second element of the first row.
m21 : First element of the second row.
m22 : Second element of the second row.
m31 : First element of the third row.
m32 : Second element of the third row.
M44
Representation of a 4x4 matrix.
Fields:
m11 : First element of the first row.
m12 : Second element of the first row.
m13 : Third element of the first row.
m14 : fourth element of the first row.
m21 : First element of the second row.
m22 : Second element of the second row.
m23 : Third element of the second row.
m24 : fourth element of the second row.
m31 : First element of the third row.
m32 : Second element of the third row.
m33 : Third element of the third row.
m34 : fourth element of the third row.
m41 : First element of the fourth row.
m42 : Second element of the fourth row.
m43 : Third element of the fourth row.
m44 : fourth element of the fourth row.

Price Swing Detection - Smart Money ConceptSince my own style is Smart Money Concept and these days I have seen a lot of my friends who are having trouble identifying structures for their indicators and strategies. I wrote this code so they could use it in their strategy . In fact, this type of structure, as one of the strongest technical structures, can increase the success of your strategy according to your personalization.
The script detects swings (i.e. significant highs and lows) in a financial instrument's price action over a specified period. The user can set the lookback period (number of candles to consider) and the colors of the lines representing bullish and bearish trends.
The script has two functions: detectSwing and pivot high. The detectSwing function calculates the swing highs and lows for the specified number of candles. The function uses the ta.highest and ta.lowest functions to find the highest and lowest prices, respectively, over the lookback period. The function also determines the swing state (high or low) of the current candle and returns the calculated swing values.
The pivot high function calculates the pivot high, which is an important step in detecting bullish structures in the market. If a new top (i.e. swing high) is found, the script updates the pivot high values and creates a line from the recent top to the last bar. The script also updates the trailing maximum values, which are used to extend the top extension line.
For Strategy :
The variable "trendDirection" in the code is used to keep track of the trend state, either bullish (up trend) or bearish (down trend), in the market. The variable is initialized to 0 which represents a downtrend. The value of this variable is updated later in the code based on the calculations of swing highs and lows, pivot crosses, and the trailing maximum. If a bullish structure is detected, the value of "trendDirection" is set to 1, indicating an uptrend.

MarketStructureLibrary "MarketStructure"
This library contains functions for identifying Lows and Highs in a rule-based way, and deriving useful information from them.
f_simpleLowHigh()
This function finds Local Lows and Highs, but NOT in order. A Local High is any candle that has its Low taken out on close by a subsequent candle (and vice-versa for Local Lows).
The Local High does NOT have to be the candle with the highest High out of recent candles. It does NOT have to be a Williams High. It is not necessarily a swing high or a reversal or anything else.
It doesn't have to be "the" high, so don't be confused.
By the rules, Local Lows and Highs must alternate. In this function they do not, so I'm calling them Simple Lows and Highs.
Simple Highs and Lows, by the above definition, can be useful for entries and stops. Because I intend to use them for stops, I want them all, not just the ones that alternate in strict order.
@param - there are no parameters. The function uses the chart OHLC.
@returns boolean values for whether this bar confirms a Simple Low/High, and ints for the bar_index of that Low/High.
f_localLowHigh()
This function finds Local Lows and Highs, in order. A Local High is any candle that has its Low taken out on close by a subsequent candle (and vice-versa for Local Lows).
The Local High does NOT have to be the candle with the highest High out of recent candles. It does NOT have to be a Williams High. It is not necessarily a swing high or a reversal or anything else.
By the rules, Local Lows and Highs must alternate, and in this function they do.
@param - there are no parameters. The function uses the chart OHLC.
@returns boolean values for whether this bar confirms a Local Low/High, and ints for the bar_index of that Low/High.
f_enhancedSimpleLowHigh()
This function finds Local Lows and Highs, but NOT in order. A Local High is any candle that has its Low taken out on close by a subsequent candle (and vice-versa for Local Lows).
The Local High does NOT have to be the candle with the highest High out of recent candles. It does NOT have to be a Williams High. It is not necessarily a swing high or a reversal or anything else.
By the rules, Local Lows and Highs must alternate. In this function they do not, so I'm calling them Simple Lows and Highs.
Simple Highs and Lows, by the above definition, can be useful for entries and stops. Because I intend to use them for trailing stops, I want them all, not just the ones that alternate in strict order.
The difference between this function and f_simpleLowHigh() is that it also tracks the lowest/highest recent level. This level can be useful for trailing stops.
In effect, these are like more "normal" highs and lows that you would pick by eye, but confirmed faster in many cases than by waiting for the low/high of that particular candle to be taken out on close,
because they are instead confirmed by ANY subsequent candle having its low/high exceeded. Hence, I call these Enhanced Simple Lows/Highs.
The levels are taken from the extreme highs/lows, but the bar indexes are given for the candles that were actually used to confirm the Low/High.
This is by design, because it might be misleading to label the extreme, since we didn't use that candle to confirm the Low/High..
@param - there are no parameters. The function uses the chart OHLC.
@returns - boolean values for whether this bar confirms an Enhanced Simple Low/High
ints for the bar_index of that Low/High
floats for the values of the recent high/low levels
floats for the trailing high/low levels (for debug/post-processing)
bools for market structure bias
f_trueLowHigh()
This function finds True Lows and Highs.
A True High is the candle with the highest recent high, which then has its low taken out on close by a subsequent candle (and vice-versa for True Lows).
The difference between this and an Enhanced High is that confirmation requires not just any Simple High, but confirmation of the very candle that has the highest high.
Because of this, confirmation is often later, and multiple Simple Highs and Lows can develop within ranges formed by a single big candle without any of them being confirmed. This is by design.
A True High looks like the intuitive "real high" when you look at the chart. True Lows and Highs must alternate.
@param - there are no parameters. The function uses the chart OHLC.
@returns - boolean values for whether this bar confirms an Enhanced Simple Low/High
ints for the bar_index of that Low/High
floats for the values of the recent high/low levels
floats for the trailing high/low levels (for debug/post-processing)
bools for market structure bias

Mark Structure ShdwMark Structure Show is building the market swing structure, minor and sub structure and marks all possible insignificant pivots
This indicator is the alternative version of Mark Structure indicator, I had to create another indicator in order to avoid programming limitation of TreadingView.
This version uses confirmation approach as confirming by body, it means every swing low/high is confirmed when the body (of newly creating swing low/high correspondingly) takes place and intercepts it. the same behaviour is with breaking structure its confirmed only by body.
From trading prospective with this kind of approach we can easily detect manipulations (caused by sweeps) and disregard those manipulation as elements which are breaking the structure. so its extremely useful for those who are trading smart money price actions and basing on swing structure POI
it supports:
- Marking all pivots with labels or join them continuously with trend lines.
- Marking minor and sub structured swings with labels or join them continuously with trend lines. Marking last actual CHoCH and BOS. Minor and substructure are structures inside swing structure and it can differ from the structure of lower timeframe
- Marking swings of swing structure with labels or join them continuously with trend lines.
- Changing bullish and bearish colors of each kind of structures
- Changing pivot labelings
- Changing colors
Remarks:
- Don't expect to have minor and sub structure in each swing waves, its totally fine when you don't have them at all
- Swing structure is the most significant structure and shows real price direction.
- The last swing is not able to be confirmed it tries to build 2 swings that most likely would be either substructure or SMS BOS

Zig Zag+ (Macro + Internal Structure Tool)ZigZag+ (Macro + Internal Structure Tool)
ZigZag+ is a simple tool that helps traders to clearly identify and differentiate between macro and internal market structure, to help you keep your bearings of where you are currently in the overall picture.
It is especially difficult to keep your bearings within the larger structural trend when trading the lower timeframes, where for example, a bearish structural trend on a lower timeframe may simply be a retracement of an overall bullish structural trend on a higher timeframe. This indicator primarily aims to help traders maintain awareness of where they are in relationship to the higher timeframe / 'macro' structural trend, and their most significant swing point highs and lows.
The features of this indicator include:
- 2x Zig Zag lines drawn automatically onto your chart. One which has a longer length than the other, which can be used to help identify and differentiate the larger price swings from the smaller price swings found within it. Enabled by default.
- Customisable Zig Zag line color & width settings to help clearly differentiate the higher timeframe 'macro structure' apart from the lower timeframe 'internal structure' within it, enabling it to be tailored to suit your chart colour theme and personal preference.
- Customisable individual length settings for the 2x Zig Zag lines, to allow the fine tuning of each line to any timeframe and asset. By default one lines length is set to a higher value than the other, to illustrate a macro structure (higher length value) as well as the 'internal structure' (lower value length), seen within the larger macro structure.
- Up to a maximum of 500 lines can be drawn meaning you can zoom out considerably, and view historical price action with both Zig Zag lines continuing to print.
- Custom alerts for identifying candlesticks that can offer optimal entries where they are found within valid price markups or markdowns that are already underway. Further details can be found within the tooltips for these signals.
Note: The above list of features are accurate at the time of publishing, but may be updated or added to in future.
Structure
Understanding structure is arguably the foundation of all trading strategies, and therefore very important to understand where you are exactly in the bigger picture, since it can help identify levels at which there is a higher probability of price moving either upward or downward at a given point. Structural trend refers to the typical way that price tends to move in any given trending market, identified by the continuation of higher highs and higher lows in a typical bullish trending market, and lower highs and lower lows in a bearish trending market.
During other times price may not be trending in this way, for example when it is undergoing accumulation or distribution phases, where the consistent higher high & lower low / lower high and lower low patterns will not be evident.
What is Macro Structure?
Macro trend structure refers to the structural trend seen on higher timeframe charts.
What is Internal Structure?
Internal trend structure refers to the structural trend seen on lower timeframe charts, which is found within the higher timeframe structure.
Disclaimer: This indicator is adapted from an original script authored by Tr0sT . With special thanks.

Mark StructureMark Structure is building the market swing structure, minor and sub structure and marks all possible insignificant pivots
Building such structure is really complex task to do, that has a lot of obstacles and challenges. I'm doing my best to develop this indicator behaving in absolutely expectable and right way. Fill free to leave any comments or bug reports.
it supports:
- Marking all pivots with labels or join them continuously with trend lines.
- Marking minor and sub structured swings with labels or join them continuously with trend lines. Marking BOS or SMS BOS, which are mbos. Minor and substructure are structures inside swing structure and it can differ from the structure of lower timeframe
- Marking swings of swing structure with labels or join them continuously with trend lines. Marking BOS or SMS BOS of swing structure
- Changing bullish and bearish colors of each kind of structures
- Changing pivot labelings
- Changing colors of BOSs
Remarks:
- As I told you guys before, it has a lot of challenging cases. eg we have swing low and high on the same candle and in order to decide which pivot goes first I take lower time frame data to figure out what pivot is the first, but it happens that on lower time frame the same issue takes place, due to limitation of TradingView I can't go infinitely to lower timeframes to solve this issue, so I mark those cases with labels
- Another issue is very beginning of the trend its hard to detect swing structure there due to missing historical data. so skip a few waves in the very beginning
- Don't expect to have minor and sub structure in each swing waves, its totally fine when you don't have them at all
- Swing structure is the most significant structure and shows real price direction. Trend change is confirmed when for bull->bear the last HLbull LH>HH and HH-HL-HH are confirmed. You can change labelling for unconfirmed swing trend in the settings. By default its already done

MTF Market Structure Highs and LowsThe indicator marks the last fractal highs and lows (W,D,4H and 1H options) to help determine current market structure. The script was created to help with directional bias but also as a MTF visual aid for stop hunts/liquidity raids.
Liquidity areas are where we assume trader's stop losses would be when buying or selling. Liquidity lies above and below swing points and institutions need liquidity to fill large orders.
Monitor price action as it hits these areas for a potential reversal trade.

Bjorgum Key Levels
Key Levels Aims to capture 3 of the most significant points in price action
Breakouts
False Breakouts (Traps)
Back Checks
These 3 points alone, if properly identified, can be some of the most significant points of movement in the price history of an asset and bring significant gains to traders, if capitalized on. Here are a few examples of these setups
Breakouts
Breakouts can bring significant rallies as the market swings one sided after key levels are breached. This entry type can bring large trending runs to follow. Momentum is on your side, but the trade off is a higher entry.
False Breakouts
Also known as a bull trap or a bear trap, false breaks can lead to swift and significant reversals and potential for a large and sudden move to the opposite side. When a key level breakout fails to hold, parties entering to capitalize on the "epic breakout" can get left holding the bag forcing them to exit at a loss, which can double the force of pressure. Traps can bring swift gains from good entry prices. However, price is still in a larger trend against you so momentum is weak, so price action is susceptible to roll over.
Backchecks
Back checks are pull backs in trend that find middle ground to the 2 areas already described. Both momentum and entry price are decent, but risk is defined as a key level has flipped offering entry with stops below demand, or above supply.
Combining these 3 methods helps to diversify risk, understand trend development, and bring steady gains. This script helps to identify these points to traders with analysis of key levels, price structure, and trend direction, while providing visual signals and alerts for when they occur.
Best of luck in your coding and trading and thank you for your support

Pivot Points And Breakout Price Action With LuckyNickVaBar Color Candle Aligned with pivot points swing high and swing lows For Those Who Are Familiar with Trading The Breakouts Of Highs & Lows Of Structure. Pivots are said to be key areas in the market where price shows heavy reaction to where reversals make occur. At these points there are swing Highs & swing lows that traders may be able to find opportunity in the market. This Script is a combination of pivot points and Barcolor signals for the breakout.

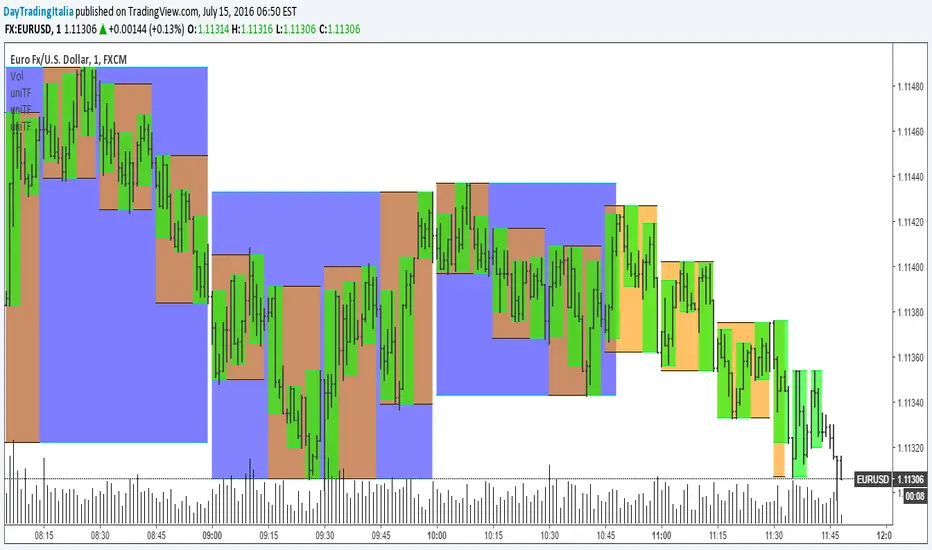
Strongholds - Objective & Accurate Reference Points / StructuresVery early in my trading career, I came across Pivot Points only to find out that there are as many calculations as one pleases. It was hard to find out which ones work. Most of them probably did only out of randomness, so I ditched the strategy and looked for something else.
I previously used my Oracle Eye and Reference Points scripts but it is time for an upgrade.
Stronghold is a script I have used for quite some time now. I ditched daily and weekly closing prices as not that important. Instead, Strongholds are equipped with:
►Daily High & Low • Azure color
►Weekly High & Low • Dark blue
►Weekly old High & Low • Semi-transparent dark circles
►Monthly High & Low • Wizardly purple
There is an option to print:
►4h High & Low • Semi-transparent red
►VWAP • Lovely purple
►Weekly VWAP • Black
All of the levels and lines are set for 1m, 5m, 10m, 15m, 30m, 1h, 4h, 1D timeframes. If you use any alien timeframe, you may need to enter the code.
You can opt-in and out for certain timeframes. For example, daily levels are visible from 15m or 30, so the indicator won't draw them unless you want to. However, they will not be seen on higher timeframes as there is no reason to show them and oversaturate the chart with lines.
▬▬▬▬▬▬▬▬▬▬▬▬▬▬▬▬▬▬▬▬▬▬
Remember that if you use this script with auto-scale, you need to tick Scale Price Chart Only . Otherwise, your chart will fly to the moon!
Good luck & have fun!

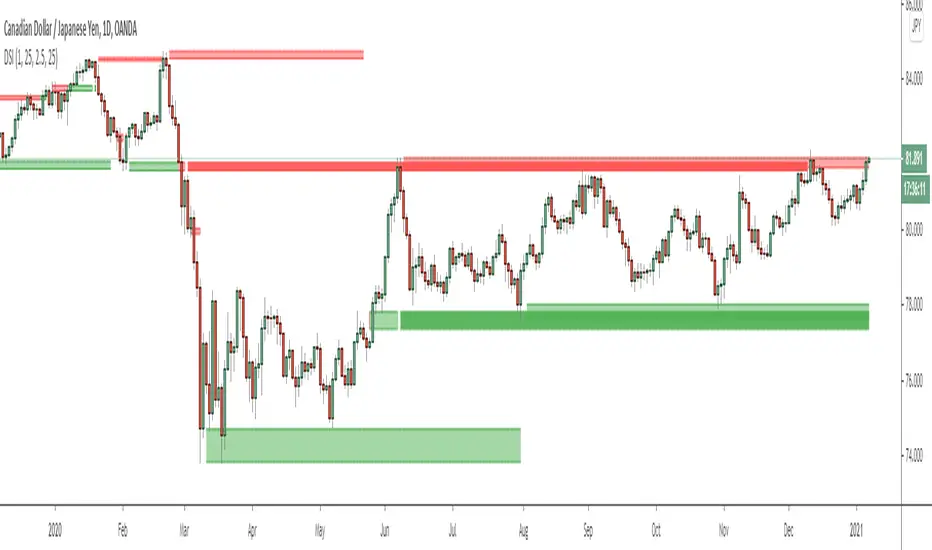
Dynamic Structure IndicatorThis is a dynamic structure indicator designed to map potential support and resistance zones (in all markets). It does this by looking back x amount of candles to identify major swing highs and lows on the specified reference timeframe, and then it draws a zone between the highest/lowest wick and the highest/lowest candle close across the chart until a new zone is created.
The settings are important because it gathers data from a separate reference timeframe, so sometimes it will map zones that aren’t really appropriate for lower timeframes. On lower timeframes (1Hr and under) I’d recommend setting the reference timeframe to your actual trading timeframe and increasing the lookback period to fine-tune the zone mapping. The script is set for 4 Hour forex charts by default.
Please note: the max zone option is disabled by default because it is different for every instrument, but this is a useful feature that I recommend using. Sometimes the indicator picks up huge gaps that aren’t really considered support or resistance zones. If this happens to you, use the zone size settings to invalidate huge (or tiny) zones. The zone size is in pips.
To be honest I didn’t get this indicator to be quite as accurate as I envisioned and it’s still a work in progress as I learn pine script, but this is the best I’ve been able to get it to function and with the right settings it works fairly well so I figured I might as well release this first version. Maybe someone with better skills than me can help refine it to more accurately identify major fractals and levels - if so, please get in touch! All traders should be able to identify their own major levels by eye anyway, but this script is intended to be a building block for future signal indicators I wish to develop.
Last of all - please don’t use this indicator to trade blindly! Often price will blast right through these zones and the zones aren’t always accurate. Remember that structure levels only work if they’re obvious to other traders, and always wait for confirmation signals that meet your trade plan rules before entering trades – especially reversals or counter-trend trades.
If you have any questions or tips to improve the script, feel free to leave a comment or private message me.
Enjoy, and good luck out there :)
- Matt.