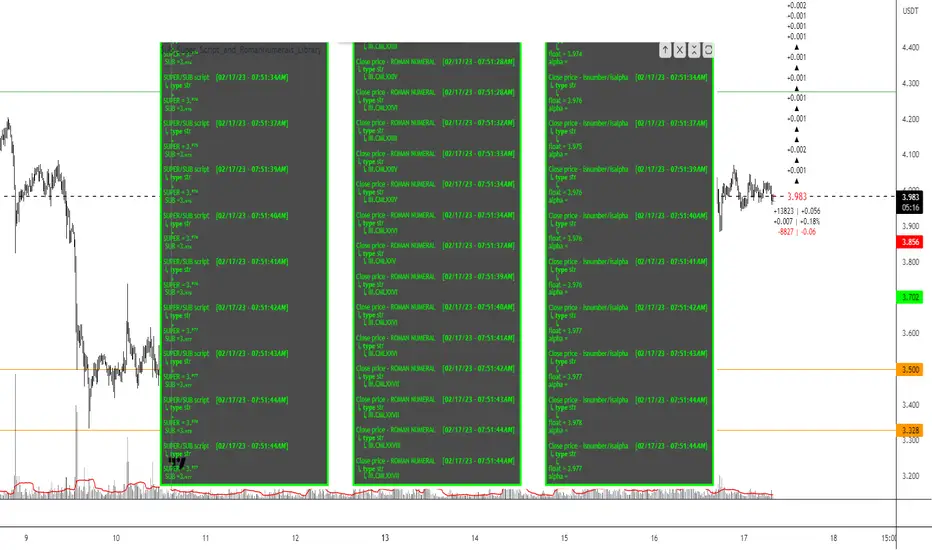
Sub-Super Script and Roman numerals LibraryLibrary "Sub_Super_Script_and_RomanNumerals_Library"
Library to transform numbers into Roman numerals / Super-Sub script / check if value is alpha or number
isnumber(input)
check to see if value is a number
Parameters:
input : (string/float/int) value to check
Returns: (na) if value is NOT a number and input (string/float/int) if value is a number
isalpha(input)
check a string if it is alpha(doesnt contain numbers)
Parameters:
input
Returns: (string) if string input does NOT contain numbers, return (na) if input string contains numbers
super(num)
convert a string's numbers from normal print to super-script
Parameters:
num : (string/int/float) input value to transform
Returns: string of input with numbers converted to super-script
sub(num)
convert a string's numbers from normal print to sub-script
Parameters:
num : (string/int/float) input value to transform
Returns: string of input with numbers converted to sub-script
roman(num, trunc)
convert a string of numbers, float, or int
Parameters:
num : (string) input number to transform
trunc : (bool | false) true to truncate float value, false to show roman numerals with decimals (XX.VI)
Returns: string of roman numerals representing the input (num)
SUB
Line Chart with circles on sub chart / LineChart no CandlesLine Chart with circles as a subchart. The circle will appear only after the candle has been confirmed.
Things you can change:
- Source: open, high, low, close, hl2, hlc3, ohlc4, hlcc4
- Color: change the color of the line and the circles
have fun with it!

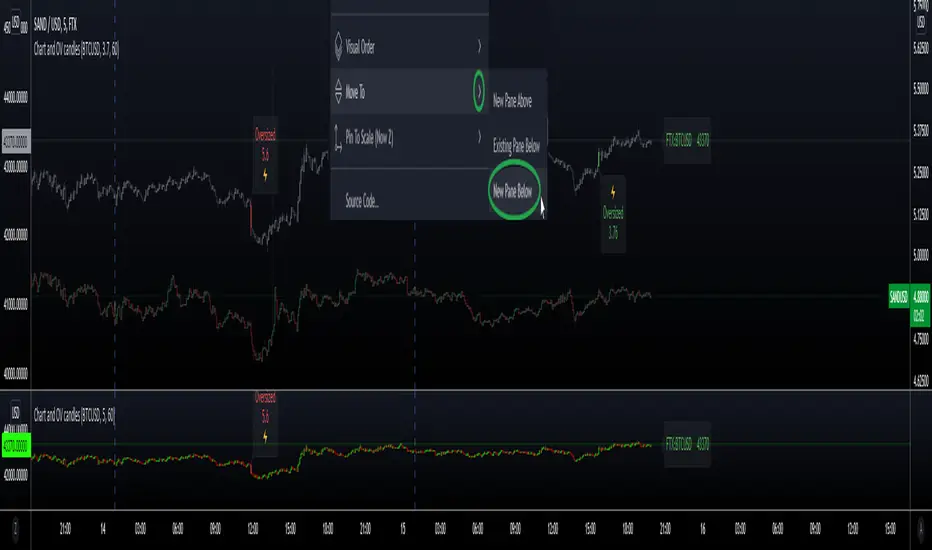
Secondary Chart with OverSized CandlesHi everyone, I'm sharing a simple script I made for a friend. He was looking for a way to add another asset to his chart, and monitor relevant movements \ spot eventual correlation, especially when trading Cryptocurrencies.
We couldn't find a similar script already available so here it is - the code is commented and I hope it's clear enough :)
Notes:
- The parameter scale = scale.left keeps the scales separated and therefore the chart is more organized, otherwise the chart would appear flat if the price difference is too big (e.g. BTC vs XRP)
- It is possible to have the script running in a separate panel (instead of overlay) by moving it to a new pane (when added to the chart) or by removing the parameter overlay = true at the beginning of the code.
- In case you wish to add indicators to this sub-chart (e.g. Bollinger Bands, EMA, etc..) you can do that by adding the relevant code and feed it with the variables OPEN \ HIGH \ LOW \ CLOSE as well as using the same method to retrieve new variables from the target asset with the request.security function.
Hope this comes handy.
Val - Protervus