Adaptive Trend Following Suite [Alpha Extract]A sophisticated multi-filter trend analysis system that combines advanced noise reduction, adaptive moving averages, and intelligent market structure detection to deliver institutional-grade trend following signals. Utilizing cutting-edge mathematical algorithms and dynamic channel adaptation, this indicator provides crystal-clear directional guidance with real-time confidence scoring and market mode classification for professional trading execution.
🔶 Advanced Noise Reduction
Filter Eliminates market noise using sophisticated Gaussian filtering with configurable sigma values and period optimization. The system applies mathematical weight distribution across price data to ensure clean signal generation while preserving critical trend information, automatically adjusting filter strength based on volatility conditions.
advancedNoiseFilter(sourceData, filterLength, sigmaParam) =>
weightSum = 0.0
valueSum = 0.0
centerPoint = (filterLength - 1) / 2
for index = 0 to filterLength - 1
gaussianWeight = math.exp(-0.5 * math.pow((index - centerPoint) / sigmaParam, 2))
weightSum += gaussianWeight
valueSum += sourceData * gaussianWeight
valueSum / weightSum
🔶 Adaptive Moving Average Core Engine
Features revolutionary volatility-responsive averaging that automatically adjusts smoothing parameters based on real-time market conditions. The engine calculates adaptive power factors using logarithmic scaling and bandwidth optimization, ensuring optimal responsiveness during trending markets while maintaining stability during consolidation phases.
// Calculate adaptive parameters
adaptiveLength = (periodLength - 1) / 2
logFactor = math.max(math.log(math.sqrt(adaptiveLength)) / math.log(2) + 2, 0)
powerFactor = math.max(logFactor - 2, 0.5)
relativeVol = avgVolatility != 0 ? volatilityMeasure / avgVolatility : 0
adaptivePower = math.pow(relativeVol, powerFactor)
bandwidthFactor = math.sqrt(adaptiveLength) * logFactor
🔶 Intelligent Market Structure Analysis
Employs fractal dimension calculations to classify market conditions as trending or ranging with mathematical precision. The system analyzes price path complexity using normalized data arrays and geometric path length calculations, providing quantitative market mode identification with configurable threshold sensitivity.
🔶 Multi-Component Momentum Analysis
Integrates RSI and CCI oscillators with advanced Z-score normalization for statistical significance testing. Each momentum component receives independent analysis with customizable periods and significance levels, creating a robust consensus system that filters false signals while maintaining sensitivity to genuine momentum shifts.
// Z-score momentum analysis
rsiAverage = ta.sma(rsiComponent, zAnalysisPeriod)
rsiDeviation = ta.stdev(rsiComponent, zAnalysisPeriod)
rsiZScore = (rsiComponent - rsiAverage) / rsiDeviation
if math.abs(rsiZScore) > zSignificanceLevel
rsiMomentumSignal := rsiComponent > 50 ? 1 : rsiComponent < 50 ? -1 : rsiMomentumSignal
❓How It Works
🔶 Dynamic Channel Configuration
Calculates adaptive channel boundaries using three distinct methodologies: ATR-based volatility, Standard Deviation, and advanced Gaussian Deviation analysis. The system automatically adjusts channel multipliers based on market structure classification, applying tighter channels during trending conditions and wider boundaries during ranging markets for optimal signal accuracy.
dynamicChannelEngine(baselineData, channelLength, methodType) =>
switch methodType
"ATR" => ta.atr(channelLength)
"Standard Deviation" => ta.stdev(baselineData, channelLength)
"Gaussian Deviation" =>
weightArray = array.new_float()
totalWeight = 0.0
for i = 0 to channelLength - 1
gaussWeight = math.exp(-math.pow((i / channelLength) / 2, 2))
weightedVariance += math.pow(deviation, 2) * array.get(weightArray, i)
math.sqrt(weightedVariance / totalWeight)
🔶 Signal Processing Pipeline
Executes a sophisticated 10-step signal generation process including noise filtering, trend reference calculation, structure analysis, momentum component processing, channel boundary determination, trend direction assessment, consensus calculation, confidence scoring, and final signal generation with quality control validation.
🔶 Confidence Transformation System
Applies sigmoid transformation functions to raw confidence scores, providing 0-1 normalized confidence ratings with configurable threshold controls. The system uses steepness parameters and center point adjustments to fine-tune signal sensitivity while maintaining statistical robustness across different market conditions.
🔶 Enhanced Visual Presentation
Features dynamic color-coded trend lines with adaptive channel fills, enhanced candlestick visualization, and intelligent price-trend relationship mapping. The system provides real-time visual feedback through gradient fills and transparency adjustments that immediately communicate trend strength and direction changes.
🔶 Real-Time Information Dashboard
Displays critical trading metrics including market mode classification (Trending/Ranging), structure complexity values, confidence scores, and current signal status. The dashboard updates in real-time with color-coded indicators and numerical precision for instant market condition assessment.
🔶 Intelligent Alert System
Generates three distinct alert types: Bullish Signal alerts for uptrend confirmations, Bearish Signal alerts for downtrend confirmations, and Mode Change alerts for market structure transitions. Each alert includes detailed messaging and timestamp information for comprehensive trade management integration.
🔶 Performance Optimization
Utilizes efficient array management and conditional processing to maintain smooth operation across all timeframes. The system employs strategic variable caching, optimized loop structures, and intelligent update mechanisms to ensure consistent performance even during high-volatility market conditions.
This indicator delivers institutional-grade trend analysis through sophisticated mathematical modelling and multi-stage signal processing. By combining advanced noise reduction, adaptive averaging, intelligent structure analysis, and robust momentum confirmation with dynamic channel adaptation, it provides traders with unparalleled trend following precision. The comprehensive confidence scoring system and real-time market mode classification make it an essential tool for professional traders seeking consistent, high-probability trend following opportunities with mathematical certainty and visual clarity.
Suite

Open Intrest / Volume / Liquidations (Suite) [BigBeluga]This indicator is a suite of tools that aims to provide traders with efficient metrics to analyze the market in a different way, such as various types of Open Interest, Intraday Volume, and Liquidations.
This indicator can both save time and also provide a different approach to the usual price action trading style.
🔶 FEATURES
The indicator contains the following features:
Open Interest Suite
- Delta OI
- Net longs and shorts
- OI Relative Strength Index
Intraday Volume Suite
- Bullish and Bearish LTF Volume
- CVD
- Delta Volume
Liquidations Suite
- Long and Short Liquidations
- Cumulative Liquidations
🔶 EXAMPLE OF SUITE
In the example above, we can see how we can plot long and short positions, both opening and closing out.
This can give a unique way to view which side is the strongest but also which side has the most resting liquidity.
For example, if more longs are entering the market, it also means more liquidity for longs and vice versa.
Or, for example, plotting the delta OI will allow the user to see big percentages in change and spot big areas of position closing out.
This presents a fascinating method for observing numerous positions closing out in conjunction with a surge of liquidations, which could indicate a potential reversal in price.
Here, we can see a basic example of using intraday volume on a 1m LTF.
With this, we are able to see both bullish and bearish volume of the same candle, very useful to see both volumes traded in the same candle.
Using the CVD to see the overall direction based purely on the volume and spot divergence, for example, the price in an uptrend but CVD going down, indicating weak shorts in the market or trapped shorts.
Or simply view liquidations happening in the market in a very different way, both long and short liquidation at the same time + the option to use multi-timeframe liquidations.
🔶 CONCLUSION
The idea of this script is to provide a set of tools in a unique script to optimize time and analyze the market in both a quick way and in a different way than usual.

Range Filter x Hull SuiteRange Filter x Hull Suite
This indicator is a hybrid of two popular indicators, with a twist; namely the Range Filter (Guikroth version) and the Hull Suite (by Insilico) .
Originally developed as a 1 minute trend following strategy and traded during the New York Session for it's typically high volume / likely trending nature, it provides entry signals based on the following logic:
For bullish entry signals:
The first bullish* candle (*defined by the Range Filter bar color logic, blue by default - which is not necessarily technically a bullish candle as defined by the OHLC values) which appears after the consolidation candles (also defined by the Range Filter bar color logic, orange by default), and where the Hull Suite moving average is also bullish.
For bearish entry signals:
The first bearish* candle (*defined by the Range Filter bar color logic, red by default - which is not necessarily technically a bearish candle as defined by the OHLC values) which appears after the consolidation candles (also defined by the Range Filter bar color logic, orange by default), and where the Hull Suite moving average is also bearish.
The indicator aims to filter out signals where possible consolidation is occurring and comes with styling options and alternative filter options such as a triple moving average trend detection method. Signals can also be filtered by a specific trading session. Standard options for the Range Filter and Hull Suite settings are also able to be customised within the settings menu.
Alerts
Various alerts are built-in, including the custom entry signals unique to this strategy.
Note : The above features listed above are accurate at the time of publishing, but may be altered in future.
Many thanks to guikroth & Insilico for sharing their open source indicators, and also to the original developer of the strategy itself for sharing it.

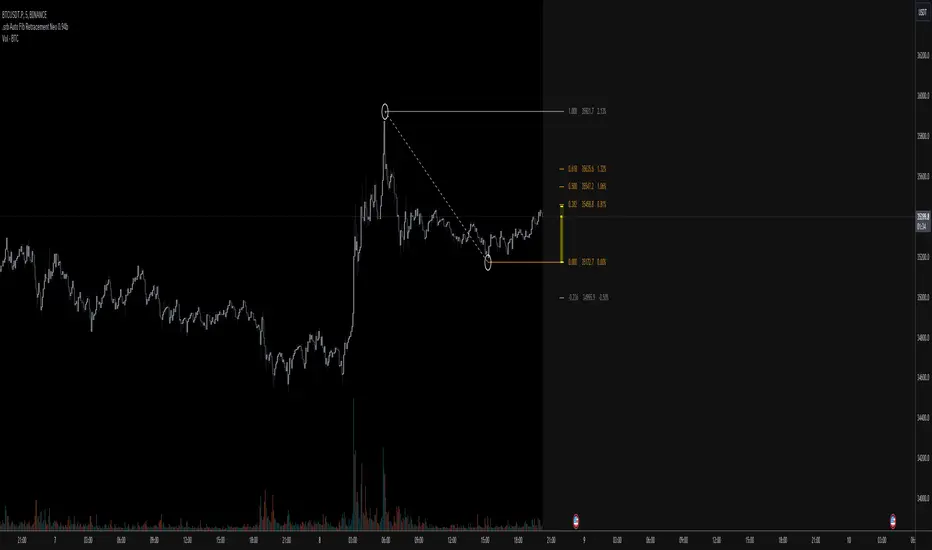
.srb suite Fib Retracement neoSPECIAL TOOLS - Auto Fibonacci Retracement neo - New GUI
designed for use with open-source indicator
'built-in auto FBR ' has been re-born
It shows - retracement Max top/ min bottom ; for higher visibility
It shows - current retracement position ; for higher visibility
The display of the Fib position that exceeds the regular range is auto-determined according to the price.
Fib.Retracement core is from tradingview built-in FBR ---> upgrade new-type GUI, and performance tuned.
.srb suiteThe essential suite Indicator.
that are well integrated to ensure visibility of essential items for trading.
it is very cumbersome to put symbol in the Tradingview chart and combine essential individual indicators one by one.
Moreover even with such a combination, the chart is messy and visibility is not good.
This is because each indicator is not designed with the others in mind.
This suite was developed as a composite-solution to that situation, and will make you happy.
designed to work in the same pane with open-source indicator by default.
Recommended visual order ; Back = .srb suite, Front = .srb suite vol & info
individually turn on/off only what you need on the screen.
BTC-agg. Volume
4 BTC-spot & 4 BTC-PERP volume aggregated.
It might helps you don't miss out on important volume flows.
Weighted to spot trading volume when using PERP+spot volume .
If enabled, BTC-agg.Vol automatically applied when selecting BTC-pair.
--> This is used in calculations involving volumes, such as VWAP.
Moving Average
1 x JMA trend ribbon ; Accurately follow short-term trend changes.
3 x EMA ribbon ; zone , not the line.
MA extension line ; It provide high visibility to recognize the direction of the MA.
SPECIAL TOOLS
VWAP with Standard Deviation Bands
VWAP ruler
BB regular (Dev. 2.0, 2.5)
BB Extented (Dev. 2.5, 3.0, 3.5)
Fixed Range Volume Profile ; steamlined one, performace tuned & update.
SPECIAL TOOLS - Auto Fibonacci Retracement - New GUI
'built-in auto FBR ' has been re-born
It shows - retracement Max top/ min bottom ; for higher visibility
It shows - current retracement position ; for higher visibility
The display of the Fib position that exceeds the regular range is auto-determined according to the price.
tradingview | chart setting > Appearance > Top margin 0%, Bottom margin 0% for optimized screen usage
tradingview | chart setting > Appearance > Right margin 57
.srb suite vol & info --> Visual Order > Bring to Front
.srb suite vol & info --> Pin to scale > No scale (Full-screen)
Visual order ; Back = .srb suite, Front = .srb suite vol & info
1. Fib.Retracement core is from tradingview built-in FBR ---> upgrade new-type GUI, and performance tuned.
2. Fixed-range volume-profile core is from the open-source one ---> some update & perf.tuned.
---------------------------------------------------------------------------------------------------------------------------------------
if you have any questions freely contact to me by message on tradingview.
but please understand that responses may be quite late.
Special thanks to all of contributors of community.
The script may be freely distributed under the MIT license.

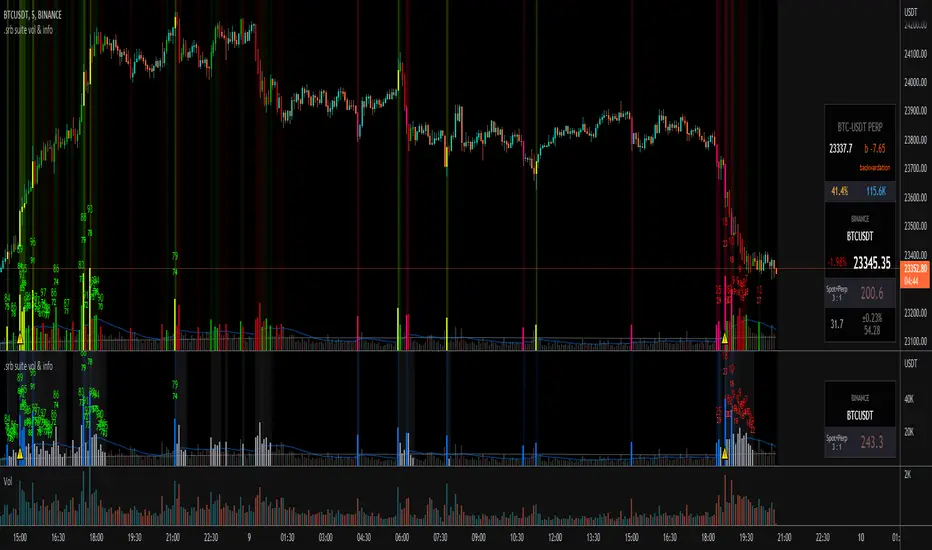
.srb suite vol & infoThe volume indicator
what can replace the built-in volume indicator and It also has some useful features.
and designed to work as overlay in the same pane with open-source indicator by default.
Regular volume Indicator
Volume SMA plot
Large Volume ! emphasize by color & mark.
Ultra Volume ! overlay marking ; x2 x4 x6 lager than regular average volume. it will help you can take the reversal
BTC-agg. Volume
4 BTC-spot & 4 BTC-PERP volume aggregated.
It might helps you don't miss out on important volume flows.
Weighted to spot trading volume when using PERP+spot volume.
If enabled, BTC-agg.Vol automatically applied when selecting BTC-pair.
Information panel (optimized for crypto-currency)
BTC-PERP price & delta (when Binance:BTCUSDT selected)
BTC dominance, Binance:BTCUSDTPERP OI
Symbol, Price, Daily up/down
ATR14 (for checking current volatility)
Recommended setup for .srb suite
tradingview | chart setting > Appearance > Top margin 0%, Bottom margin 0% for optimized screen usage
tradingview | chart setting > Appearance > Right margin 57
.srb suite vol & info --> Visual Order > Bring to Front
.srb suite vol & info --> Pin to scale > No scale (Full-screen)
Joint Conditions Strategy Suite + TradingConnector alerts bot"Please give us combined alerts with the possibility of having several conditions in place to trigger the alert." - was the top voted request from users under one of the recent blogposts by TradingView.
Ask and you shall receive ;)
TradingView is a great platform, with unmatched set of functionalities, yet this particular combo of features indeed seems not to be in place. Fortunately, TradingView is also very open platform, thanks to PineScript coding language, which enables developing combos like the requried one and plenty of other magic.
I have already published numerous "educational" scripts, showing how to code indicators and alerts with PineScript, but... this is not one of them. This one is for real. READY FOR USE on real markets, also by the non-coding traders. Just take my script, set parameters with dropdowns, backtest the strategy, fire the alerts and execute them.
HOW TO USE IT
In "Settings" popup I tried to mimic the CreateAlert popup dropdowns for selecting logic. Let's say you want to enter Long position at Stochastic KxD crossover. In first line of Long Entry conditions set "StochK" + "Crossing Up" + "StochD". Last field doesn't matter because in 3rd dropdown something else than "value" was selected. In second line you could set "maB" + "Greater Than" + "maC" to filter out those entries which are in direction of the uptrend. And yeah, add ADX>25 to make sure the market is actually moving: "ADX" + "Greater Than" + "value" + "25". All condition lines must be TRUE (or skipped) for the entry to be triggered. Toghether with an alert.
The same for Short entries. Combinations are limitless.
INDICATORS AND MTF (MULTI-TIMEFRAME)
In those dropdowns you can select candle values like open/close/high/low/ohlc4, but also some most popular indicators, which I have pre-built into this script: RSI, various Moving Averages, ADX-DMI, Stochastic and Bollinger Bands for start. You can configure parameters of those indicators also in "Settings" popup, in "Indicator Definitions" section. What's important, you can use any of these indicators from higher timeframe, setting MTF multiplier. So if you applied this indicator to 1h chart, but want to use rsi(close,14) from 4h chart, set MTF to 4. If you want to use current timeframe indicators, keep MTF at 1, which is a default setting here.
Note for coders: to keep focus of this script on joining conditions, entire logic for those indicators has been moved to external library, also open source. I encourage you to dig into the code and see how it's done. I love the addition of libraries concept in PineScript.
CUSTOM INDICATOR
Following the "openness" spirit of my master - which is TradingView itself - my work is also open, in 2 ways:
1. This script is open source. So you can grab it, modify or add any functionalities you want. I cannot and don't want to stop you from doing that. I'm asking for only one favor - please mention this source script in your credits.
2. You can import the plot (series) from any other indicator on TradingView. In Settings popup of my script, scroll down to "Indicator Definitions" section, and select the series of your choice in the first dropdown. Now it is ready to use in conditions dropdowns on top of the Settings popup.
Let me give you an example of that last scenario. Take another script of mine, "Pivot Points on SR lines DEMO". You can find it in "Indicators & Strategies" library or here: (). Attach it to your chart. Now come back to THIS script, open Settings popup and in "Custom Indicator aka Imported Source" select "Pivot Points on SR lines: ...". The way it works - it detects if a pivot point happened on Support/Resistance line from the past and returns 1 for PivotLow and -1 for Pivot High. Now in first Long Entry condition set: "custom indicator" + "Greater Than" + "value" + "0" and long entries will be marked on every pivot low noticed on Support/Resistance line.
ALERTS
Last but not least - the alerts. This script produces alerts on the entries calculated by strategy logic, as marked on the chart by the backtester. Moreover, syntax of those alerts is already prepared and fully compatible with TradingConnector - alerts executing tool (bot), if you want to auto-execute those trades. Apart from installing the tool, you need to set
up the alerts in TradingView, here is how:
open CreateAlert popup
in first dropdown select "Joint Conditions Strategy Template"
in second dropdown select "alert() function calls only"
And that's all. You only need to set one alert for the whole script, not one for Longs and one for Shorts as it was in the past. Also, you don't need to setup closing alerts, because stop-loss/take-profit/trailing-stop information is embedded in the entry alert so your broker receives it as early as possible. Alerts sent will look like this: "long sl=40 tp=80", which is exactly what TradingConnector expects.
Phew, that's all folks. If you think I should add something to this template (maybe other indicators?) please let me know in comments or via DM. Happy trading!
P.S. Pyramiding is not supported in this script.
Disclaimer : I'm not saying above combination of conditions will make you money. Actually none of this can be considered financial advice. It is only a software tool. Use it wisely, be aware of the risk and do your own research!
