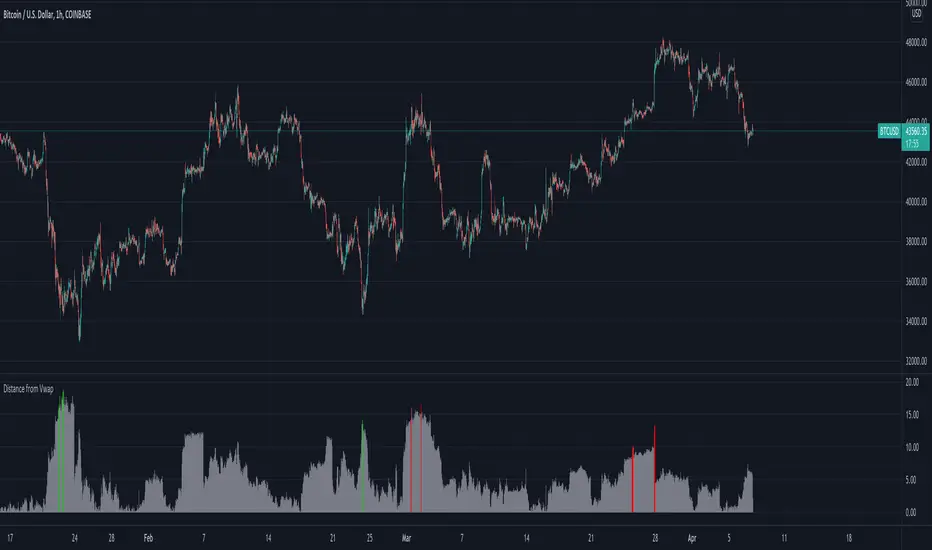
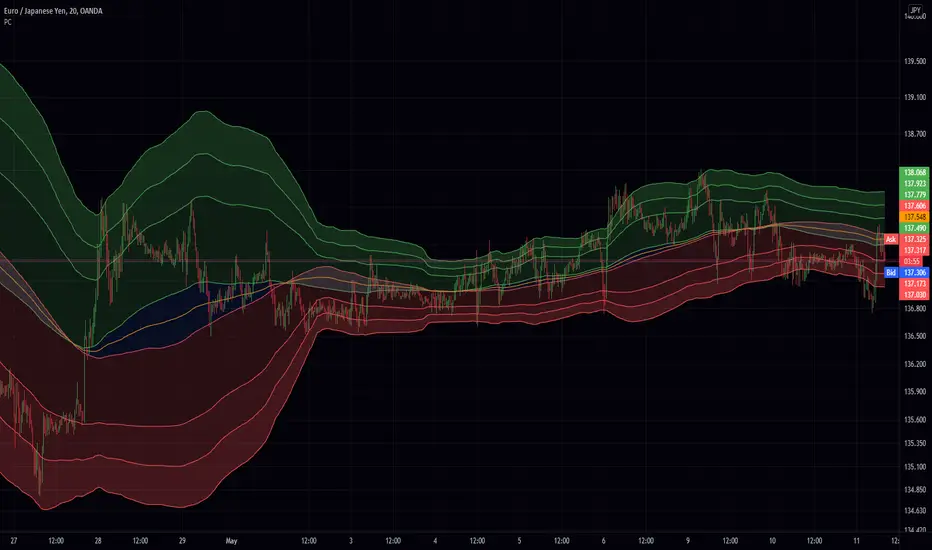
Hello Friends,, This is pivot points high low with pivot trend to define the trend direction. Pivot trend is the pivot points average. Options: - Pivot Point Period - Show/hide Pivot Points Labels - Show/hide Bull/Bear Labels ( depends on pivot trend) - Show/hide Pivot Center Line (Bull>Center, Bear<Center) - Show/hide Support/Resistance Level...
Hi Traders. This is my first attempt of writing an indicator. Let me start by saying I could never have done this without lmatl and WMX_Q_System_Trading who were and are an incredible source of inspiration. This indicator shows horizontal Pivot Support and Resistance . It draws up to 4 horizontal lines extending to the right from and adds labels to High and Low...
Opening Levels is an indicator to draw lines on the opening prices of the current day, week, and month. Inputs: 1. Line Width :- Opening Levels Line width, from 1 to 10 2. Right Offset :- Right offset from current bar, from 0 to 50 3. Line Style :- Select line styles from 4. Show Label :- Show or hide price labels 5. Day Level Color :- Current...
Hello guys, I would like to introduce you volatility support and resistance horizontals. It draws line horizontal on high and low vhighly volatile candles. You can select lines on this timeframe and/or another one. It's done in the same spirit like my other indicators for horizontals The colors are dynamic depending whether price is below or above the...
Disclamer: This indicator does not use actual Volume data and doesn't display any Volume data. It creates a pseudo Volume Profile by counting the high-low-2 values of candles and simulates something that is similar to a Volume Profile without using any Volume data. Core facts: Creates a pseudo Volume Profile by counting values of candles and sorting them...
Hello All, This is Market Profile script. "Market Profile is an intra-day charting technique (price vertical, time/activity horizontal) devised by J. Peter Steidlmayer. Steidlmayer was seeking a way to determine and to evaluate market value as it developed in the day time frame. The concept was to display price on a vertical axis against time on the horizontal,...
Hello Traders, This script can show (upto) 3 candles of another time frames without changing chart time frame realtime . You can choose the time frame and number of candles in the options. You have option to change body and wick colors as well. in this example number of candles is 2: You can set body and wick colors: In this example, weekly candles are...
This script was recently shared for limit only orders here: This version does not worry about keeping orders in the books and moving them around, instead it will simply market in and out. I am sharing this to reveal the difference between the 2 setups.
This script provides basic pivot point Support and Resistance Levels to the user whilst displaying Break signal tags. It also has the ability to let the user display more significant breaks by filtering using the Volume Oscillator. Only more significant breaks of these basic levels are displayed to the user when optimized which avoids noise and messy signals. It...
Automated - Fibs with Limit only orders This script was designed to demonstrate how you can use a single alert to move your limit orders around. It is not meant to be traded live and has been built to work with Binance Futures Testnet. You will notice a lot of plots with 5 different titles. New = Place your limit buy at a fixed-price. Move = Cancel the current...
This script will show the "Fibonacci" Close levels for 9 inputs. Currently set from 8, 13, 21, ..., 377. These lines can then be used for Support and Resistances. Source and Inputs are adjustable.
Freedom of Movement Indicator --------------------------------------------------------- In “Evidence-Based Support & Resistance” article, author Melvin Dickover introduces two new indicators to help traders note support and resistance areas by identifying supply and demand pools. Here you can find the support-resistance technical indicator called "Freedom of...
This script can show mtf-clusters from higher time frames. Tenkan-sen, Kijun-sen, Senko-span A and Senko-span B are displayed in the current time frame from higher time frames (the range is from 1 minute to the monthly time frame). Sometimes these levels form clusters that act as strong levels of support and resistance.
It is a simple indicator, you can use it with all time frames. So the pink line present the last high potential area that price try to breakout , and to use it you must consider three main things : 1- price on your time frame above Ichimoku cloud. 2- RSI above 50. 3- MACD crossover. how to execute your order? when price break the pink line and close 1 minute candle .
This indicator is a huge upgrade to my original MTF MESA Plots are now extremely smooth and accurate on all timeframes ** Missing data points are automatically filled with the "best fit" This is a Trend indicator and should be used to trade "top-down" aka: Start with the Daily chart to confirm a trend Move to 4H 2H Etc... Use your favorite entry...
This study tries to highlight support and resistances as they are defined by TradingLatino TradingView user His definition is based on volume peaks on the official TradingView Volume Profile indicator that seem rather big on size. As a bonus it also serves as a rather simple volume profile indicator. As you can see it only show last blocks volume profile. It's...
Hello everyone, today I'd like to share a script, which enables you to use external logic to plot levels on your chart. How does it work? The concept is based on two scripts. One script, which uses an external input as a trigger to print a new level and one script that calculates an output, which will be fetched. Sounds complicated? It really is not! Let's...
This script is based on the approach of filtering signals by checking higher timeframes. So basically setting higher numbers in "Strength Of Levels" option, will make the indicator check for support and/or resistance levels in timeframes higher than the current. Unfortunately, I was forced to still use inefficient built-in functions pivothigh() and pivotlow(). I...