Multi Timeframe Support and Resistance [ABA Invest]About
Automatic level of support and resistance ( SnR ) in the chart. It helps users to decide where is the level of SnR and also optimize the level by changing the input base on their needs
Input:
Pivot - The number of bars left and right side of the pivot to choose how detailed the SnR level
Type - To draw the line on the candle wick endpoints or body
Timeframes option - you can choose to display other timeframes beside the current chart timeframe
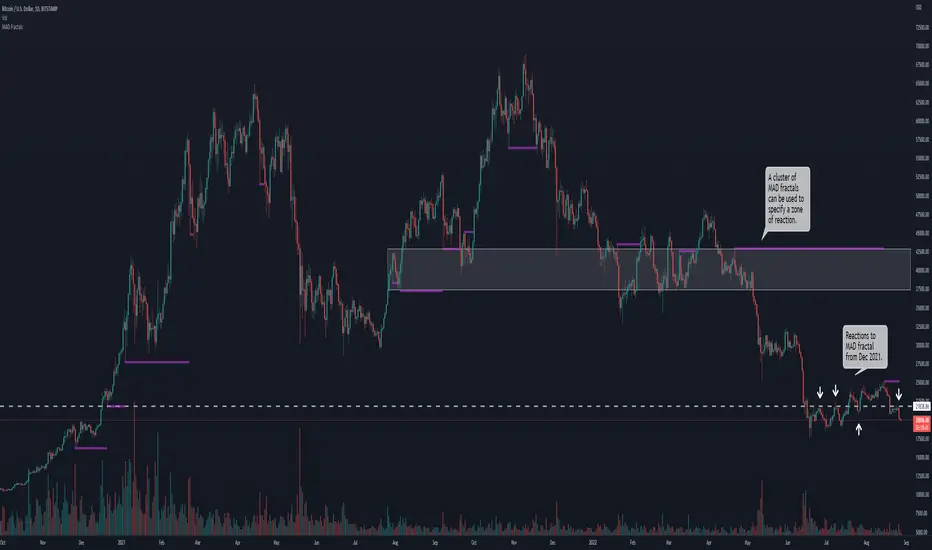
Adaptive moving average - to help users identify breaks of the SnR level with the moving average line
Line length - length of the moving average line if you activate the adaptive moving average option
How to use:
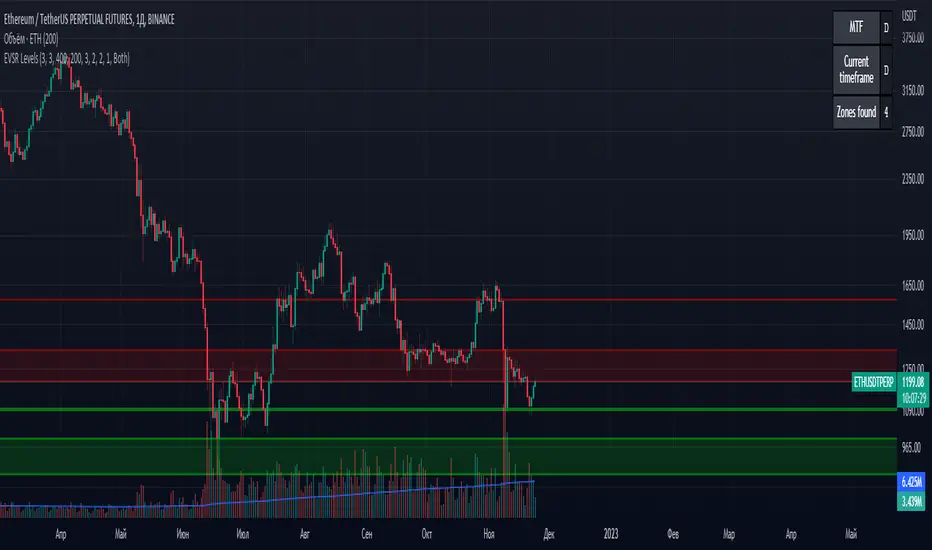
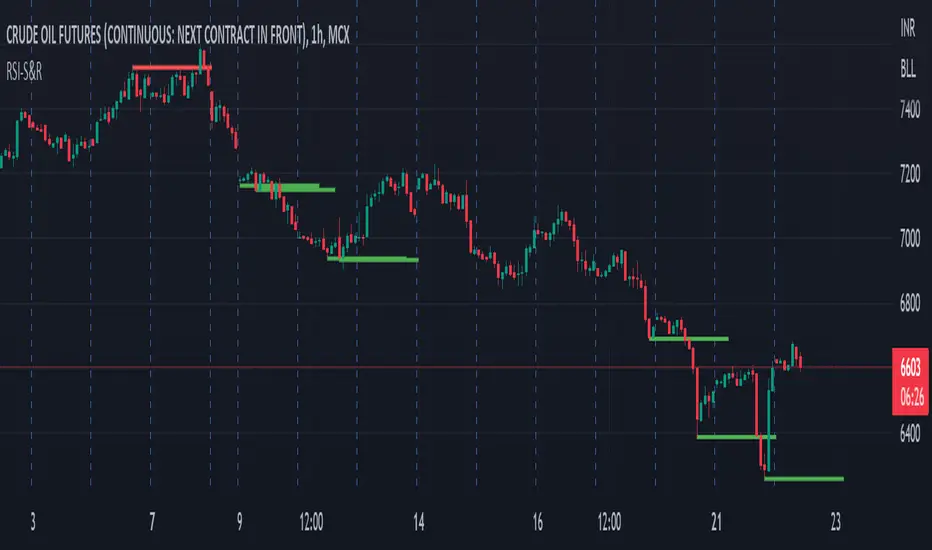
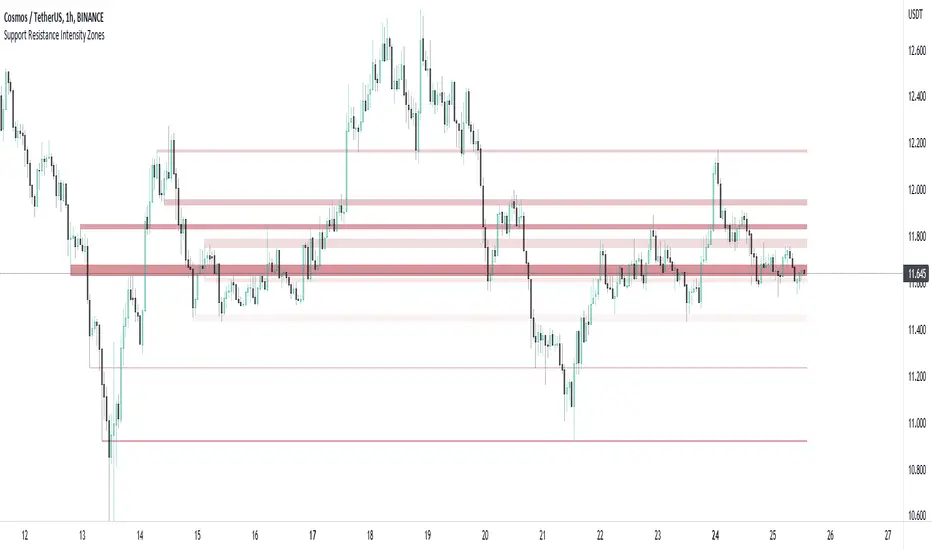
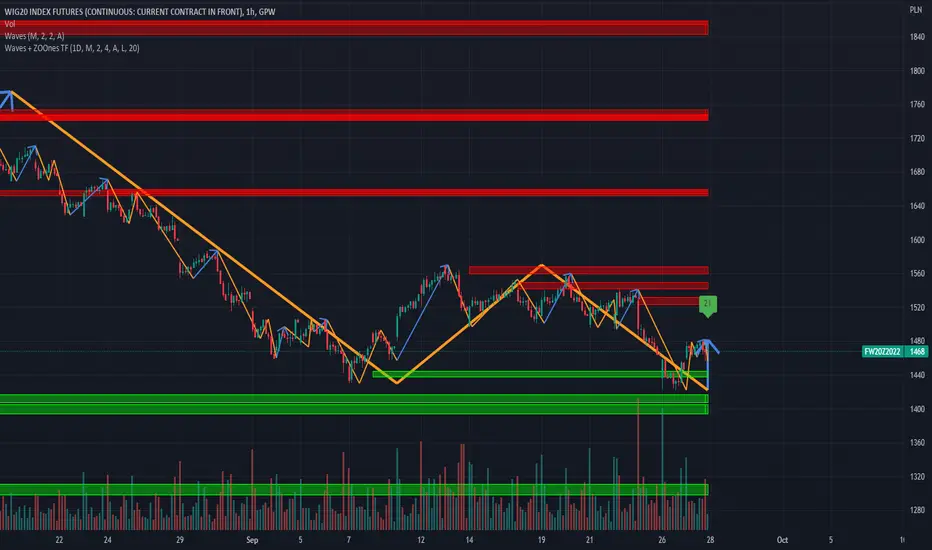
Attach the indicator to the chart and then you will find the red and green lines. Red line work as resistance level and green line works as support level and also you can merge adjacent line levels into an area of SnR.
The Adaptive moving average (AMA) line function is to see the break of SnR level and prepare for the setup.
Buy setup: AMA line break resistance level, when the price retest the support (the previous break resistance) we can enter buy trade
Sell setup: AMA line break support level, when the price retest the resistance (the previous break support) we can enter sell trade
Note: Don’t blindly follow the AMA trend signal
Penunjuk Pine Script®