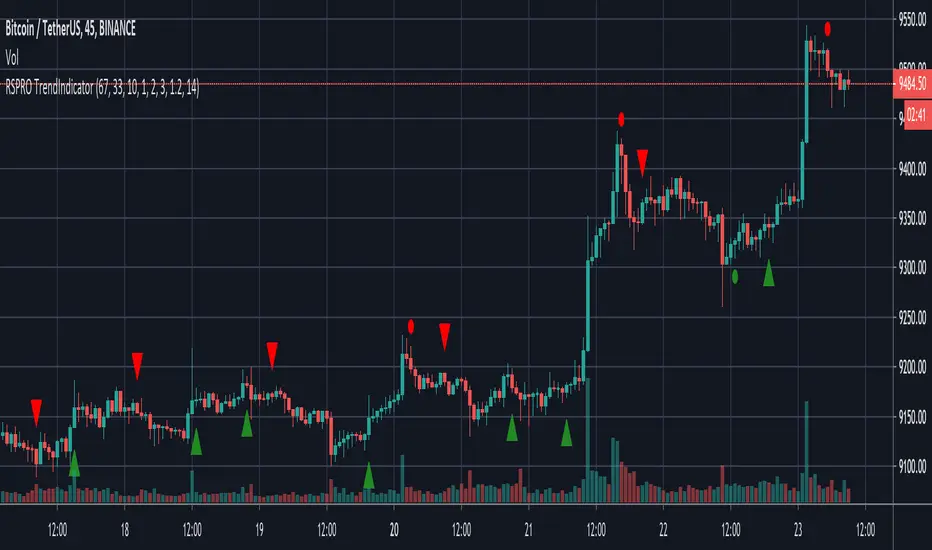
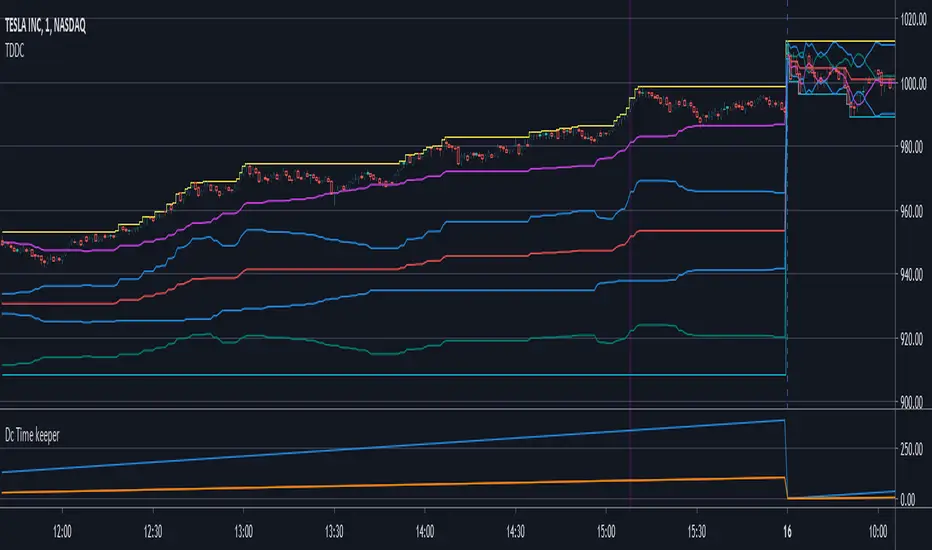
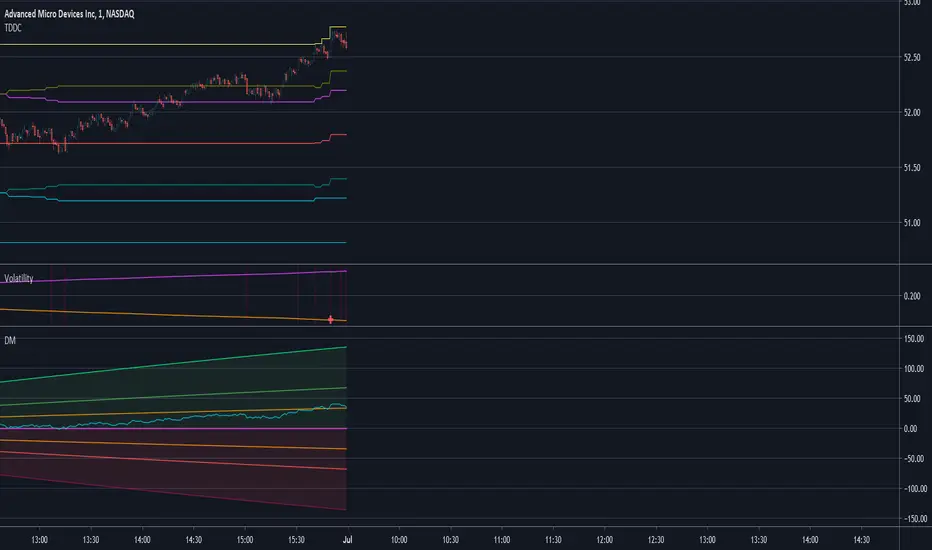
RSPRO TrendIndicatorBased on resistance/support and bollinger band fluctuations this indicator also has filter with x bars after RSI overbought/oversell zones from settings.
Indicator has alerts for LONG(BUY)/SHORT(SELL) signals with green/red squares/triangles. You can setup alerts to use different types of entries.
There are two types of entries and signals: early (usually before trend changes) and main (when trend started to reverse)
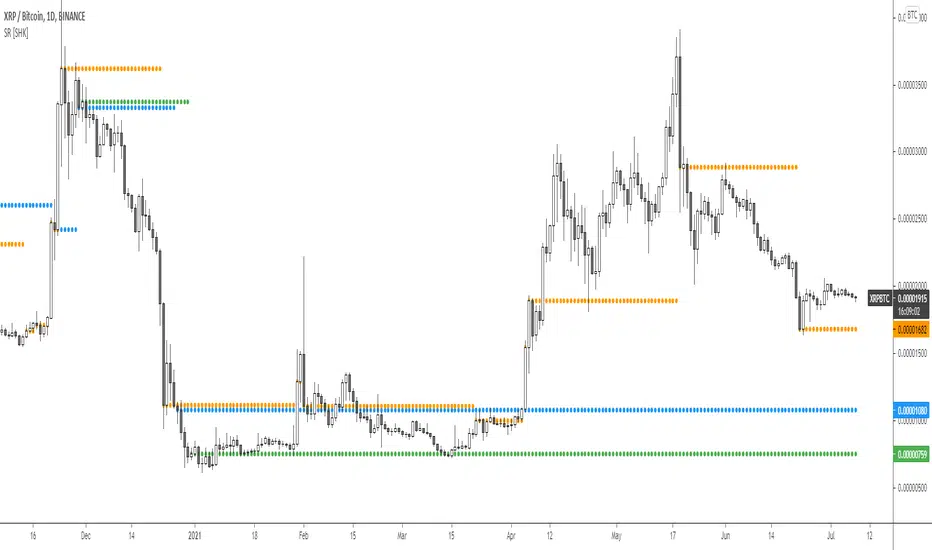
Fits for BTC and any altcoins. And any assets. Good for both scalping and position trading (depends on timeframe that you use)
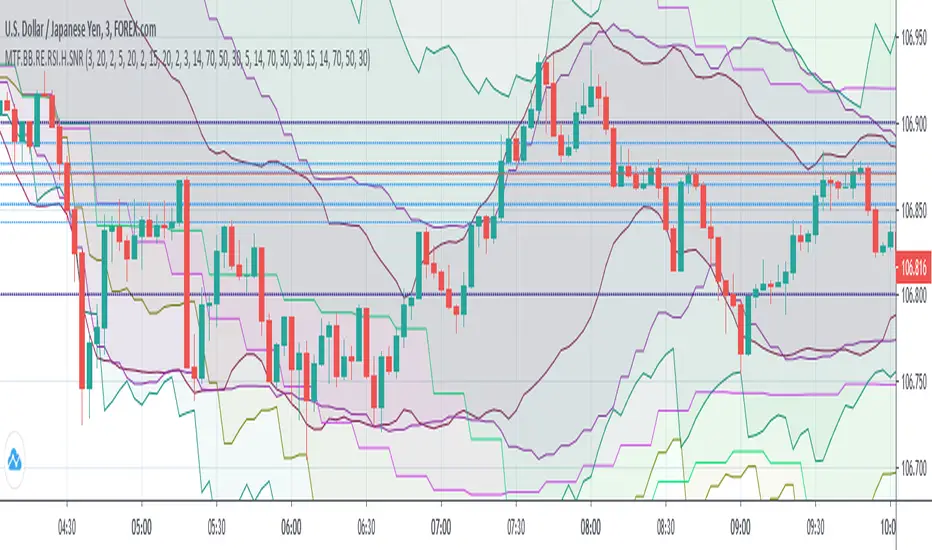
Best use it with big timeframes: 45 and 90min, 2 and 4 hours for position trading.
For scalping 5-30min timeframes are good too.
In Script settings you can specify:
1) RSI period, 14 by default.
2) Show early entries (squares), enabled by defaults.
3) Show main entries (triangles), enabled by defaults.
4) Enable/Disable filter to show main entries only after RSI overbought/oversell regions
Disabled by defaults and RSI is 67 for upper zone and 33 for lower zone.
You can also specify how many bars back before current bar this filter must do. It's 10 by default, you can vary it up to 90.
You can also use only early entries (squares)
Or only main entries (triangles)
Or both (by defaults and i recommend)
This is invite only script. PM me if you want to test it.
Penunjuk Pine Script®