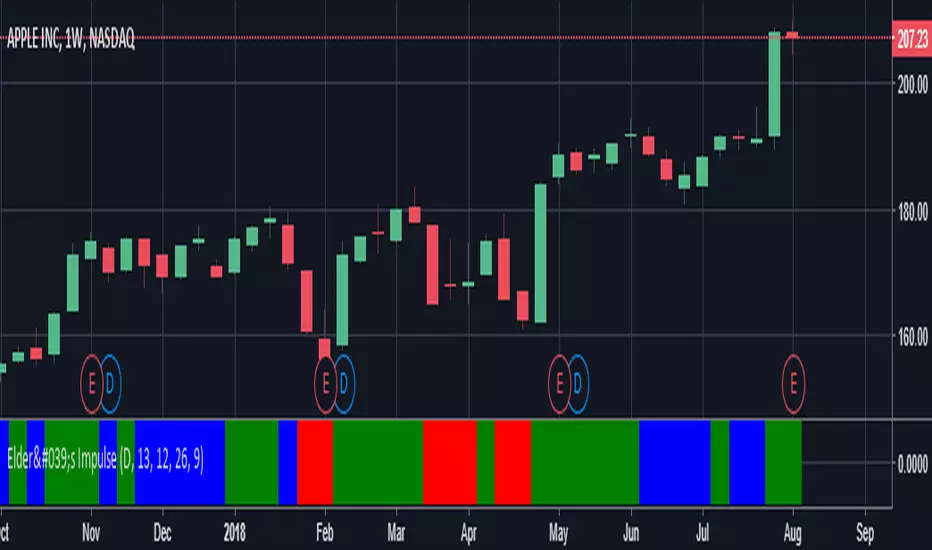
Elder's Impulse SystemSimilar indicators already published have modifications with respect to Elder's theory. This indicator fulfills literally what is described in the New Trading For A Living.
System
14/28 Day SMA Divergence and RSI - No RepaintIf you are interested in purchasing my algorithmic trading bot that receives Tradingview indicator alerts via email and then executes them in Bittrex, please visit my product page here: ilikestocks.com Additionally, I would love to create video/blog guides on creating Tradingview scripts or strategies. If you are a knowledgeable in finance or other related fields and would like to be featured on my page, please contact me at tanner@ilikestocks.com.
No crossovers were used in this script, and this is likely the reason for the no repaint(Correct me if wrong).
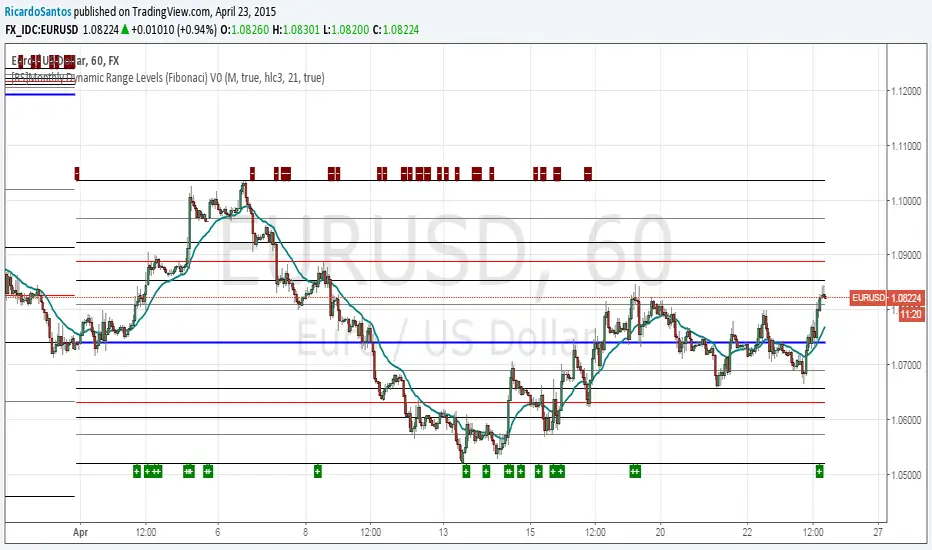
This strategy script uses a 14-day SMA signal line, a 28-day SMA and RSI. The strategy works by determining whether the (14-day SMA is above the 28-day SMA and the RSI levels are overbought(below 30)) or RSI is very overbought(below 13 or so). Once either of these conditions have been met, a long position is opened.
The initial long position must be partially closed by the take profit first and then the final close is executed if the 14-day signal SMA is below the 28-day SMA; you may also exclusively use take profit to close positions.
The green plotted spikes are the initial long position conditions. The orange plotted spikes are take profit signals once a long position is opened. The red plotted spikes are plotted when the SMA 14-day is below the 28-day SMA.
Please do leave constructive criticism or comments below because it helps me better create scripts!

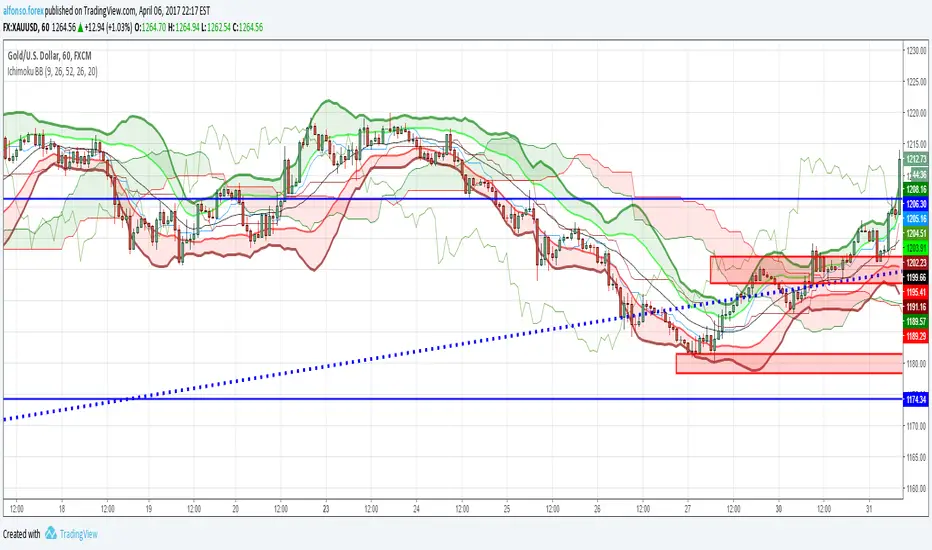
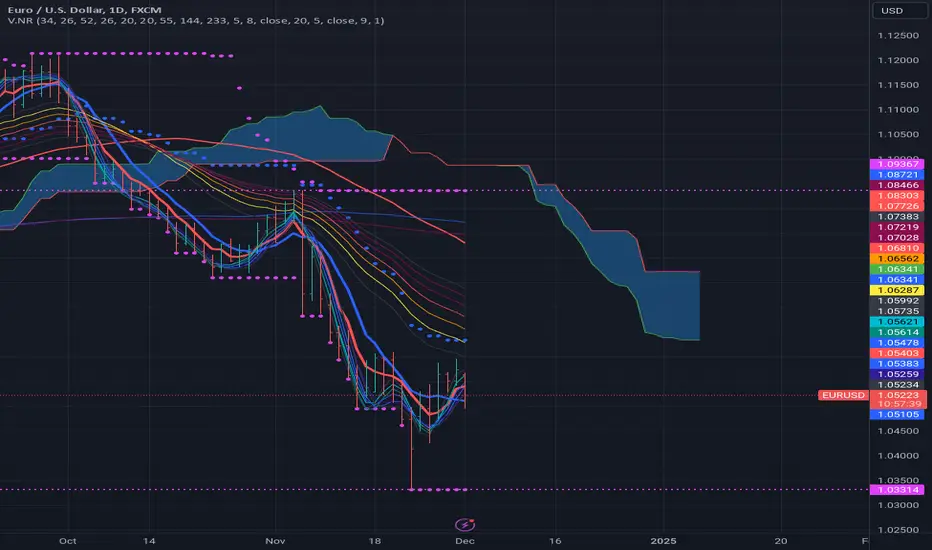
Ichimoku And DD Bollinger BandsIchimoku System Plus Double Bolliner Bands
Made in Mexico City with Love.

Chauvenet RadiusThe Chauvenet criterion is a well-known criterion of selection and rejection of the data used by the Physics. It establishes that in an experiment is well to discard the data whose distance from the average is greater than a certain number of the delta.
In the stock market if prices move away from the average with a volatility too high are suspect. This principle is embodied in the Chauvenet floor with the definition of two asymptotes and two data areas rejection.
The Chauvenet Radius is the quadratic sum of the delta (distance from average) and sigmoid (volatility) and is therefore an obvious market stability index. In fact the moments when price strongly moves away from the average with high volatility coincide with the moments of high instability of the market.
It can be considered an evolution of John Bollinger method introduced during the '80.
Source: www.performancetrading.it
Fractal Dimension Adaptive Moving Average (D-AMA)etfhq.com
Overall the D-AMA produced results that were near identical to that of the FRAMA but the D-AMA is a slightly faster average.
It is very difficult to pick between the FRAMA and the D-AMA but becuase the FRAMA offers a slightly longer trade duration it the best Moving Average we have tested so far.

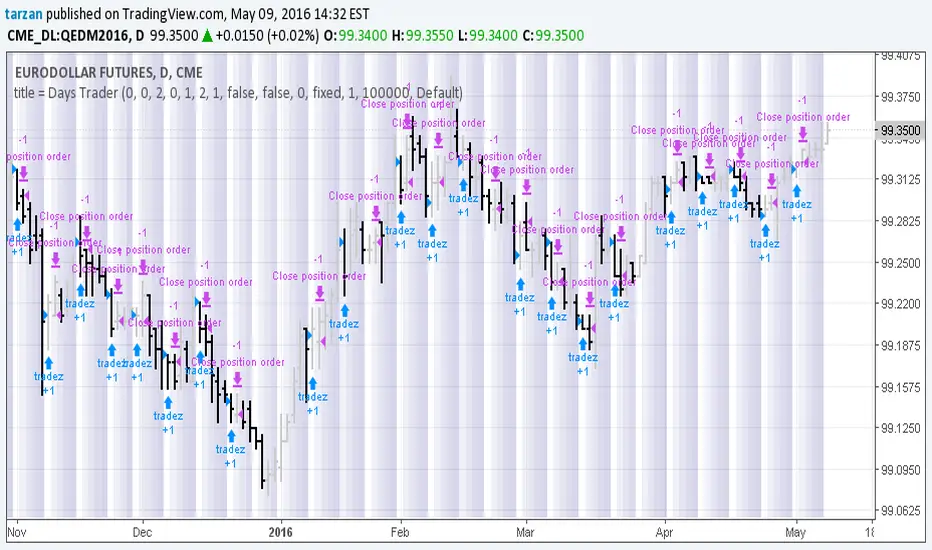
Days Trader 1.0Simple program to look for day of week or day of month patterns in chart data.
All original work by Boffin Hollow Lab
Author: Tarzan
Stock Market Trend Analysis Trading System 101 (by ChartArt)This is a very simple trading system which is measuring the core of uptrends and downtrends using three basic elements: Close price, HL2 price, Pivot price.
Depending if the uptrend or downtrend is strong, the buy/sell signals are shown in different colors. The stronger trends are in brighter colors (lime and fuchsia). If the trend just fully changed direction from uptrend to downtrend (or vice versa), there is a background color highlight in the color of the new trend direction.
The trend detection should work best on monthly charts. I have created this in under an hour. My goal was to use the least amount of rules possible, therefore there are many false signals and the code is quite lazy.
You can lose all your money if you rely on these buy/sell signals!

[RS]VDUB-TRENDMASTER IV V0.01Concept by vdubus.
Fixed a missing option on the macd inputs, added option to toggle visual style(toggle box)

[RS][JR]RSI Momentum V1RSI Momentum
By Ricardo Santos and JR
This system is a clash of two indicators, Momentum and RSI. Strength of signals are viewed by both height and color. Dark Green or Light Red bars signal strong momentum. Light Red bar signals and Green bar signals reach an apex at the top of the indicator pane.

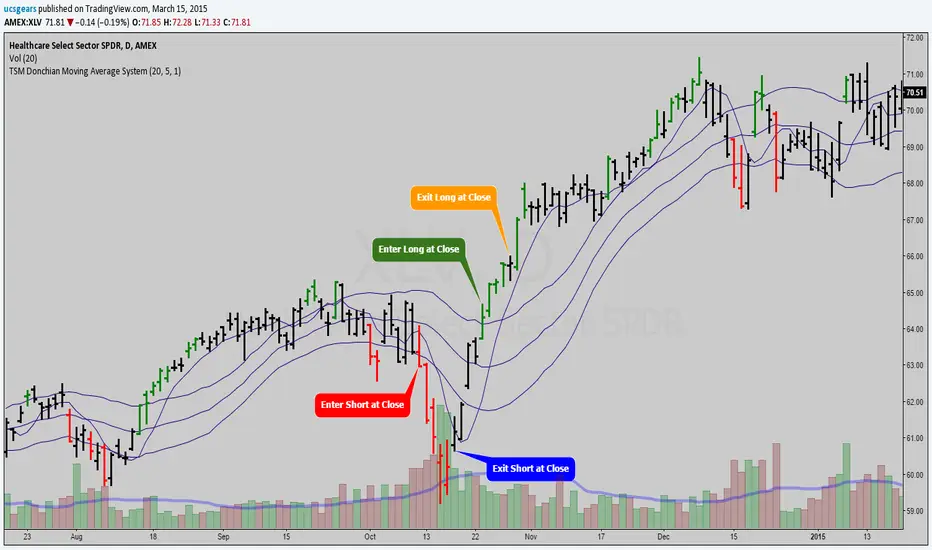
TSM Donchian Moving Average System_by_ucsgearsThis is just the raw code for the system / strategies.
Will Complete this when I get more time.
Green - Setup Long
Red - Setup Short
Ichimoku-Hausky_v2.1Made a little update to my trading system. This system is made so that you can easily follow the trend and know when to get out. You still have to know basic market structure to find a good entry.
NB!! I see that i placed the entry wrong on the example, you have too wait for the EMA to go below the MA :)
I have posted the right one at the bottom.
Take profit can be set at last low or you can use trail stop on the EMA, MA, Kijun-sen or Tenkan-sen.
Example rules:
Buy:
IF Market is in a trend or are possibly close to break out of range
THEN see if price has closed above cloud
IF price has closed above cloud
THEN see if EMA has crossed above MA
IF EMA has crossed above MA
THEN buy or wait for pullback
Sell:
IF Market is in a trend or are possibly close to break out of range
THEN see if price has closed below cloud
IF price has closed below cloud
THEN see if EMA has crossed below MA
IF EMA has crossed below MA
THEN buy or wait for pullback

Ichimoku-Hausky_v2 Trading SystemMade a new version of my trading system. I have added a cloud that is made with 45 EMA and 104 MA. Now you can choose where to set trailing stop. As shown in the example you set trailing stop under the cloud.

UCS_Murrey's Math OscillatorThis is a new indicator release, Using the principle of Murrey Math Line Trading Systems. It will be easier for someone to add alerts on an oscillator rather than a overlay.
Currently, I did add some aesthetics for those who like to view different colors, can be turned off.
Oscillator Color Definition -
Green = Above MidLine
Red = Below Midline
Blue = Below Negative 3rd Quadrant
Orange = Above Positive 3rd Quadrant
/////////
Planned future Improvement is to consider Wicks as well.
Do post your opinions and any improvement.
GL.

[RS]Moving Average Cross System V0moving average crossover with added functions:
if you want crossover with price set ma1 length to 1, or use as dual ma with both lengths, ability to turn ma's on and off leaving the crossover signals behind, ability to chose ma mode (sma, ema, rma, wma, vwma, swma and alma), ability to chose source (open, high, low, close, hl2, hlc3 or ohlc4).

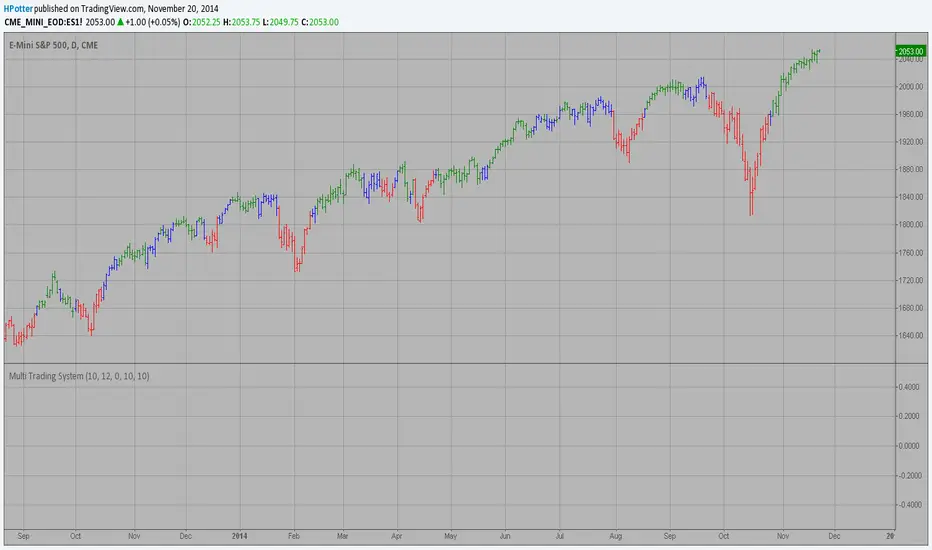
MultiTradingSystemThis is example to show how you can combine two and more strategies for get
a cumulative signal. Result signal will return 1 if two (or more) strategies
is long, -1 if all strategies is short and 0 if signals of strategies is not equal.
First strategy
Chaikin's Volatility indicator compares the spread between a security's
high and low prices. It quantifies volatility as a widening of the range
between the high and the low price.
You can use in the xPrice1 and xPrice2 any series: Open, High, Low, Close, HL2,
HLC3, OHLC4 and ect...
Secon strategy
The Moving Average Crossover trading strategy is possibly the most popular
trading strategy in the world of trading. First of them were written in the
middle of XX century, when commodities trading strategies became popular.
This strategy is a good example of so-called traditional strategies.
Traditional strategies are always long or short. That means they are never
out of the market. The concept of having a strategy that is always long or
short may be scary, particularly in today’s market where you don’t know what
is going to happen as far as risk on any one market. But a lot of traders
believe that the concept is still valid, especially for those of traders who
do their own research or their own discretionary trading.
This version uses crossover of moving average and its exponential moving average.
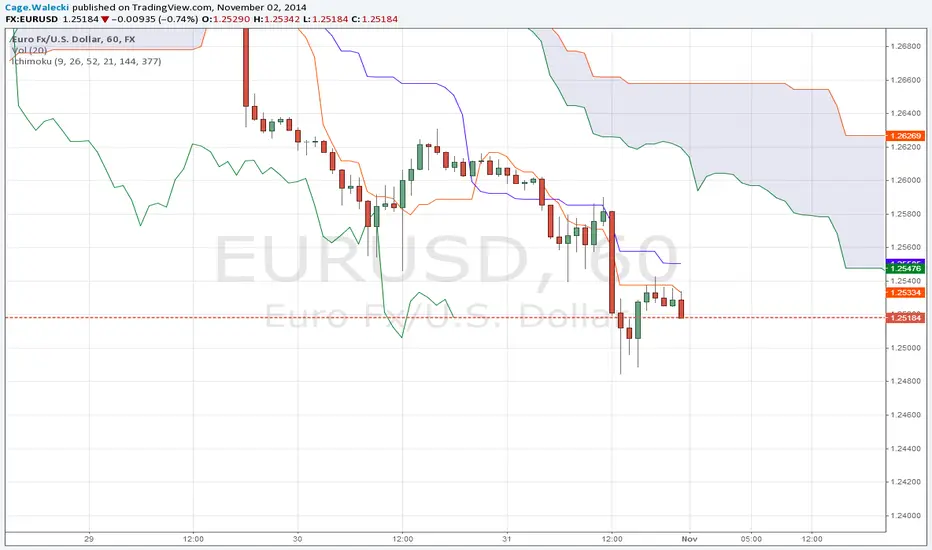
Ichimoku Cloud ALERTHi, this my new script which show you correct Ichimoku signals, when price exit cloud.
SELL SIGNAL:
- red line below blue
- green line below price
- price exit cloud bottom
- price below 3 EMA's!
BUY SIGNAL:
- red line above blue
- green line above price
- price exit cloud upper
- price above 3 EMA's!
You can change ichimoku parameters and input 3 EMA's. If u dont want use any of the EMA's then input 1 into them.
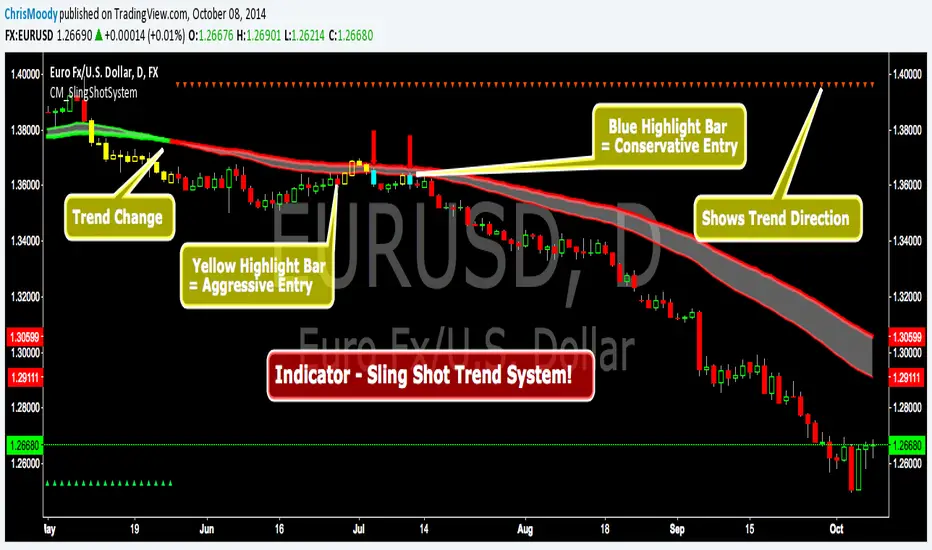
CM Sling Shot SystemSling Shot System + Even Better System.
I get this email about a Trend Following System that sells for $1000 but I could get it that day for only $500!!!
I watch the video showing this Amazing System which may have taken me an entire minute to figure out the code.
I code it up. And Hey…It’s not a bad system. It’s good for people who may need a Entry Signal to get them in a Trending Move, and KEEP them in a Trending Move while providing a defined Stop.
So I thought I would save the community the Very Fair price of Only $500 for a system that consists of a couple of EMA’s and a few Rules…and give it to you for free.
See Link Below for Main Chart Showing 2nd System!!!
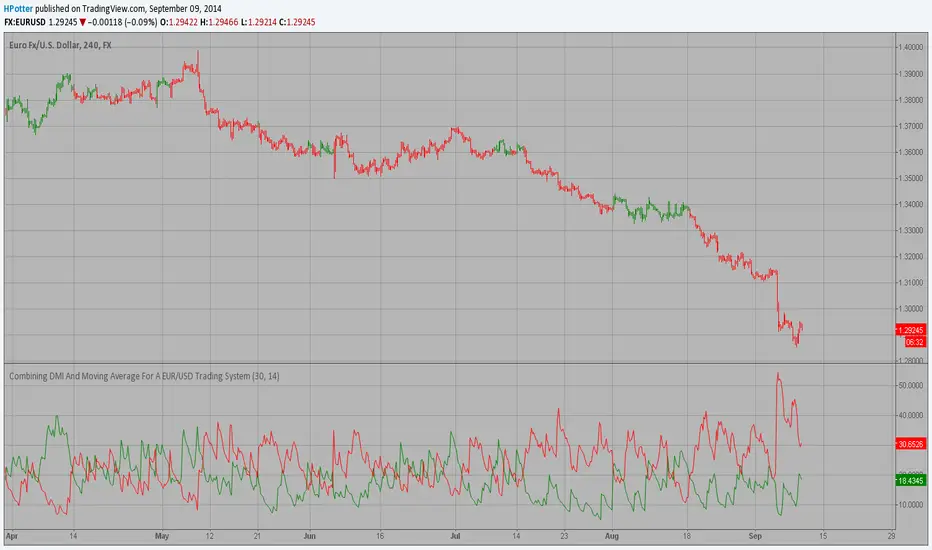
Combining DMI And Moving Average For A EUR/USD Trading SystemCombining DMI And Moving Average For A EUR/USD Trading System, by Rombout Kerstens
The related article is copyrighted material from Stocks & Commodities Aug 2009
Indicator: Elder Impulse SystemAccording to Elder, "The Impulse System encourages you to enter a trade cautiously but exit fast, by identifying inflection points where a trend speeds up or slows down. This is the professional approach to trading, the total opposite of the amateur's style. Beginners jump into trades without thinking too much and take forever to get out, hoping and waiting for the market to turn their way."
The Impulse System is based on two indicators, a 13-day exponential moving average and the MACD-Histogram. The moving average identifies the trend, while the MACD-Histogram measures momentum. As a result, the Impulse System combines trend following and momentum to identify impulses that can be traded.
By default it uses your chart's time frame, but you can set it to any custom time frame via options page. Optionally, price bars can be color coded too.
More info:
stockcharts.com
Steps to import / use custom indicators from this chart:
PDF: drive.google.com
