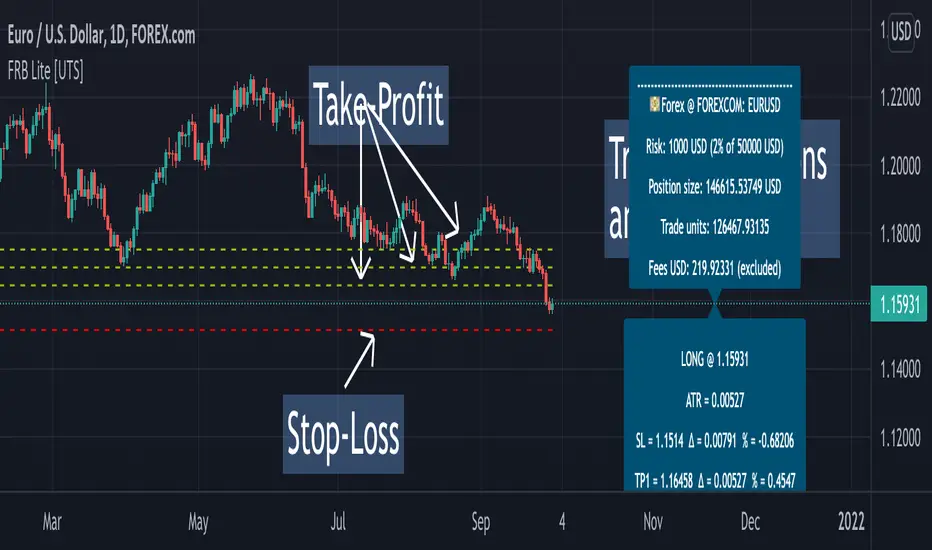
Forex Risk Buddy - Lite: Position Size, SL & TP System [UTS]Forex Risk Buddy - Lite
Position Size, Stop Loss & Take Profit System
The ultimate system to calculate trading risk on forex markets.
The 'Lite' version is limited to the EUR/USD forex trading pair.
💵 Forex
Position Sizing
De-risk possible drawdown by calculating a proper position size.
Define your risk percent based on your net value
Freely define your account currency
Trade any asset by the customizable Base / Quote currency factor
Calculate trading fees
Show all information on a customizable data screen
Stop Loss
Minimize trade risk by calculating your stop-loss.
Percent, Value and Delta display from current price
ATR based (Average True Range, modifiable)
Custom SL value possible
Adjustable
Two visual representations on chart
Automatically and real-time calculated on screen
Take Profit
Multiple take-profit levels to ensure not giving back to the market.
Up to 3 take profit levels to define
ATR based (Average True Range, modifiable)
Custom TP values possible
Easily customizable
Two visual representations on chart
Automatically and real-time calculated on screen
Currencies
Choose an account currency and calculate your risk for every trading pair.
USD
EUR
GBP
AUD
CAD
CHF
HKD
JPY
NOK
NZD
RUB
SEK
SGD
TRY
ZAR
BTC (crypto)
ETH (crypto)
USDT (crypto)
BUSD (crypto)
USDC (crypto)
Takeprofit
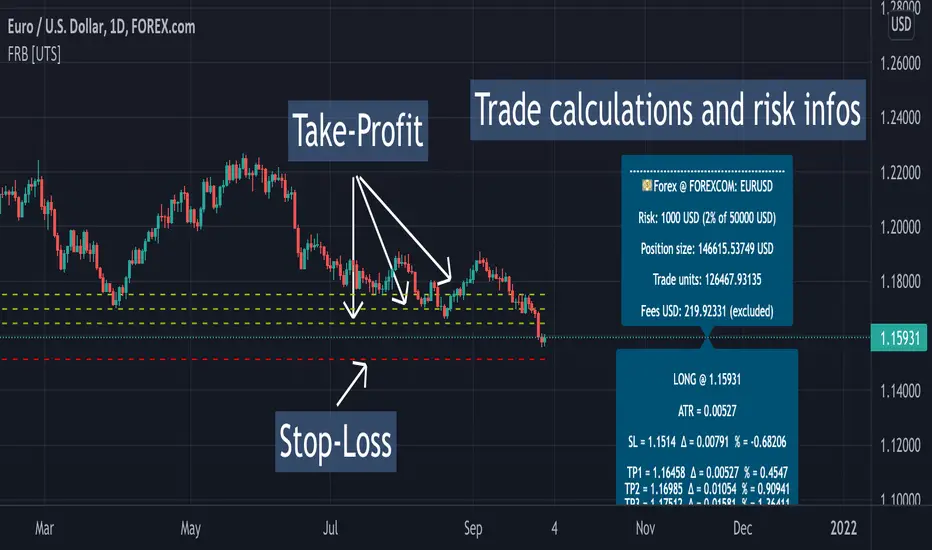
Forex Risk Buddy: Position Size, SL & TP System [UTS]Forex Risk Buddy
Position Size, Stop Loss & Take Profit System
The ultimate system to calculate trading risk on forex markets.
💵 Forex
Position Sizing
De-risk possible drawdown by calculating a proper position size.
Define your risk percent based on your net value
Freely define your account currency
Trade any asset by the customizable Base / Quote currency factor
Calculate trading fees
Show all information on a customizable data screen
Stop Loss
Minimize trade risk by calculating your stop-loss.
Percent, Value and Delta display from current price
ATR based (Average True Range, modifiable)
Custom SL value possible
Adjustable
Two visual representations on chart
Automatically and real-time calculated on screen
Take Profit
Multiple take-profit levels to ensure not giving back to the market.
Up to 3 take profit levels to define
ATR based (Average True Range, modifiable)
Custom TP values possible
Easily customizable
Two visual representations on chart
Automatically and real-time calculated on screen
Currencies
Choose an account currency and calculate your risk for every trading pair.
USD
EUR
GBP
AUD
CAD
CHF
HKD
JPY
NOK
NZD
RUB
SEK
SGD
TRY
ZAR
BTC (crypto)
ETH (crypto)
USDT (crypto)
BUSD (crypto)
USDC (crypto)
[astropark] Volume AnalyzerDear Followers,
today another awesome Analysis Tool, that you can use for day scalping: Volume Analyzer !
This indicator
works on every market, pair and timeframe
lets you see analysis of a different timeframes using the resolution parameter
has an optional trend colored background (I suggest to disable it if you use a different resolution)
integrates a tape profit strategy based on RSI (you can config it and enable/disable it)
lets you setup alarms on bull/bear signal as well as on TP RSI-based signals
I prefer to use this indicator in my day trading on low timeframes , like 5m - 15m - 1h, as you can have access to a more detailed volume information, but it works on high timeframes too as you can see in examples at the bottom of the description.
I truly think that Volume says a lot about future price action, as stated in my Cumulative Volume Delta (CVD) indicator, which you can find here below:
In this indicator, I'm much more interested in the bullish or bearish effect of volume generated by traders and following price action.
Be sure to understand that at current status this is not a complete automated strategy, but an analysis tool which aims to give you a positive bias, a profitable hedge in your trading journey.
As I always say, all tools are great if you use them correctly: this is not the "Holy Grail", so always use proper money and risk management strategies.
This indicator quite often calls bottoms and tops , most of the times it announces a coming reversals , sometimes it fails too of course.
Check this screenshot to have a clear idea of what I'm talking about:
You are supposed to discard signals of the same type that comes later and at a worse price (related to the trend) or you can use to re-fill your still-open position, using it as a re-entry.
You are supposed to act at first signals and average up/down if price goes against you when a new bear/bull signal appears at a better price.
Here it is another element you must consider: price action can deny a reversal stated by volume analysis .
In these cases, you must apply a stop loss in your trade and reverse your position. Don't average up/down your entry.
The reason in this screenshot below:
As you can see, the local downtrend was broken, as it was a simple pullback, previous bull trend was restored and price went up a lot!
The indicator here detected bears rejecting the run-up as much violently as they could, but that was a pullback, nothing more than that: main bull trend was still intact.
Another important advice: don't be greedy, always remember to take profits ! Avoid turning a winning trade into a losing one, which is a common mistake traders do.
That's why I decided to include an RSI based Take Profit algorithm inside:
when background is colored by green (and you can't see any bull signal), then you are in over bought region: start taking profits on you buy/long position or close it or set a trailing stop or a stop loss in profit!
when background is colored by red (and you can't see any bear signal), then you are in over sold region: start taking profits on you sell/short position or close it or set a trailing stop or a stop loss in profit!
when price is in a big overbought or oversold region, then you can see a "ob" label or a "os" label respectively
if you are in a bullish trend (you can see it from the trend colored green background as last signal was a "bull" one), "ob" becomes a clear "tp" - Take Profit advice
if you are in a bearish trend (you can see it from the trend colored red background as last signal was a "bear" one), "os" becomes a clear "tp" - Take Profit advice
Here some examples how you can use the signals produced by the indicator in order to be a successful trader.
I circled with pink signals you as supposed to take, then with a "$" pink backgrounded region where you are supposed to take profits, I finally put an X on failing signals, where you would theoretically have been stopped-out.
GBPUSD, 15m
ETHUSD, 1h
TSLA, 5m
BTCUSD, 15m
XAGUSD, 1h
EURUSD, 15m
SPX500, 1h
ETHUSD, 1D
ETHBTC, 6h
This is a premium indicator , so send me a private message in order to get access to this script.

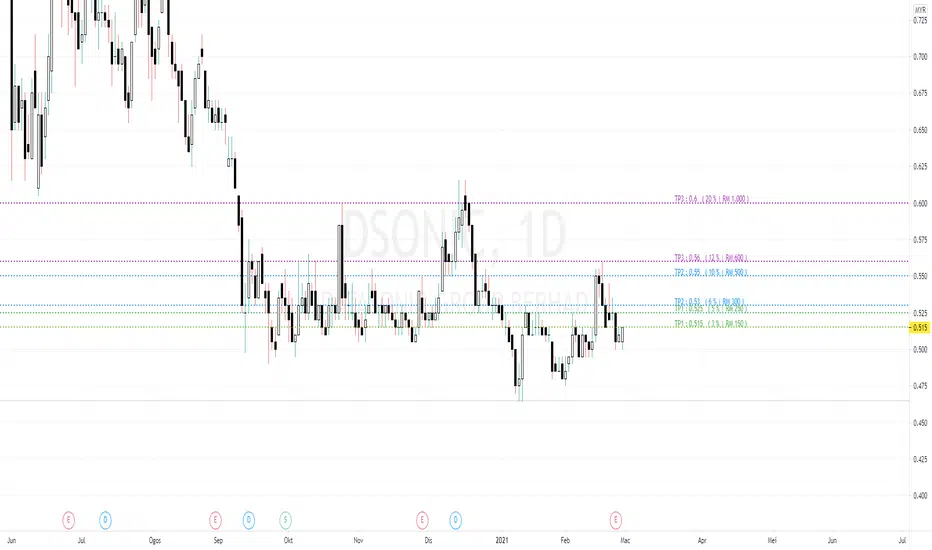
Hj7171 TP LevelThis Take Profit (TP) formula is based on my experience trading in Bursa Malaysia.
How to Use :
a) User need to key in Entry Price (EP) manually.
b) Add in share unit ( default is 10,000 unit or 100 lot
c) Indi will draw TP lines, % profit and Gross Profit automatically
Below is the TP formula :
1) Price Below 0.2
TP1 : EP + 0.005
EP + 0.010
TP2 : EP + 0.015
EP + 0.020
TP3 : EP + 0.025
EP + 0.040
2) Price Above 0.2 - 0.995
TP1 : EP + 0.015
EP + 0.025
TP2 : EP + 0.030
EP + 0.050
TP3 : EP + 0.060
EP + 0.100
3) Price Above RM 1
TP1 : EP + 0.030
EP + 0.060
TP2 : EP + 0.070
EP + 0.120
TP3 : EP + 0.130
EP + 0.240
Hope this indicator can help trader set TP properly.
Thanks
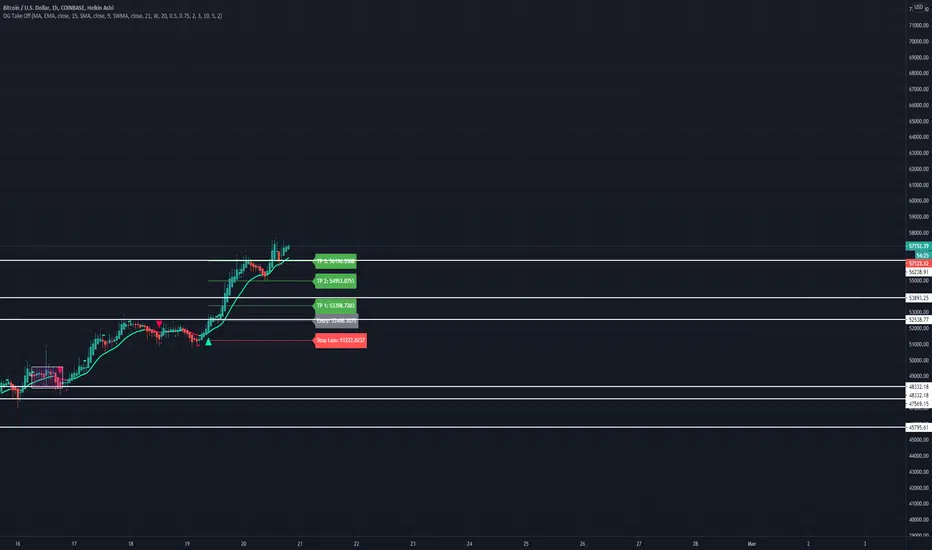
OG Take OffThis indicator is put in place to help you identify the 3 market phases.
Consolidation can be indicated by either dots or color coded candlesticks . You can use both. Consolidation zones are represented by the dotted lines.
A green arrow indicates a buy signal. A red arrow indicates a sell signal.
Theme allows you to change the color of the background to whatever you like.
To change the color of the moving average, you must uncheck "Modern Theme Trend MA Color" under 'Style'.
When price is above 50 moving average on the higher timeframe and the color of the candle is green on the higher time frame, you are in a long market. When price is below the 50 moving average and the color of the candle is red on the higher timeframe, you are in a short market.
Trend puts a trend cloud on the chart. When green and above the 50 moving average, you can assume the market is long. Look for buys on the smaller time frame. When red and below the 50 moving average, you can assume the market is short on the smaller time frame. You can also draw an average price line through the middle of the consolidation box to tell you the directional bias.
The moving average is set to 50 by default but can be changed. You can also add 2 more moving averages to the chart. (Options: SMA , EMA , SWMA , WMA , VWMA , HMA )
Consolidation on the inputs page allows you to see when the market is consolidating with dots and color change of the candlesticks . Opacity of the dots can be changed under 'Style' (Upper Band Dots/Lower Band Dots) You can assume when the dots are below the candlestick , price is buying; when the dots ae above the candlesticks , price is selling.
't' and 'b' represent tops and bottoms and can help you recognize finding the top and bottom on the daily when doing top down analysis. It can also help you recognize double tops, double bottoms, triple tops, etc.
This indicator is best used on the 1 hr or 4 hr time frame. If you zoom out on the chart, you can notice when the market is consolidating, when the market is in expansion phase, and when the market is trending. When the market is in expansion phase, you may see a lot of 'swing low/swing high' action. When the market is trending, it takes off and doesn't look back.
If you enter on the 5 min and ride the 1 hr trend, that is a great idea. If you enter on the 15 min and ride the 4 hr trend, that is an even better idea.
The TP levels can be changed according to your risk reward ratio.
Scalping using RSI 2 indicator with TP and TSLThis study implements a simply scalping using the RSI (calculated on two periods), the slopes of two MAs (EMA or SMA) having different lengths (by default, I use 50 and 200).
A take profit (%) and a trailing stop loss (%) are used.
Entry conditions:
.) Fast MA > Slow MA and Price > Slow MA and RSI < Oversold Threshold ------> go Long
.) Fast MA < Slow MA and Price < Slow MA and RSI > Overbought Threshold ------> go Short
Exit conditions:
.) Long entry condition is true and (close >= TP or close <= TSL) ----> close short position
.) Short entry condition is true and (close <= TP or close >= TSL) ----> close long position
The strategy performed best on Bitcoin and the most liquid and capitalized Altcoins but works excellent on volatile assets, mainly if they often go trending.
Works best on 3h - 4h time frame.
There's also an optional Volatility filter, which opens the position only if the difference between the two slopes is more than a specific value, which can be set in the study inputs. The purpose is not opening positions if the price goes sideways and the noise is way > than the signal.
Note:
.) the RSI length is 2;
.) the oversold Threshold is 90%;
.) the overbought Threshold is 10%;
.) by default, the take profit per cent is 0.5%;
.) by default, the trailing stop loss per cent is 0.5%;
.) by default, the fast MA length is 50;
.) by default, the slow MA length is 200;
.) by default, the MA used is EMA.
Cheers.

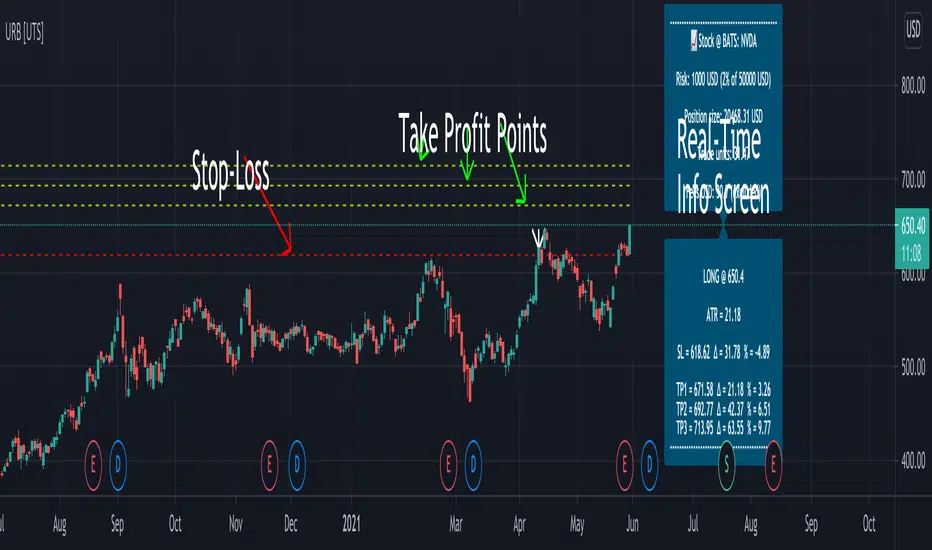
Uber Risk Buddy: Position Size, SL & TP System [UTS]
Uber Risk Buddy
Position Size, Stop Loss & Take Profit System
The ultimate system to calculate trading risk on any asset e.g.:
💰 Futures
₿ Cyptocurrencies
💵 Forex
📈 Stocks
📉 Fund
🗂️ Indices
Position Sizing
De-risk possible drawdown by calculating a proper position size:
Define your risk percent based on your net value
Freely define your account currency (Base currency)
Trade any asset by the customisable Base/ Quote currency factor
Optional trading fee calculation
Show all information on a customisable data screen
Stop Loss
Minimise trade risk by calculating your stop-loss:
Percent, Value and Delta display from current price
ATR based (Average True Range, modifiable)
Adjustable
Two visual representations on chart
Automatically and real-time calculated on screen
Take Profit
Multiple take-profit levels to ensure not giving back to the market.
Up to 3 take profit levels to define
ATR based (Average True Range, modifiable)
Easily customisable
Two visual representations on chart
Automatically and real-time calculated on screen
Indicator Access: 1 week trial available (DM for access)

OH2B Take Profit IndicatorOH2B Trading Indicator
The Take-Profit Indicator gives you exit points for taking profits based on the Average Directional Index and Relative Strength Index.
It also gives you possible swing-high and swing-low in a trend .
The OH2B Trading Indicator is an indicator that gives you entry points for BUY and SELL based on Trend Channel and Ema-Crossover.
Both indicators work better in tandem with the best result.
Trading with Both Indicators
Orange Zone : Wait for the next signal from OH2B Trading Indicator.
The OH2B Trading Indicator gives you entry points for BUY or SELL .
When the ema1 crosses above ema2, the trend channel will be painted GREEN in color, and a BUY signal will appear. = BUY
When the ema1 crosses below ema2, the trend channel will be painted RED in color, and a SELL signal will appear. = SELL
When a BUY or SELL signal appears on the chart, don't rush into any trade.
Please allow a few hours for confirmation of signals .
To take profit, please follow the Take-Profit Indicator at the bottom.
RED dots are the Take-Profit targets for the BUY (long) signal
GREEN dots are the Take-Profit targets for the SELL (short) signal
*After taking profit, please set a Stoploss to at least break-even level to protect your profits.
When the price enters the Orange Zone again, you may close your trade and wait for the next signal.
If you like to keep your positions at Orange Zone, please remember to set a stop-loss alert when an opposite signal pops up on the chart.
Often the price goes to the Trendline after the signal, so keep some funds to increase the position or even open all position near the Trendline , or use it for re-enter with SL after you closed position on TPs.

Indicator - ATR Profit Loss - DGHi Traders,
This is an on chart indicator that can be used for setting take profit and stop losses very easily using the Average True Range Indicator (ATR). Using a volatility adjusted TP and SL will allow you to set your targets and losses based on market conditions. In the settings, you are able to adjust how much of a multiplier you require depending on your risk tolerance and strategy. For those that follow the NNFX method, the defult settings are preset to 1xATR TP and 1.5xATR SL.
How to use:
- For longs, 'isLong' box must be ticked, for shorts, this box is unticked
- For longs, green line is TP, red line is SL
- For shorts, red line is TP, green line is SL
Regards,
Dillon Grech

ATR BandsIt has happened to everybody. You enter the market, the position gets a stop loss, then later the market goes in the direction you originally planned. Worse yet - you enter a position, the market goes in your favor, gets near the target, and then it reverses and you get stopped.
We brazilians call this a "violinado", or getting violinated. It happens either because:
1. You put the stop loss too close, or the target too far
2. You entered in the right direction, but at a wrong time
While the second point cannot be programmly adressed, the first can. One popular way of setting a stop loss is by using the average of the true range, it even has a built-in indicator in TV. The problem with it is that you can still get violinated, since as the trend develops, the stop loss only goes up, never down. So if you enter at the wrong time, one slip can still take you out of the market.
Since I got sick of losing money using a conventional stop loss, I made these ATR bands. When you add this indicator to your graph, 6 lines are going to show up, 3 above the price, 3 below it. These lines are calculated from the ATR of the last 20 periods (can be configurated). The upper lines are the high of the last candle + the ATR * the multiplicator factor, the lower lines are the low - ATR * multiplicator factor. There are three multiplicator factors: 1.0, 1.618 and 2.0, and you change them to be whatever you want.
The logic behind it is that theses bands represents the region in which the market is more likely to stay. So if you enter the market at 50.00, you can't expect it to reach 500.00 in the next hour if the ATR is 5.00. And if you set the stop loss at 49.99, it is very likely that the market is going to stop you. By using the ATR bands, you can get a more reasonable price range, so you would set the stop loss at 45.00 and the take profit level at 60.00.
There are two types os ATR you can use: the regular, calculated with RMA, and another using a custom WMA, which puts greater emphasis on large amplitudes. By default, the average uses the past 20 true ranges. You can also choose to use either the closing price or the extremes of the candle as a basis.
Another thing I've added is the violation statistics, which shows the percentages of the times that a band was violated in the next 5 candles (can be configurated). With this, you can get a broader view on the probability of the bands actually being reached.
You may have notice that the bands are lagged by 1 period. I did this so that there is no way you can use future data. You can disable it or increase it, but I recommend just letting it be 1. These bands are the range in which the price is most likely to stay in, if you change the lag you are essentially breaking it's whole purpose.

Cyatophilum Scalper [ALERTSETUP]This indicator comes with a backtest and alert version. This is the alert version. Its purpose is to create low timeframe and scalping strategies, by choosing from a list of built-in entry points which are described in detail below, and by configuring a risk management system to your liking.
Before diving into the entry points, I will explain the strategy and risk management settings.
These 3 settings allow to choose your strategy direction, and main behavior.
- Go Long ↗: activate or deactivate long entry points.
- Go Short ↘: activate or deactivate short entry points.
- Reversal strategy ↗↘↗↘: Activate this option will allow trades to reverse position from an opposite entry point. Keep it deactivated and trades will either wait a TakeProfit(TP) or StopLoss(SL) to be closed. When neither SL nor TP or set, this option is automatically activated.
StopLoss settings:
Both Long and Short SL can be activated and configured.
The base % price is the starting point of the stoploss, in a percentage of current price.
Trailing stop, when activated, works with 2 settings:
- % Price to Trigger: a percentage of current price the price should move in a bar to trigger a trailing movement.
- % Price Movement: the stoploss variation in a percentage of current price that moves on each bar.
TakeProfit settings:
Both Long and Short TP can be activated and configured.
The base % price is the value of the TP, in a percentage of current price.
Trailing Profit Deviation %: Percent deviation for the trailing take profit.
DCA:
DCA stands for Dollar Cost Average. The idea is to open additional orders from the base order so as to improve risk management.
These additional orders are also called Safety Orders. The indicator can handle up to 9 safety orders.
The strategy will exit either from a take profit based on percentage from base order or from a total volume percentage (Configurable in the parameters).
The steps spacing (space between each step) and safety orders volume (order size) can both scale by adding a scale multiplier.
By choosing from the base strategy dropdown menu, the indicator will generate entry points.
1. BUY SELL:
-> Low timeframes spot trading, with simple buy and sell orders.
How it works:
The indicator used is a combination of QQE (Atr based trend following indicator) and RMA 100 trendline.
I think the QQE does a great job in low timeframes because it is not impacted by the noise.
The RMA which is the moving average used in the RSI, will help giving confirmation to the entry points.
How to use:
It is meant to be used as a reversal strategy, but you can add a TP or SL if you want.
When comparing to Buy & Hold, make sure to deactivate the "Short results in the backtest" setting.
2. TREND SCALPING
-> A strategy for low timeframes trading.
How it works:
The strategy creates high volatility entries filtered by a duo convergence of adaptive trendlines (Adaptive HULL MA using the chart's resolution, Adaptive Tilson T3 using 1H resolution) and a higher timeframe (1H) RSI filter (long threshold: 70, short threshold: 40, RSI length: 10).
How to use:
Must be used on charts with a resolution smaller than 1H. Recommended: from 1m to 30m.
Must NOT be used as reversal strategy. Use it with a take profit and stop loss, and DCA if you can.
Sample risk management settings:
3. Support/Resistance BREAKOUTS
-> Trade low timeframes pivot points breakouts.
How it works:
The indicator calculates the 100 previous bars swing high and low. Any break above high or below low will trigger an entry point.
The entry is however filtered by an Adaptive Tilson T3 Trendline, an ADX 30 minimum threshold and a minimum average volume threshold.
How to use:
I recommend to click "Reversal" Strategy and set a Takeprofit target.
Find the best timeframe between 1m and 30m using the backtest version.
Example here with BTCUSDTPERP on 15m:
4. AGGRESSIVE SCALPING
-> Lots of trades in low timeframes.
How it works:
Created using Cyato AI, Higher/Lower Highs and Lows and 2 HULLMA crosses as entries, and 2 Adaptive Tilson T3 as trendfilter, a 25 ADX threshold filter and a volume filter.
How to use:
Recommended Risk Management settings: Takeprofit, Stoploss and DCA (Safety orders).
Find which timeframe work the best from 30 min and below. Should not be used above 30 min since this is the resolution for the MTF Tilson.
How to create Alerts:
Click Add alert, then select the indicator, and choose the alert for your order.
Most used alerts are "LONG ENTRY", "SHORT ENTRY" and "ALL EXITS".
You will find a description of each alert in the default alert message.
To gain access to this paid indicator, please use the link below.

[astropark] DMI/ADX strategy [alarms]Dear Followers,
today I'm happy to share with you my DMI / ADX Strategy .
It provides directional trend information, so if a bullish or a bearish trend is going to start. Statistically it works better on lower timeframes (from 5 minutes to 1 hour).
It is both a Swing and Scalping Strategy indicator , based on a simple trend following theory , good for trading FOREX, Indexes, Stocks, Commodities and Cryptocurrencies.
To help in Taking Profits, the strategy integrates 2 special other than bull/bear signals:
Overbought and Oversold RSI Signals , which appear both as darker background (the darker the color, the more the price is in overbought/oversold) and green "ob"-"tp" / red "os"-"tp" labels (they optionally pop up only on a configurable stronger overbought/oversold condition) (you can enable/disable it optionally)
Peak Profit Tracker , which resets every time a new trade starts and keeps track of price fluctuation during the trade: the message is don't be too greedy and take profits or lock them with a stoploss in profit (you can enable/disable it optionally)
You can edit many options in order to
have more/less bull/bear signals
enable/disable showing bull/bear signals
enable/disable showing RSI TP signals (you can edit RSI length, overbought (OB) and oversold (OS) levels)
enable/disable showing peak profits on each trade
The user who wants to use this strategy, especially via an automated bot, must always set a stoploss (example 150$ from entry on bitcoin ) or use a proper risk management strategy .
This is not the "Holy Grail", so use it with caution. It's highly suggested to use a proper money management .
This script will let you set all notifications you may need in order to be alerted on each triggered signals.
You can find the strategy version for backtesting here below:
Here there are some examples how this DMI / ADX strategy works on many markets:
LTC/USDT 15m
BTC/USD 15m
BNB/BTC 15m
ETH/USD 15m
GOLD (XAU/USD) 15m
GOLD (XAU/USD) 1h
FB 15m
AAPL 15m
TSLA 1h
BANKNIFTY Index 5m
NIFTY 50 Index 5m
This is a premium indicator , so send me a private message in order to get access to this script .

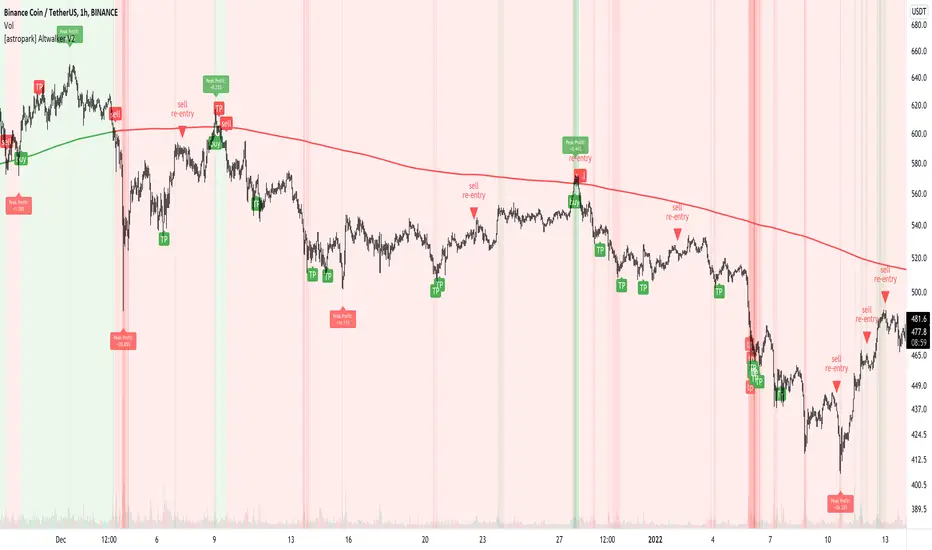
[astropark] Altwalker V2Dear Followers,
today I'm happy to share with you Altwalker V2 , an updated version of the former Altwalker for lower timeframes (from 5 minutes to 4 hours).
It is both a Swing and Scalping Strategy indicator , based on a simple trend following theory , mainly designed for Cryptocurrencies, Altcoins and of course Bitcoin.
Here you can see the Altwalker V1:
Based on Moving Average, Altwalker V2 on low timeframes dynamically identifies market resistance and support, so in which trend a cryptocurrency is during time:
green trendline and background means bullish trend , in fact it start with a "buy" signal
red trendline and background means bearish trend , in fact it start with a "sell" signal
if a series of buy and sell appears (this may happen especially in lower timeframes), this means price is in consolidation or distribution phase, so be prepared for a new trending phase coming soon, always remembering that taking profits is awesome and managing your risk by defining you position size and having a stoploss is a must in trading
To help in Taking Profits, Altwalker integrates also 2 special tools besides the trend highlighter:
Overbought and Oversold RSI Signals , which appear both as darker background (the darker the color, the more the price is in overbought/oversold) and green "ob"-"tp" / red "os"-"tp" labels (they optionally pop up only on a configurable stronger overbought/oversold condition) (you can enable/disable it optionally)
Peak Profit Tracker , which resets every time a new trade start and keeps track of price fluctuation during the trade: the message is don't be too much greedy and take profits or lock them with a stoploss in profit (you can enable/disable it optionally)
You can edit many options in order to
enable/disable showing buy/sell signals
enable/disable showing trendline
edit trendline variant (you have 2 options, by default variant 1 is selected)
enable/disable showing trend as background
enable/disable showing RSI TP signals
edit RSI length, overbought (OB) and oversold (OS) levels
enable/disable showing peak profits on each trade
The user who wants to use this strategy, especially via an automated bot, must always set a stoploss (example 150$ from entry on bitcoin ) or use a proper risk management strategy .
This is not the "Holy Grail", so use it with caution. It's highly suggested to use a proper money management .
This script will let you set all notifications you may need in order to be alerted on each triggered signals.
Here there are some examples how Altwalker V2 works on many timeframes and markets:
LINK/USDT 1h
XLM/BTC 1h
ETH/BTC 1h
ETH/USDT 1h
COMP/USDT 1h
YFI/USDT 15m
NEO/BTC 5m
VET/USDT 15m
This is a premium indicator , so send me a private message in order to get access to this script .
[NLX-L3] Alerts- Introduction: Alert Module -
This alert module is part of my powerful and flexible modular trading framework.
It can be used with any indicator that has a signal plot output (1 = long / -1 = short)
This trading framework is the result of many years experience building indicators and trading strategies.
I couldn’t find a trading framework in Pine Script that would suit my needs and so I started to design my own from scratch. I’m trading with this framework myself so I’ve made sure that it’s flexible and absolutely reliable in a live-trading environment.
- Architecture -
What makes this framework so flexible is the modular architecture, different layers that all serve a very specific purpose.
You will notice that the module names include either L1 - L2 - L3:
- Layer 1 (L1) is the base layer and the foundation. L1 indicators are used to determine the trend, volume profile and filter noise. You would use L1 to see if it’s a good time to trade, what is the direction - or if it's better to trade at all in unfavourable conditions
- Layer 2 (L2) receives the result of L1 and if the market conditions are good the L2 indicator looks for an optimal entry point to go long or short. It is possible to combine several L2 indicators and trigger a long/short signal only if all L2 indicators agree.
- Layer 3 (L3) receives the final signal from L2 and it’s where we can now backtest the result of our trading strategy and trigger trade alerts with help of the alert module.
- Features -
External Input Source (any indicator with signal plot can be used)
Safe Entries Option: Enter a trade only if the position is profitable ad the momentum allows
Pyramid Entries
Partial Take-Profit: %-Step Interval and Quantity per Step
Stop Methods: Trailing Stop, TP/SL with ATR Option, several type of stop bands...
Profit/Loss Label with Fee, Slippage and Leverage Calculation
- Additional Modules -
L3 - Backtest Module
L2 - Noise Filter
L2 - QQE++
L1 - Trend Index
Trend Matrix (Coming soon)
Dynamic Range Breakout (Coming soon)
Breakouts & Pullbacks
- Request Access -
Contact me - see my signature below

Buy/Sell/TP/SL/TSL Alerts ModuleThis tool is not a self-sufficient indicator, just an attachable module that allows you to enhance a specific indicator with risk management components without having a headache.
What you need to do, and actually this is the most important step, is to rewrite your indicator to a buy-sell signal form which will output only -1, 0, 1 values and then connect it to the module.
After that the module gives you a lot of possibilities to customize Take Profit, Stop Loss and Trailing Stop Loss levels through the settings window and to set all the alerts you need up.
Simple Buy/Sell setup for the RSI:
Now I am adding Stop Loss:
and Take Profit:
and finally Trailing Stop Loss:
Okay, I have shown how it works with RSI signals. Here is example for the MACD:
and example for the WaveTrend Oscillator:
If you have any questions don't hesitate to ask and contact me either via private messages on TradingView or via Telegram

Triple ATR multiplier - 3 ATR Values in OneHere you can choose to plot 3 different ATR values in 1 window. I use this indicator to get the values of my stop loss and take profits.
You can change the multiplier value for each ATR Line and the length of the base ATR.
Ty

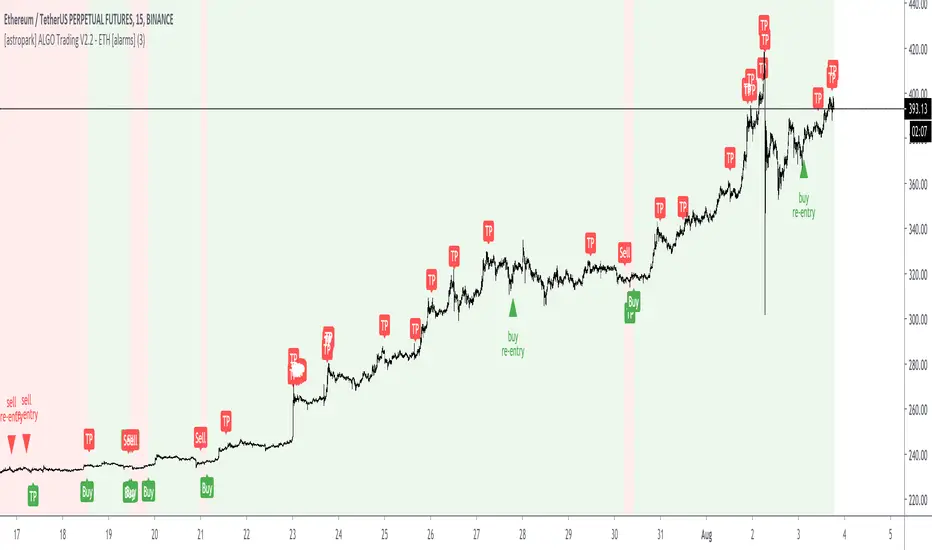
[astropark] ALGO Trading V2.2 - ETH [alarms]Dear Followers,
today another awesome Swing and Scalping Trading Strategy indicator : the upgraded version of ALGO Trading V2 for Binance Ethereum PERP on 15m timeframe!
It is runnable on a bot , just write me in order to help you do it.
If you are a scalper or you are a swing trader, you will love suggested entries for fast and long-lasting profit.
Keep in mind that a proper trailing stop strategy and risk management and money management strategies are very important (DM me if you need any clarification on these points).
This is an upgrade version of ALGO Trading V2 for Ethereum.
You can find ALGO Trading V2 indicator here below:
If you are interested in Bitcoin Trading, you will like for sure ALGO Trading V1.2, which is a customized version for Bitcoin trading:
This strategy has the following options:
enable/disable signals on chart
enable/disable bars and background coloring based on trend
enable/disable a Filter Noise option, which reduces overtrading
enable/disable a Trailing Stop option
enable/disable/config a Take Profit option, with Re-Entry
enable/disable a secret Smart Close Option which may improve profit on your chart (again, check it on you chart if it helps or not)
This strategy only trigger 1 buy (where to start a long trade) or 1 sell (for short trade). If you enable Take Profit / Stop Loss option, consider that many TP can be triggered before trend reversal, so take partial profit on every TP an eventually buy/sell back lower/higher on RE-ENTRY signal to maximize your profit.
This script will let you set all notifications you may need in order to be alerted on each triggered signals.
The one for backtesting purpose can be found by searching for the astropark's "ALGO Trading V2.2" and then choosing the indicator with "strategy" suffix in the name, or you can find here below:
This is not the "Holy Grail", so use proper money and risk management strategies.
This is a premium indicator , so send me a private message in order to get access to this script.
MACD VWAP IndicatorThis indicator uses a combination of the VWAP, EMA 9 and parts of the MACD in order to detect a bullish or bearish trend.
How to trade it:
Set SL either below or above the VWAP line (orange) and TP to 1:1.5 ratio (depending on last few candles, of course).
If EMA200 is close by then place SL either below or above EMA200 (blue) and TP to 1:1.5 ratio
Important:
Best traded in 15M, 30M => Intraday.
Have fun! :)

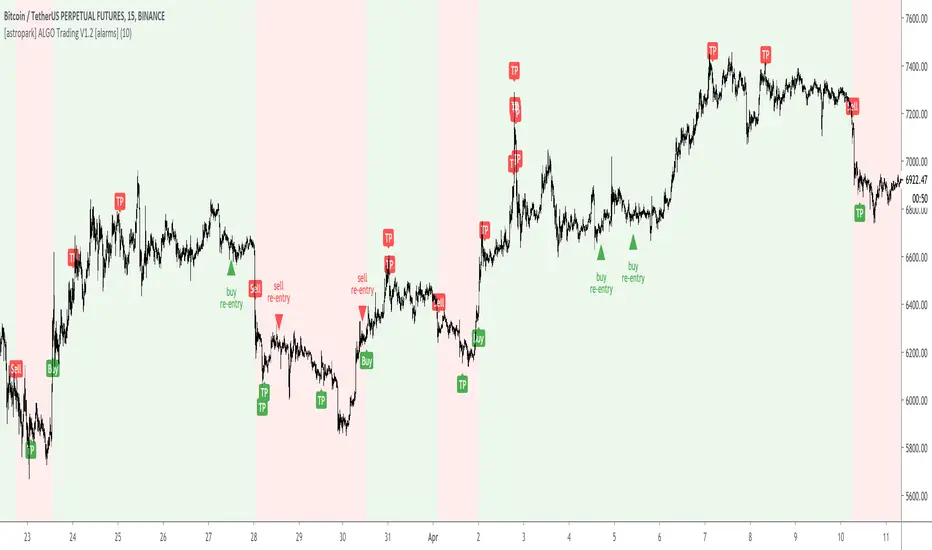
[astropark] ALGO Trading V1.2 [alarms]Dear Followers,
today another awesome Swing and Scalping Trading Strategy indicator : the upgraded version of ALGO Trading V1 for Binance Bitcoin PERP on 15m timeframe!
It is runnable on a bot , just write me in order to help you do it.
If you are a scalper or you are a swing trader, you will love suggested entries for fast and long-lasting profit.
Keep in mind that a proper trailing stop strategy and risk management and money management strategies are very important (DM me if you need any clarification on these points).
This strategy has the following options:
enable/disable signals on chart
enable/disable bars and background coloring based on trend
enable/disable a Filter Noise option, which reduces overtrading
enable/disable a Trailing Stop option
enable/disable/config a Take Profit option, with Re-Entry
enable/disable a secret Smart Close Option which may improve profit on your chart (again, check it on you chart if it helps or not)
This strategy only trigger 1 buy (where to start a long trade) or 1 sell (for short trade). If you enable Take Profit / Stop Loss option, consider that many TP can be triggered before trend reversal, so take partial profit on every TP an eventually buy/sell back lower/higher on RE-ENTRY signal to maximize your profit.
This is not the "Holy Grail", so use proper money and risk management strategies.
This indicator will let you set all alerts you need in order to get notified whenever a new signal is triggered.
To check its backtesting, you should use the strategy version, that you can find by searching for "ALGO Trading V1.2" or here below:
You can check out previous ALGO Trading V1 indicator here below:
This is a premium indicator , so send me a private message in order to get access to this script.
ATR Take Profit bandsSimple ATR-scaled levels or bands of suggested price to take profit on directional trades.

Entrate, take profit e stop loss, target 1
Questo script vuole essere un aiuto nell'impostare le operazioni a mercato giorno per giorno.
A seconda della posizione che si vuole scegliere (long o short) guardando il grafico si può essere aiutati dall'indicatore Entrare.
Le linee trasparenti verdi e arancioni sono entrate:
long: la mia entrata a mercato sarà al prezzo della riga arancione trasparente, il mio stop loss alla riga rossa, il mio tp 1 alla riga bianca superiore e il tp 2 alla riga verde.
short: la mia entrata a mercato sarà al prezzo della riga verde trasparente, il mio stop loss alla riga verde, il mio tp 1 alla riga bianca inferiore e il tp 2 alla riga rossa.
Questa semplice strategia è basata su altri due script di mia creazione che trovate a questi indirizzi:
This script is made for help people with their entry day per dar.
Depending on the position yuo decided (long or short) and whatcing the chart you can be helped by this script "Entrate".
Transparent Green and Orange line are entry points:
long: the entry point will be the transparent orange line, stop loss at red line, tp1 at upper white line and tp 2 at green line.
short: the entry point will be the transparent green line, stop loss at green line, tp1 at lower white line and tp2 at red line.
This simple strategy is based on other 2 script made by me, and you can find at these links:
Buona fortuna e Good Luck!

Market Sniper - Trading/Scalping SuiteWelcome to Market Sniper.
Market sniper is meant to be a suite for trading/scalping alongside my indicators script, RSI, Stochastic and Horizontals.
It is based on over 15 Indicators/Oscillators so there is no need for convoluted charts and constantly changing charts/indicators for a better understanding of the market.
Warnings:
I can't stress this enough! This isn't a magic pill that will transform your illiterate grandmother into an expert trader! This is a very powerful tool whose function is to complement your trading/save time (and yes, with practice be your main trading tool).
This algorithm requires setting up and training to be used correctly, please do not expect to load it up and immediately be scalping the 1s charts.
This algorithm is heavy and might require constant refreshes of the browser on slower computers.
Labels overlap at the moment, working on this part at the moment. So, always zoom in before doing a trade / change the "+- signals in settings"
Candlestick patterns need tweaking, I personally have it off and use my own judgement atm.
What it includes:
Trend reversal / continuation (Macd, Stochastics, money flow , CCI , momentum, DIOSC (automatic trendlines ), SuperTrend, Moving averages, etc, etc.)
RSI divergence drive / drive counter (base code from Libertus, check his profile as he has very helpful scripts)
Bull Market expansions for longterm take profit and increasing position
Candlestick patterns
Trend reversal / Continuation
Green = Bullish reversal
Red = Bearish trend reversal
Orange = Trend continuation / strengthening
Trend Continuation/Strengthening
A warning here, trend strengthening also means that many times the indicators are overextended or close to it
------
The numbers reflect the amount of indicators that are signaling a reversal over the specified period on the settings.
For higher timeframes this setting should be on a lower value and the opposite for lower timeframes.
This works on every market and every timeframe(according to months of my own paper and real trading). Remember that each market/asset/commodity has different soft spots so tweaking, backtesting and present accuracy review should be of maximum priority.
Bull Market expansion phase
Warning:
The indicator purposely does not show any signals during bear markets. It is my opinion bear markets complexity render this tool close to useless.
It was designed to be used in higher timeframes, tough it SEEMS to have a good track record / be useful in lower timeframes.
it will ALWAYS give a fake signal at the end of a bull market because of the very nature of the code.
It is based of EMAs, RSI and Stochastic
Candlestick Patterns
Bullish candlestick patterns:
Hammer
Inverted Hammer
Dragonfly
Gravestone
Bearish candlestick pattern:
Shooting Star
Hanging Man
Gravestone
Dragonfly
RSI divergence drive
- Credit to Libertus for the base code of this section
The green triangle means there are at least 2 drives of valid divergence, yellow for 3 and red for 4+.
The script shows triangles when confirmation candle closes.
You need to know how divergence works to use this section. investopedia can easily get you there.
For cryptos I use 2-4h+ timeframes, for traditional markets I use 15min+ for forex I use it basically in every timeframe.
For questions/suggestions and access PM me in the platform itself and don't forget -> FEEDBACK IS IMPORTANT
Thank you all
