loxxdynamiczoneLibrary "loxxdynamiczone"
Dynamic Zones
Derives Leo Zamansky and David Stendahl's Dynamic Zone,
see "Stocks & Commodities V15:7 (306-310): Dynamic Zones by Leo Zamansky, Ph .D., and David Stendahl"
What are Dynamic Zones?
As explained in "Stocks & Commodities V15:7 (306-310): Dynamic Zones by Leo Zamansky, Ph .D., and David Stendahl"
Most indicators use a fixed zone for buy and sell signals. Here’ s a concept based on zones that are responsive to past levels of the indicator.
One approach to active investing employs the use of oscillators to exploit tradable market trends. This investing style follows a very simple form of logic: Enter the market only when an oscillator has moved far above or below traditional trading lev- els. However, these oscillator- driven systems lack the ability to evolve with the market because they use fixed buy and sell zones. Traders typically use one set of buy and sell zones for a bull market and substantially different zones for a bear market. And therein lies the problem.
Once traders begin introducing their market opinions into trading equations, by changing the zones, they negate the system’s mechanical nature. The objective is to have a system automatically define its own buy and sell zones and thereby profitably trade in any market — bull or bear. Dynamic zones offer a solution to the problem of fixed buy and sell zones for any oscillator-driven system.
An indicator’s extreme levels can be quantified using statistical methods. These extreme levels are calculated for a certain period and serve as the buy and sell zones for a trading system. The repetition of this statistical process for every value of the indicator creates values that become the dynamic zones. The zones are calculated in such a way that the probability of the indicator value rising above, or falling below, the dynamic zones is equal to a given probability input set by the trader.
To better understand dynamic zones, let's first describe them mathematically and then explain their use. The dynamic zones definition:
Find V such that:
For dynamic zone buy: P{X <= V}=P1
For dynamic zone sell: P{X >= V}=P2
where P1 and P2 are the probabilities set by the trader, X is the value of the indicator for the selected period and V represents the value of the dynamic zone.
The probability input P1 and P2 can be adjusted by the trader to encompass as much or as little data as the trader would like. The smaller the probability, the fewer data values above and below the dynamic zones. This translates into a wider range between the buy and sell zones. If a 10% probability is used for P1 and P2, only those data values that make up the top 10% and bottom 10% for an indicator are used in the construction of the zones. Of the values, 80% will fall between the two extreme levels. Because dynamic zone levels are penetrated so infrequently, when this happens, traders know that the market has truly moved into overbought or oversold territory.
Calculating the Dynamic Zones
The algorithm for the dynamic zones is a series of steps. First, decide the value of the lookback period t. Next, decide the value of the probability Pbuy for buy zone and value of the probability Psell for the sell zone.
For i=1, to the last lookback period, build the distribution f(x) of the price during the lookback period i. Then find the value Vi1 such that the probability of the price less than or equal to Vi1 during the lookback period i is equal to Pbuy. Find the value Vi2 such that the probability of the price greater or equal to Vi2 during the lookback period i is equal to Psell. The sequence of Vi1 for all periods gives the buy zone. The sequence of Vi2 for all periods gives the sell zone.
In the algorithm description, we have: Build the distribution f(x) of the price during the lookback period i. The distribution here is empirical namely, how many times a given value of x appeared during the lookback period. The problem is to find such x that the probability of a price being greater or equal to x will be equal to a probability selected by the user. Probability is the area under the distribution curve. The task is to find such value of x that the area under the distribution curve to the right of x will be equal to the probability selected by the user. That x is the dynamic zone.
dZone(type, src, pval, per)
method for retrieving the dynamic zone levels from input source.
Parameters:
type : string, value of either 'buy' or 'sell'.
src : float, source, either regular source type or some other caculated value.
pval : float, probability defined by extension over/under source, a number <= 1.0.
per : int, period lookback.
Returns: float dynamic zone level.
usage:
dZone("buy", close, 0.2, 70)
Techindicator
McNichollBandsLibrary "McNichollBands"
This is a library which only functions to make the McNicholl's Bollinger Bands modifications. It's also my first library, so I'll probably screw some things up.
mcNichollBands(alpha, useLogScale, widthMultiplier)
Calculates the McNicholl's Bollinger Bands modifications.
Parameters:
alpha : The alpha constant to be used on the EMA calculations.
useLogScale : Whether to use the log version of the prices or not.
widthMultiplier : The number that shall be multiplied by the volatility to form the bands.
Returns: A tuple containing the lower band, the center line, and the upper band.
loxxrsxLibrary "loxxrsx"
loxxrsx: Jurik RSX
rsx(src, len)
rsx
Parameters:
src : float
len : int
Returns: result float

loxxpaaspecialLibrary "loxxpaaspecial"
loxxpaaspecial: Ehlers Phase Accumulation Dominant Cycle Period with multiplier and filter
paa(src, mult, filt)
(src, mult, filt)
Parameters:
src : float
mult : float
filt : float
Returns: result float
loxxfsrrdspfiltsLibrary "loxxfsrrdspfilts"
loxxfsrrdspfilts : FATL, SATL, RFTL, & RSTL Digital Signal Filters
fatl(src)
fatl
Parameters:
src : float
Returns: result float
rftl(src)
rftl
Parameters:
src : float
Returns: result float
satl(src)
satl
Parameters:
src : float
Returns: result float
rstl(src)
rstl
Parameters:
src : float
Returns: result float

loxxjuriktoolsLibrary "loxxjuriktools"
loxxjuriktools: Jurik tools used in Loxx's idicators and strategies
jcfbaux(src, len)
jcfbaux
Parameters:
src : float
len : int
Returns: result float
jcfb(src, len, len)
jcfb
Parameters:
src : float
len : int
len : int
Returns: result float
jurik_filt(src, len, phase)
jurik_filt
Parameters:
src : float
len : int
phase : float
Returns: result float
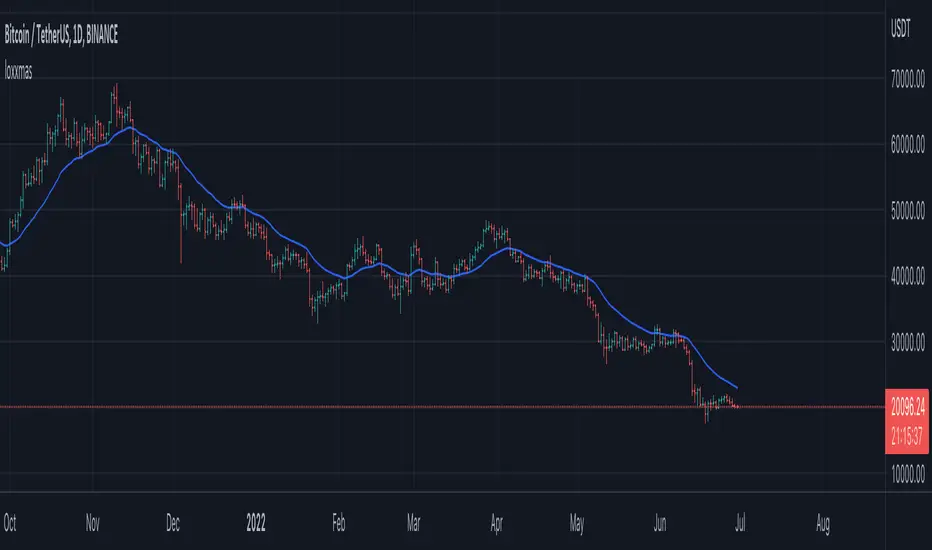
loxxmas - moving averages used in Loxx's indis & stratsLibrary "loxxmas"
TODO:loxx moving averages used in indicators
kama(src, len, kamafastend, kamaslowend)
KAMA Kaufman adaptive moving average
Parameters:
src : float
len : int
kamafastend : int
kamaslowend : int
Returns: array
ama(src, len, fl, sl)
AMA, adaptive moving average
Parameters:
src : float
len : int
fl : int
sl : int
Returns: array
t3(src, len)
T3 moving average, adaptive moving average
Parameters:
src : float
len : int
Returns: array
adxvma(src, len)
ADXvma - Average Directional Volatility Moving Average
Parameters:
src : float
len : int
Returns: array
ahrma(src, len)
Ahrens Moving Average
Parameters:
src : float
len : int
Returns: array
alxma(src, len)
Alexander Moving Average - ALXMA
Parameters:
src : float
len : int
Returns: array
dema(src, len)
Double Exponential Moving Average - DEMA
Parameters:
src : float
len : int
Returns: array
dsema(src, len)
Double Smoothed Exponential Moving Average - DSEMA
Parameters:
src : float
len : int
Returns: array
ema(src, len)
Exponential Moving Average - EMA
Parameters:
src : float
len : int
Returns: array
fema(src, len)
Fast Exponential Moving Average - FEMA
Parameters:
src : float
len : int
Returns: array
hma(src, len)
Hull moving averge
Parameters:
src : float
len : int
Returns: array
ie2(src, len)
Early T3 by Tim Tilson
Parameters:
src : float
len : int
Returns: array
frama(src, len, FC, SC)
Fractal Adaptive Moving Average - FRAMA
Parameters:
src : float
len : int
FC : int
SC : int
Returns: array
instant(src, float)
Instantaneous Trendline
Parameters:
src : float
float : alpha
Returns: array
ilrs(src, int)
Integral of Linear Regression Slope - ILRS
Parameters:
src : float
int : len
Returns: array
laguerre(src, float)
Laguerre Filter
Parameters:
src : float
float : alpha
Returns: array
leader(src, int)
Leader Exponential Moving Average
Parameters:
src : float
int : len
Returns: array
lsma(src, int, int)
Linear Regression Value - LSMA (Least Squares Moving Average)
Parameters:
src : float
int : len
int : offset
Returns: array
lwma(src, int)
Linear Weighted Moving Average - LWMA
Parameters:
src : float
int : len
Returns: array
mcginley(src, int)
McGinley Dynamic
Parameters:
src : float
int : len
Returns: array
mcNicholl(src, int)
McNicholl EMA
Parameters:
src : float
int : len
Returns: array
nonlagma(src, int)
Non-lag moving average
Parameters:
src : float
int : len
Returns: array
pwma(src, int, float)
Parabolic Weighted Moving Average
Parameters:
src : float
int : len
float : pwr
Returns: array
rmta(src, int)
Recursive Moving Trendline
Parameters:
src : float
int : len
Returns: array
decycler(src, int)
Simple decycler - SDEC
Parameters:
src : float
int : len
Returns: array
sma(src, int)
Simple Moving Average
Parameters:
src : float
int : len
Returns: array
swma(src, int)
Sine Weighted Moving Average
Parameters:
src : float
int : len
Returns: array
slwma(src, int)
linear weighted moving average
Parameters:
src : float
int : len
Returns: array
smma(src, int)
Smoothed Moving Average - SMMA
Parameters:
src : float
int : len
Returns: array
super(src, int)
Ehlers super smoother
Parameters:
src : float
int : len
Returns: array
smoother(src, int)
Smoother filter
Parameters:
src : float
int : len
Returns: array
tma(src, int)
Triangular moving average - TMA
Parameters:
src : float
int : len
Returns: array
tema(src, int)
Tripple exponential moving average - TEMA
Parameters:
src : float
int : len
Returns: array
vwema(src, int)
Volume weighted ema - VEMA
Parameters:
src : float
int : len
Returns: array
vwma(src, int)
Volume weighted moving average - VWMA
Parameters:
src : float
int : len
Returns: array
zlagdema(src, int)
Zero-lag dema
Parameters:
src : float
int : len
Returns: array
zlagma(src, int)
Zero-lag moving average
Parameters:
src : float
int : len
Returns: array
zlagtema(src, int)
Zero-lag tema
Parameters:
src : float
int : len
Returns: array
threepolebuttfilt(src, int)
Three-pole Ehlers Butterworth
Parameters:
src : float
int : len
Returns: array
threepolesss(src, int)
Three-pole Ehlers smoother
Parameters:
src : float
int : len
Returns: array
twopolebutter(src, int)
Two-pole Ehlers Butterworth
Parameters:
src : float
int : len
Returns: array
twopoless(src, int)
Two-pole Ehlers smoother
Parameters:
src : float
int : len
Returns: array
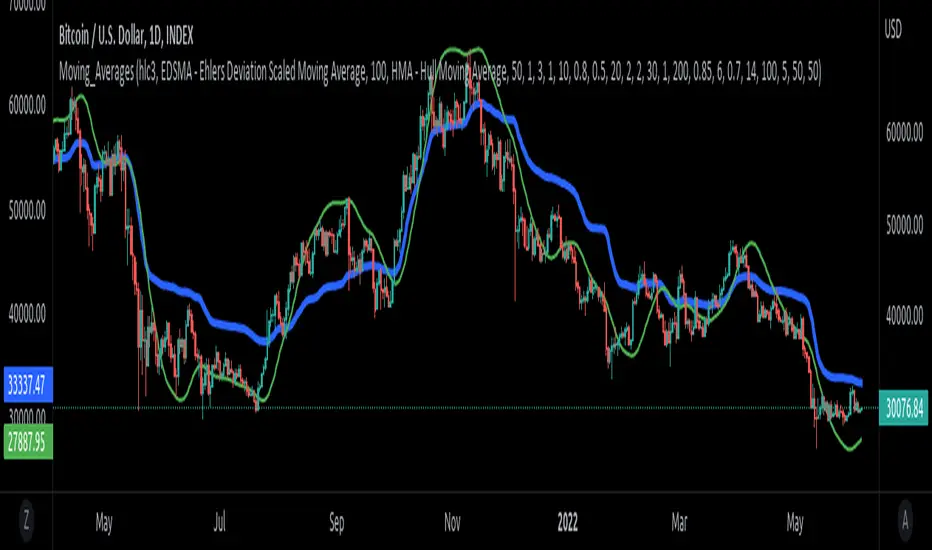
Moving_AveragesLibrary "Moving_Averages"
This library contains majority important moving average functions with int series support. Which means that they can be used with variable length input. For conventional use, please use tradingview built-in ta functions for moving averages as they are more precise. I'll use functions in this library for my other scripts with dynamic length inputs.
ema(src, len)
Exponential Moving Average (EMA)
Parameters:
src : Source
len : Period
Returns: Exponential Moving Average with Series Int Support (EMA)
alma(src, len, a_offset, a_sigma)
Arnaud Legoux Moving Average (ALMA)
Parameters:
src : Source
len : Period
a_offset : Arnaud Legoux offset
a_sigma : Arnaud Legoux sigma
Returns: Arnaud Legoux Moving Average (ALMA)
covwema(src, len)
Coefficient of Variation Weighted Exponential Moving Average (COVWEMA)
Parameters:
src : Source
len : Period
Returns: Coefficient of Variation Weighted Exponential Moving Average (COVWEMA)
covwma(src, len)
Coefficient of Variation Weighted Moving Average (COVWMA)
Parameters:
src : Source
len : Period
Returns: Coefficient of Variation Weighted Moving Average (COVWMA)
dema(src, len)
DEMA - Double Exponential Moving Average
Parameters:
src : Source
len : Period
Returns: DEMA - Double Exponential Moving Average
edsma(src, len, ssfLength, ssfPoles)
EDSMA - Ehlers Deviation Scaled Moving Average
Parameters:
src : Source
len : Period
ssfLength : EDSMA - Super Smoother Filter Length
ssfPoles : EDSMA - Super Smoother Filter Poles
Returns: Ehlers Deviation Scaled Moving Average (EDSMA)
eframa(src, len, FC, SC)
Ehlrs Modified Fractal Adaptive Moving Average (EFRAMA)
Parameters:
src : Source
len : Period
FC : Lower Shift Limit for Ehlrs Modified Fractal Adaptive Moving Average
SC : Upper Shift Limit for Ehlrs Modified Fractal Adaptive Moving Average
Returns: Ehlrs Modified Fractal Adaptive Moving Average (EFRAMA)
ehma(src, len)
EHMA - Exponential Hull Moving Average
Parameters:
src : Source
len : Period
Returns: Exponential Hull Moving Average (EHMA)
etma(src, len)
Exponential Triangular Moving Average (ETMA)
Parameters:
src : Source
len : Period
Returns: Exponential Triangular Moving Average (ETMA)
frama(src, len)
Fractal Adaptive Moving Average (FRAMA)
Parameters:
src : Source
len : Period
Returns: Fractal Adaptive Moving Average (FRAMA)
hma(src, len)
HMA - Hull Moving Average
Parameters:
src : Source
len : Period
Returns: Hull Moving Average (HMA)
jma(src, len, jurik_phase, jurik_power)
Jurik Moving Average - JMA
Parameters:
src : Source
len : Period
jurik_phase : Jurik (JMA) Only - Phase
jurik_power : Jurik (JMA) Only - Power
Returns: Jurik Moving Average (JMA)
kama(src, len, k_fastLength, k_slowLength)
Kaufman's Adaptive Moving Average (KAMA)
Parameters:
src : Source
len : Period
k_fastLength : Number of periods for the fastest exponential moving average
k_slowLength : Number of periods for the slowest exponential moving average
Returns: Kaufman's Adaptive Moving Average (KAMA)
kijun(_high, _low, len, kidiv)
Kijun v2
Parameters:
_high : High value of bar
_low : Low value of bar
len : Period
kidiv : Kijun MOD Divider
Returns: Kijun v2
lsma(src, len, offset)
LSMA/LRC - Least Squares Moving Average / Linear Regression Curve
Parameters:
src : Source
len : Period
offset : Offset
Returns: Least Squares Moving Average (LSMA)/ Linear Regression Curve (LRC)
mf(src, len, beta, feedback, z)
MF - Modular Filter
Parameters:
src : Source
len : Period
beta : Modular Filter, General Filter Only - Beta
feedback : Modular Filter Only - Feedback
z : Modular Filter Only - Feedback Weighting
Returns: Modular Filter (MF)
rma(src, len)
RMA - RSI Moving average
Parameters:
src : Source
len : Period
Returns: RSI Moving average (RMA)
sma(src, len)
SMA - Simple Moving Average
Parameters:
src : Source
len : Period
Returns: Simple Moving Average (SMA)
smma(src, len)
Smoothed Moving Average (SMMA)
Parameters:
src : Source
len : Period
Returns: Smoothed Moving Average (SMMA)
stma(src, len)
Simple Triangular Moving Average (STMA)
Parameters:
src : Source
len : Period
Returns: Simple Triangular Moving Average (STMA)
tema(src, len)
TEMA - Triple Exponential Moving Average
Parameters:
src : Source
len : Period
Returns: Triple Exponential Moving Average (TEMA)
thma(src, len)
THMA - Triple Hull Moving Average
Parameters:
src : Source
len : Period
Returns: Triple Hull Moving Average (THMA)
vama(src, len, volatility_lookback)
VAMA - Volatility Adjusted Moving Average
Parameters:
src : Source
len : Period
volatility_lookback : Volatility lookback length
Returns: Volatility Adjusted Moving Average (VAMA)
vidya(src, len)
Variable Index Dynamic Average (VIDYA)
Parameters:
src : Source
len : Period
Returns: Variable Index Dynamic Average (VIDYA)
vwma(src, len)
Volume-Weighted Moving Average (VWMA)
Parameters:
src : Source
len : Period
Returns: Volume-Weighted Moving Average (VWMA)
wma(src, len)
WMA - Weighted Moving Average
Parameters:
src : Source
len : Period
Returns: Weighted Moving Average (WMA)
zema(src, len)
Zero-Lag Exponential Moving Average (ZEMA)
Parameters:
src : Source
len : Period
Returns: Zero-Lag Exponential Moving Average (ZEMA)
zsma(src, len)
Zero-Lag Simple Moving Average (ZSMA)
Parameters:
src : Source
len : Period
Returns: Zero-Lag Simple Moving Average (ZSMA)
evwma(src, len)
EVWMA - Elastic Volume Weighted Moving Average
Parameters:
src : Source
len : Period
Returns: Elastic Volume Weighted Moving Average (EVWMA)
tt3(src, len, a1_t3)
Tillson T3
Parameters:
src : Source
len : Period
a1_t3 : Tillson T3 Volume Factor
Returns: Tillson T3
gma(src, len)
GMA - Geometric Moving Average
Parameters:
src : Source
len : Period
Returns: Geometric Moving Average (GMA)
wwma(src, len)
WWMA - Welles Wilder Moving Average
Parameters:
src : Source
len : Period
Returns: Welles Wilder Moving Average (WWMA)
ama(src, _high, _low, len, ama_f_length, ama_s_length)
AMA - Adjusted Moving Average
Parameters:
src : Source
_high : High value of bar
_low : Low value of bar
len : Period
ama_f_length : Fast EMA Length
ama_s_length : Slow EMA Length
Returns: Adjusted Moving Average (AMA)
cma(src, len)
Corrective Moving average (CMA)
Parameters:
src : Source
len : Period
Returns: Corrective Moving average (CMA)
gmma(src, len)
Geometric Mean Moving Average (GMMA)
Parameters:
src : Source
len : Period
Returns: Geometric Mean Moving Average (GMMA)
ealf(src, len, LAPercLen_, FPerc_)
Ehler's Adaptive Laguerre filter (EALF)
Parameters:
src : Source
len : Period
LAPercLen_ : Median Length
FPerc_ : Median Percentage
Returns: Ehler's Adaptive Laguerre filter (EALF)
elf(src, len, LAPercLen_, FPerc_)
ELF - Ehler's Laguerre filter
Parameters:
src : Source
len : Period
LAPercLen_ : Median Length
FPerc_ : Median Percentage
Returns: Ehler's Laguerre Filter (ELF)
edma(src, len)
Exponentially Deviating Moving Average (MZ EDMA)
Parameters:
src : Source
len : Period
Returns: Exponentially Deviating Moving Average (MZ EDMA)
pnr(src, len, rank_inter_Perc_)
PNR - percentile nearest rank
Parameters:
src : Source
len : Period
rank_inter_Perc_ : Rank and Interpolation Percentage
Returns: Percentile Nearest Rank (PNR)
pli(src, len, rank_inter_Perc_)
PLI - Percentile Linear Interpolation
Parameters:
src : Source
len : Period
rank_inter_Perc_ : Rank and Interpolation Percentage
Returns: Percentile Linear Interpolation (PLI)
rema(src, len)
Range EMA (REMA)
Parameters:
src : Source
len : Period
Returns: Range EMA (REMA)
sw_ma(src, len)
Sine-Weighted Moving Average (SW-MA)
Parameters:
src : Source
len : Period
Returns: Sine-Weighted Moving Average (SW-MA)
vwap(src, len)
Volume Weighted Average Price (VWAP)
Parameters:
src : Source
len : Period
Returns: Volume Weighted Average Price (VWAP)
mama(src, len)
MAMA - MESA Adaptive Moving Average
Parameters:
src : Source
len : Period
Returns: MESA Adaptive Moving Average (MAMA)
fama(src, len)
FAMA - Following Adaptive Moving Average
Parameters:
src : Source
len : Period
Returns: Following Adaptive Moving Average (FAMA)
hkama(src, len)
HKAMA - Hilbert based Kaufman's Adaptive Moving Average
Parameters:
src : Source
len : Period
Returns: Hilbert based Kaufman's Adaptive Moving Average (HKAMA)
bullratioLibrary "bullratio"
Calculate the profit/loss ratio of a permabull for configurable time range
bullratio(len)
calculates the profit/loss ratio for a permabull of age len
Parameters:
len : the number of candles to include in the running bull ratio - 0 for all time
Returns: series float of profit/loss percentage

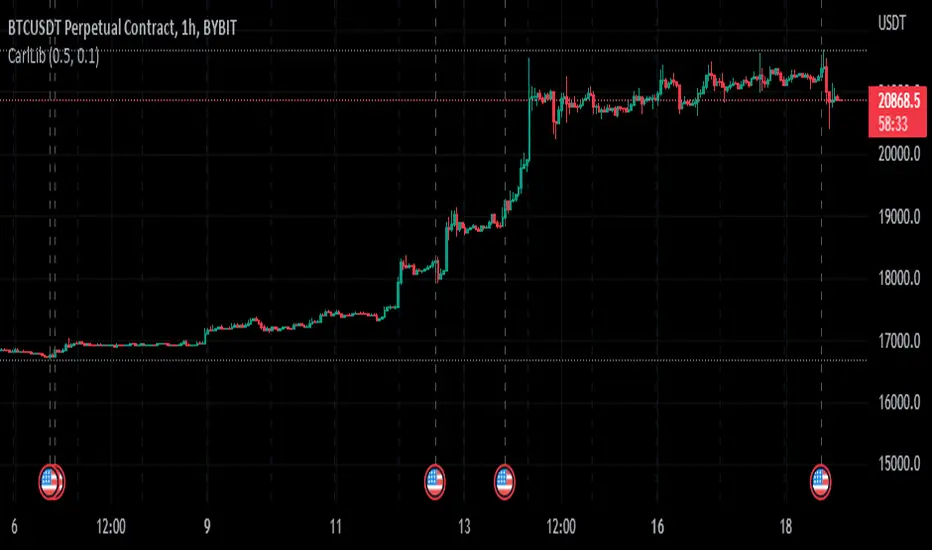
CarlLibLibrary "CarlLib"
LastLowRedHighGreen(open, close, high, close, reqChangePerc) returns values representing the high of the most recent green and the low of the most recent red
Parameters:
open : open series
close : close series
high : high series
close : close series
reqChangePerc : the minimum require change percentage for the values to switch to new ones.
Returns:
fontilabLibrary "fontilab"
Provides function's indicators for pivot - trend - resistance.
pivots(src, lenght, isHigh) Detecting pivot points (and returning price + bar index.
Parameters:
src : The chart we analyse.
lenght : Used for the calcul.
isHigh : lookging for high if true, low otherwise.
Returns: The bar index and the price of the pivot.
calcDevThreshold(tresholdMultiplier, closePrice) Calculate deviation threshold for identifying major swings.
Parameters:
tresholdMultiplier : Usefull to equilibrate the calculate.
closePrice : Close price of the chart wanted.
Returns: The deviation threshold.
calcDev(basePrice, price) Custom function for calculating price deviation for validating large moves.
Parameters:
basePrice : The reference price.
price : The price tested.
Returns: The deviation.
pivotFoundWithLines(dev, isHigh, index, price, dev_threshold, isHighLast, pLast, iLast, lineLast) Detecting pivots that meet our deviation criteria.
Parameters:
dev : The deviation wanted.
isHigh : The type of pivot tested (high or low).
index : The Index of the pivot tested.
price : The chart price wanted.
dev_threshold : The deviation treshold.
isHighLast : The type of last pivot.
pLast : The pivot price last.
iLast : Index of the last pivot.
lineLast : The lst line.
Returns: The Line and bool is pivot High.
getDeviationPivots(thresholdMultiplier, depth, lineLast, isHighLast, iLast, pLast, deleteLines, closePrice, highPrice, lowPrice) Get pivot that meet our deviation criteria.
Parameters:
thresholdMultiplier : The treshold multiplier.
depth : The depth to calculate pivot.
lineLast : The last line.
isHighLast : The type of last pivot
iLast : Index of the last pivot.
pLast : The pivot price last.
deleteLines : If the line are draw or not.
closePrice : The chart close price.
highPrice : The chart high price.
lowPrice : The chart low price.
Returns: All pivot the informations.
getElIntArrayFromEnd() Get the last element of an int array.
getElFloatArrayFromEnd() Get the last element of an float array.
getElBoolArrayFromEnd() Get the last element of a bool array.
isTrendContinuation(isTrendUp, arrayBounds, lastPrice, precision) Check if last price is between bounds array.
Parameters:
isTrendUp : Is actual trend up.
arrayBounds : The trend array.
lastPrice : The pivot Price that just be found.
precision : The percent we add to actual bounds to validate a move.
Returns: na if price is between bounds, true if continuation, false if not.
getTrendPivots(trendBarIndexes, trendPrices, trendPricesIsHigh, interBarIndexes, interPrices, interPricesIsHigh, isTrendHesitate, isTrendUp, trendPrecision, pLast, iLast, isHighLast) Function to update array and trend related to pivot trend interpretation.
Parameters:
trendBarIndexes : The array trend bar index.
trendPrices : The array trend price.
trendPricesIsHigh : The array trend is high.
interBarIndexes : The array inter bar index.
interPrices : The array inter price.
interPricesIsHigh : The array inter ishigh.
isTrendHesitate : The actual status of is trend hesitate.
isTrendUp : The actual status of is trend up.
trendPrecision : The var precision to add in "iscontinuation" function.
pLast : The last pivot price.
iLast : The last pivot bar index.
isHighLast : The last pivot "isHigh".
Returns: trend & inter arrays, is trend hesitate, is trend up.
drawBoundLines(startIndex, startPrice, endIndex, endPrice, breakingPivotIndex, breakingPivotPrice, isTrendUp) Draw bounds and breaking line of the trend.
Parameters:
startIndex : Index of the first bound line.
startPrice : Price of first bound line.
endIndex : Index of second bound line.
endPrice : price of second bound line.
breakingPivotIndex : The breaking line index.
breakingPivotPrice : The breaking line price.
isTrendUp : The actual status of the trend.
Returns: The lines bounds and breaking line.

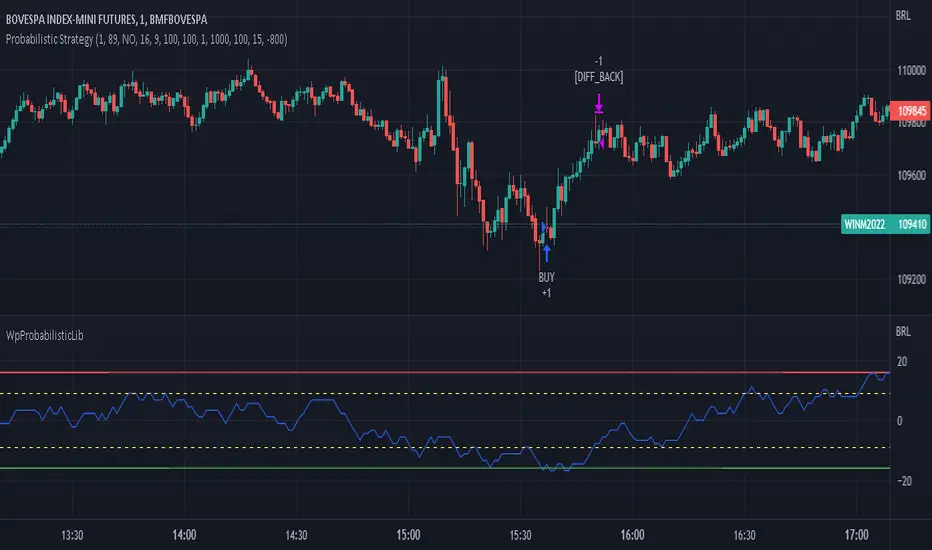
WpProbabilisticLibLibrary "WpProbabilisticLib"
Library that contains functions to calculate probabilistic based on historical candle analysis
CandleType(open, close) This function check what type of candle is, based on its close and open prices
Parameters:
open : series float (open price)
close : series float (close price)
Returns: This function return the candle type (1 for Bullish, -1 Bearish, 0 as Doji candle)
CandleTypePercentDiff(open, close, qtd_candles_before, consider_dojis) This function calculates the percentage difference between Bullish and Bearish in a candlestick range back in time and which is the type with the least occurrences
Parameters:
open : series float (open price series)
close : series float (close price series)
qtd_candles_before : simple int (Number of candles before to calculate)
consider_dojis : simple string (How to consider dojis (no consider "NO", as bearish "AS_RED", as bullish "AS_GREEN"))
Returns: tuple(float, int) (Returns the percentage difference between Bullish and Bearish candles and which type of candle has the least occurrences)
external_input_utilsLibrary "external_input_utils"
Collection of external input utilities for conversion and other hacky functions
str_to_src(value) str_to_src - Convert the string value to the coresponding source series. It can be used to limit the "input.source" choices provided to the end user.
The most interesting part is that it can be used to overcome the "one input.source call limitation" for external inputs to your script
Parameters:
value : - The string equivalent to the source to be converted
Returns: series of the coresponding source
eval_cond(input, operator, value, defval) eval_cond - Evaluate the condition given an operator
Parameters:
input : - The input to be compared with. It can be an external input or a regular one
operator : - The string operator that describe the coparison operation
value : - The value to compare with the input. This can be a serries or a constant
defval : - The boolean value to return when 'noop' is selected
Returns: series of bool the result of the operation evaluation


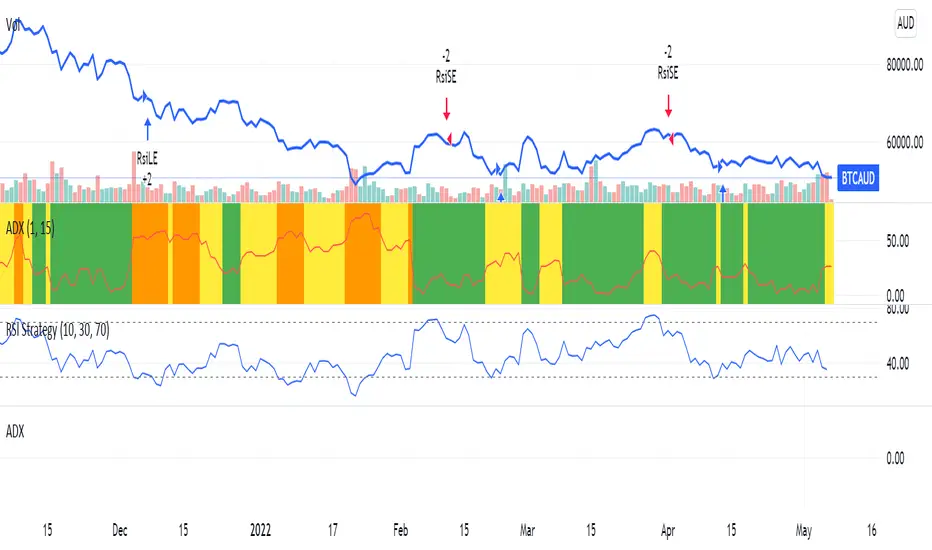
ADX FunctionsLibrary "ADX"
adx(dilen, adxLen)
Parameters:
dilen : Length of the Directional Index.
adxLen : Length (smoothing) of the Average Directional Index.
Returns:

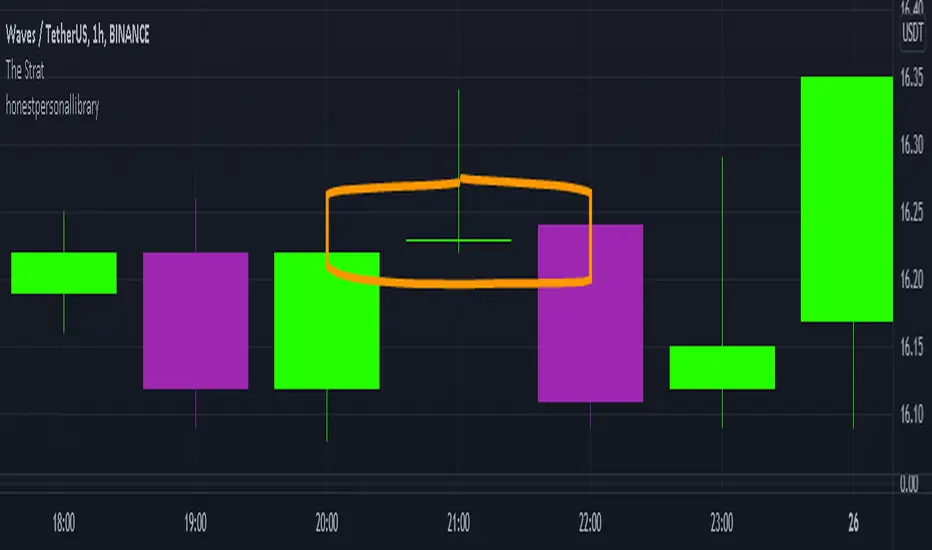
honest personal libraryLibrary "honestpersonallibrary"
thestratnumber() this will return the number 1,2 or 3 using the logic from Rob Smiths #thestrat which uses these type of bars for setups
getBodySize() Gets the current candle's body size (in POINTS, divide by 10 to get pips)
Returns: The current candle's body size in POINTS
getTopWickSize() Gets the current candle's top wick size (in POINTS, divide by 10 to get pips)
Returns: The current candle's top wick size in POINTS
getBottomWickSize() Gets the current candle's bottom wick size (in POINTS, divide by 10 to get pips)
Returns: The current candle's bottom wick size in POINTS
getBodyPercent() Gets the current candle's body size as a percentage of its entire size including its wicks
Returns: The current candle's body size percentage
strictBearPinBar(float, float) This it to find pinbars with a very long wick compared to the body that are bearish
Parameters:
float : minTopMulitplier (default=4) The minimum number of times that the top wick has to be bigger than the candle body size
float : maxBottomMultiplier (default=2) The maximum number of times that the bottom wick can be bigger than the candle body size
Returns: a bool function true if current candle is withing the parameters
strictBullPinBar(float, float) This it to find pinbars with a very long wick compared to the body that are bearish
Parameters:
float : minTopMulitplier (default=4) The minimum number of times that the top wick has to be bigger than the candle body size
float : maxBottomMultiplier (default=2) The maximum number of times that the bottom wick can be bigger than the candle body size
Returns: a bool function true if current candle is withing the parameters
Intraday High/LowLibrary "IntradayHighLow"
Provides functions calculating the intraday high/low of values.
IntradayHigh(val) Calculates the intraday high of a series.
Parameters:
val : Series to use ('high' is used if no argument is supplied).
Returns: The intraday high for the series.
IntradayLow(val) Calculates the intraday low of a series.
Parameters:
val : Series to use ('low' is used if no argument is supplied).
Returns: The intraday low for the series.

StapleIndicatorsLibrary "StapleIndicators"
This Library provides some common indicators commonly referenced from other studies in Pine Script
squeeze(bbSrc, bbPeriod, bbDev, kcSrc, kcPeriod, kcATR, signalPeriod) Volatility Squeeze
Parameters:
bbSrc : (Optional) Bollinger Bands Source. By default close
bbPeriod : (Optional) Bollinger Bands Period. By default 20
bbDev : (Optional) Bollinger Bands Standard Deviation. By default 2.0
kcSrc : (Optional) Keltner Channel Source. By default close
kcPeriod : (Optional) Keltner Channel Period. By default 20
kcATR : (Optional) Keltner Channel ATR Multiplier. By default 1.5
signalPeriod : (Optional) Keltner Channel ATR Multiplier. By default 1.5
Returns:
adx(diPeriod, adxPeriod, signalPeriod, adxTier1, adxTier2, adxTier3) ADX: Average Directional Index
Parameters:
diPeriod : (Optional) Directional Indicator Period. By default 14
adxPeriod : (Optional) ADX Smoothing. By default 14
signalPeriod : (Optional) Signal Period. By default 13
adxTier1 : (Optional) ADX Tier #1 Level. By default 20
adxTier2 : (Optional) ADX Tier #2 Level. By default 15
adxTier3 : (Optional) ADX Tier #3 Level. By default 10
Returns:
smaPreset(srcMa) Delivers a set of frequently used Simple Moving Averages
Parameters:
srcMa : (Optional) MA Source. By default 'close'
Returns:
emaPreset(srcMa) Delivers a set of frequently used Exponential Moving Averages
Parameters:
srcMa : (Optional) MA Source. By default 'close'
Returns:
maSelect(ma, srcMa) Filters and outputs the selected MA
Parameters:
ma : (Optional) MA text. By default 'Ema-21'
srcMa : (Optional) MA Source. By default 'close'
Returns: maSelected
periodAdapt(modeAdaptative, src, maxLen, minLen) Adaptative Period
Parameters:
modeAdaptative : (Optional) Adaptative Mode. By default 'Average'
src : (Optional) Source. By default 'close'
maxLen : (Optional) Max Period. By default '60'
minLen : (Optional) Min Period. By default '4'
Returns: periodAdaptative
azlema(modeAdaptative, srcMa) Azlema: Adaptative Zero-Lag Ema
Parameters:
modeAdaptative : (Optional) Adaptative Mode. By default 'Average'
srcMa : (Optional) MA Source. By default 'close'
Returns: azlema
ssma(lsmaVar, srcMa, periodMa) SSMA: Smooth Simple MA
Parameters:
lsmaVar : Linear Regression Curve.
srcMa : (Optional) MA Source. By default 'close'
periodMa : (Optional) MA Period. By default '13'
Returns: ssma
jvf(srcMa, periodMa) Jurik Volatility Factor
Parameters:
srcMa : (Optional) MA Source. By default 'close'
periodMa : (Optional) MA Period. By default '7'
Returns:
jBands(srcMa, periodMa) Jurik Bands
Parameters:
srcMa : (Optional) MA Source. By default 'close'
periodMa : (Optional) MA Period. By default '7'
Returns:
jma(srcMa, periodMa, phase) Jurik MA (JMA)
Parameters:
srcMa : (Optional) MA Source. By default 'close'
periodMa : (Optional) MA Period. By default '7'
phase : (Optional) Phase. By default '50'
Returns: jma
maCustom(ma, srcMa, periodMa, lrOffset, almaOffset, almaSigma, jmaPhase, azlemaMode) Creates a custom Moving Average
Parameters:
ma : (Optional) MA text. By default 'Ema'
srcMa : (Optional) MA Source. By default 'close'
periodMa : (Optional) MA Period. By default '13'
lrOffset : (Optional) Linear Regression Offset. By default '0'
almaOffset : (Optional) Alma Offset. By default '0.85'
almaSigma : (Optional) Alma Sigma. By default '6'
jmaPhase : (Optional) JMA Phase. By default '50'
azlemaMode : (Optional) Azlema Adaptative Mode. By default 'Average'
Returns: maTF

STPFunctionsLibrary "STPFunctions"
These functions are used as part of the STP trading strategy and include commonly used candle patterns, trade triggers and frequently monitored stock parameters
MAs() Determines if the last price is abover or below key moving averages. MAs used on the daily are SMA20, SMA50 and SMA200. SMA20 and SMA50 are used intraday.
Returns: 1 if the last price/close was over the moving averages. -1 is returned if the last price/close is below the moving averages. 0 is returned otherwise.
HTFOrderFlow(HTF1_open, HTF2_open) Determine the state of the higher time frame order flow.
Parameters:
HTF1_open : float value representing the higher time frame open.
HTF2_open : float value representing the higher time frame open.
Returns: 1 if the last price/close was over the higher time frame open. -1 is returned if the last price/close is below the higher time frame open. 0 is returned otherwise.
OrderFlow() Determine the recent order flow... basically are we well bid or well offered
Returns: 1 if the last 2 candles are well bid. -1 is returned if the last 2 candles are well offered. 0 is returned otherwise.
isInside() Used to flag inside candles
Returns: 1 if the close >= open. -1 is returned if the close <= open. 0 is returned otherwise.
isOutside() Used to flag outside or engulfing candles
Returns: 1 if the close >= open. -1 is returned if the close <= open. 0 is returned otherwise.
isUTN() Used to flag the U-turn reversal pattern
Returns: 1 for a BUTN. -1 is returned for a BRUTN. 0 is returned otherwise.
isSNapBack() Flag for Snapback Entries
Returns: 1 for a bullish snapback setup. -1 is returned for a bearish snapback setup. 0 is returned otherwise.

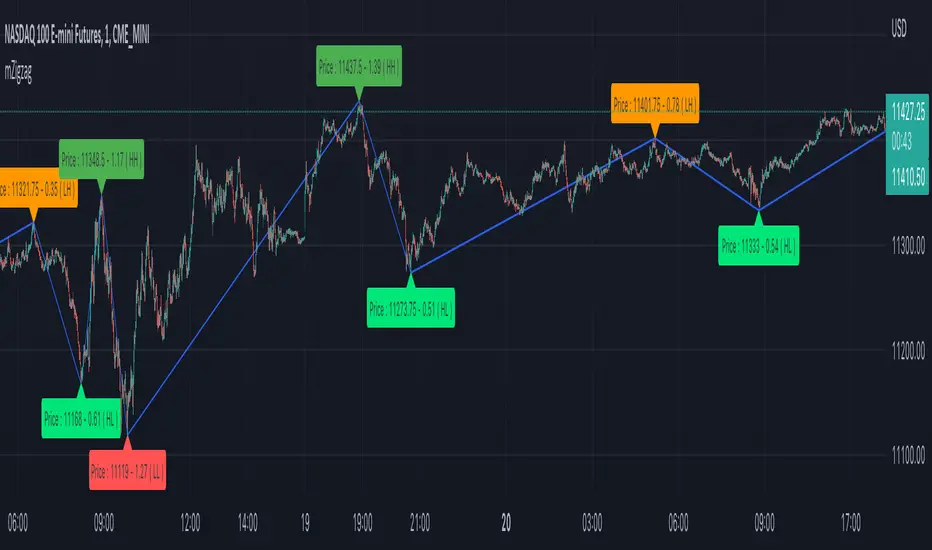
mZigzagLibrary "mZigzag"
Matrix implementation of zigzag to allow further possibilities.
Main advantage of this library over previous zigzag methods is that you can attach any number of indicator/oscillator information to zigzag
calculate(length, ohlc, indicatorHigh, indicatorLow, numberOfPivots) calculates zigzag and related information
Parameters:
length : is zigzag length
ohlc : array of OHLC values to be used for zigzag calculation
indicatorHigh : Array of indicator values calculated based on high price of OHLC
indicatorLow : Array of indicators values calculated based on low price of OHLC
numberOfPivots : Number of pivots to be returned
Returns: pivotMatrix Matrix containing zigzag pivots, pivot bars, direction, ratio, and indicators added via indicatorHigh/indicatorLow
newZG is true if a new pivot is added to array
doubleZG is true if last calculation returned two new pivots (Happens on extreme price change)
draw(length, ohlc, indicatorLabels, indicatorHigh, indicatorLow, numberOfPivots, lineColor, lineWidth, lineStyle, showHighLow, showRatios, showIndicators) draws zigzag and related information
Parameters:
length : is zigzag length
ohlc : array of OHLC values to be used for zigzag calculation
indicatorLabels : Array of name of indicators passed
indicatorHigh : Array of indicator values calculated based on high price of OHLC
indicatorLow : Array of indicators values calculated based on low price of OHLC
numberOfPivots : Number of pivots to be returned
lineColor : zigzag line color. set to blue by default
lineWidth : zigzag line width. set to 1 by default
lineStyle : zigzag line style. set to line.style_solid by default
showHighLow : show HH, HL, LH, LL labels
showRatios : show pivot retracement ratios from previous zigzag
showIndicators : show indicator values
Returns: pivotMatrix Matrix containing zigzag pivots, pivot bars, direction, ratio, and indicators added via indicatorHigh/indicatorLow
zigzaglines array of zigzag lines
zigzaglabels array of zigzag labels
Library CommonLibrary "LibraryCommon"
A collection of custom tools & utility functions commonly used with my scripts
@description TODO: add library description here
getDecimals() Calculates how many decimals are on the quote price of the current market
Returns: The current decimal places on the market quote price
truncate(float, float) Truncates (cuts) excess decimal places
Parameters:
float : number The number to truncate
float : decimalPlaces (default=2) The number of decimal places to truncate to
Returns: The given number truncated to the given decimalPlaces
toWhole(float) Converts pips into whole numbers
Parameters:
float : number The pip number to convert into a whole number
Returns: The converted number
toPips(float) Converts whole numbers back into pips
Parameters:
float : number The whole number to convert into pips
Returns: The converted number
getPctChange(float, float, int) Gets the percentage change between 2 float values over a given lookback period
Parameters:
float : value1 The first value to reference
float : value2 The second value to reference
int : lookback The lookback period to analyze
av_getPositionSize(float, float, float, float) Calculates OANDA forex position size for AutoView based on the given parameters
Parameters:
float : balance The account balance to use
float : risk The risk percentage amount (as a whole number - eg. 1 = 1% risk)
float : stopPoints The stop loss distance in POINTS (not pips)
float : conversionRate The conversion rate of our account balance currency
Returns: The calculated position size (in units - only compatible with OANDA)
bullFib(priceLow, priceHigh, fibRatio) Calculates a bullish fibonacci value
Parameters:
priceLow : The lowest price point
priceHigh : The highest price point
fibRatio : The fibonacci % ratio to calculate
Returns: The fibonacci value of the given ratio between the two price points
bearFib(priceLow, priceHigh, fibRatio) Calculates a bearish fibonacci value
Parameters:
priceLow : The lowest price point
priceHigh : The highest price point
fibRatio : The fibonacci % ratio to calculate
Returns: The fibonacci value of the given ratio between the two price points
getMA(int, string) Gets a Moving Average based on type (MUST BE CALLED ON EVERY CALCULATION)
Parameters:
int : length The MA period
string : maType The type of MA
Returns: A moving average with the given parameters
getEAP(float) Performs EAP stop loss size calculation (eg. ATR >= 20.0 and ATR < 30, returns 20)
Parameters:
float : atr The given ATR to base the EAP SL calculation on
Returns: The EAP SL converted ATR size
getEAP2(float) Performs secondary EAP stop loss size calculation (eg. ATR < 40, add 5 pips, ATR between 40-50, add 10 pips etc)
Parameters:
float : atr The given ATR to base the EAP SL calculation on
Returns: The EAP SL converted ATR size
barsAboveMA(int, float) Counts how many candles are above the MA
Parameters:
int : lookback The lookback period to look back over
float : ma The moving average to check
Returns: The bar count of how many recent bars are above the MA
barsBelowMA(int, float) Counts how many candles are below the MA
Parameters:
int : lookback The lookback period to look back over
float : ma The moving average to reference
Returns: The bar count of how many recent bars are below the EMA
barsCrossedMA(int, float) Counts how many times the EMA was crossed recently
Parameters:
int : lookback The lookback period to look back over
float : ma The moving average to reference
Returns: The bar count of how many times price recently crossed the EMA
getPullbackBarCount(int, int) Counts how many green & red bars have printed recently (ie. pullback count)
Parameters:
int : lookback The lookback period to look back over
int : direction The color of the bar to count (1 = Green, -1 = Red)
Returns: The bar count of how many candles have retraced over the given lookback & direction
getBodySize() Gets the current candle's body size (in POINTS, divide by 10 to get pips)
Returns: The current candle's body size in POINTS
getTopWickSize() Gets the current candle's top wick size (in POINTS, divide by 10 to get pips)
Returns: The current candle's top wick size in POINTS
getBottomWickSize() Gets the current candle's bottom wick size (in POINTS, divide by 10 to get pips)
Returns: The current candle's bottom wick size in POINTS
getBodyPercent() Gets the current candle's body size as a percentage of its entire size including its wicks
Returns: The current candle's body size percentage
isHammer(float, bool) Checks if the current bar is a hammer candle based on the given parameters
Parameters:
float : fib (default=0.382) The fib to base candle body on
bool : colorMatch (default=false) Does the candle need to be green? (true/false)
Returns: A boolean - true if the current bar matches the requirements of a hammer candle
isStar(float, bool) Checks if the current bar is a shooting star candle based on the given parameters
Parameters:
float : fib (default=0.382) The fib to base candle body on
bool : colorMatch (default=false) Does the candle need to be red? (true/false)
Returns: A boolean - true if the current bar matches the requirements of a shooting star candle
isDoji(float, bool) Checks if the current bar is a doji candle based on the given parameters
Parameters:
float : wickSize (default=2) The maximum top wick size compared to the bottom (and vice versa)
bool : bodySize (default=0.05) The maximum body size as a percentage compared to the entire candle size
Returns: A boolean - true if the current bar matches the requirements of a doji candle
isBullishEC(float, float, bool) Checks if the current bar is a bullish engulfing candle
Parameters:
float : allowance (default=0) How many POINTS to allow the open to be off by (useful for markets with micro gaps)
float : rejectionWickSize (default=disabled) The maximum rejection wick size compared to the body as a percentage
bool : engulfWick (default=false) Does the engulfing candle require the wick to be engulfed as well?
Returns: A boolean - true if the current bar matches the requirements of a bullish engulfing candle
isBearishEC(float, float, bool) Checks if the current bar is a bearish engulfing candle
Parameters:
float : allowance (default=0) How many POINTS to allow the open to be off by (useful for markets with micro gaps)
float : rejectionWickSize (default=disabled) The maximum rejection wick size compared to the body as a percentage
bool : engulfWick (default=false) Does the engulfing candle require the wick to be engulfed as well?
Returns: A boolean - true if the current bar matches the requirements of a bearish engulfing candle
isInsideBar() Detects inside bars
Returns: Returns true if the current bar is an inside bar
isOutsideBar() Detects outside bars
Returns: Returns true if the current bar is an outside bar
barInSession(string, bool) Determines if the current price bar falls inside the specified session
Parameters:
string : sess The session to check
bool : useFilter (default=true) Whether or not to actually use this filter
Returns: A boolean - true if the current bar falls within the given time session
barOutSession(string, bool) Determines if the current price bar falls outside the specified session
Parameters:
string : sess The session to check
bool : useFilter (default=true) Whether or not to actually use this filter
Returns: A boolean - true if the current bar falls outside the given time session
dateFilter(int, int) Determines if this bar's time falls within date filter range
Parameters:
int : startTime The UNIX date timestamp to begin searching from
int : endTime the UNIX date timestamp to stop searching from
Returns: A boolean - true if the current bar falls within the given dates
dayFilter(bool, bool, bool, bool, bool, bool, bool) Checks if the current bar's day is in the list of given days to analyze
Parameters:
bool : monday Should the script analyze this day? (true/false)
bool : tuesday Should the script analyze this day? (true/false)
bool : wednesday Should the script analyze this day? (true/false)
bool : thursday Should the script analyze this day? (true/false)
bool : friday Should the script analyze this day? (true/false)
bool : saturday Should the script analyze this day? (true/false)
bool : sunday Should the script analyze this day? (true/false)
Returns: A boolean - true if the current bar's day is one of the given days
atrFilter()
fillCell()

OscillatorPivotsLibrary "OscillatorPivots"
Measures pivots in an oscillator and flags if they are above a configurable size. Uses absolute size rather than just highest/lowest in a candle range.
f_osc_Pivots()
Uses the total change in the Y axis, instead of a simple Williams pivot over a defined number of bars. In other words, it measures the size of the actual pivot, not just whether it happens to be the highest/lowest value in a range.
Measures the absolute, cumulative change both before and after the pivot, to avoid flagging mere kinks in trends.
The advantage is that absolute pivot size is, in some cases, precisely what we care about. A disadvantage is that it can take an arbitrary, perhaps long, time to confirm.
You can configure the threshold size of the pivot so that it finds large or small pivots.
Always returns a pivot high after a pivot low, then another pivot high and so on, in order. It never returns a high followed by a high, which simple indicators based on the ta.pivot() function can do.
@param chart_H_1 This must always be set to 1, unless you are using my HighTimeframeTiming library, in which case set it to the output of the function for a _HTF_H of 1.
@param chart_H_2 This must always be set to 2, unless you are using my HighTimeframeTiming library, in which case set it to the output of the function for a _HTF_H of 2.
@param _osc This is the oscillator float value.
@param _oscPivotSize This is the user setting for what counts as a big enough change to be a pivot.
@returns Information about the pivot that is likely to be useful in further calculations:
confirmPeak, confirmDip - whether the pivot was confirmed this bar
peakBarsBack, dipBarsBack - how many bars ago the actual peak or dip was
peakPrice, dipPrice - the value of the oscillator at the peak/dip
It also returns some internal variables, which are plotted in this library only for an understanding of how the function works.
debug_peakStartLevel, debug_dipStartLevel - The level of the currently active peak/dip
