Strategy TemplateTrying to include few basic things which is needed for strategy which can be used as template.
Few important components
Strategy parameters
Few important parameters include - initial_capital, default_qty_type, default_qty_value, commission_type, pyramiding and commission_value. All my strategies will have similar settings with initial captial set to 20000 to 100000. 100% of equity per trade with no pyramiding (set to 1) and minimal commission.
margin_long and margin_short can be used for leveraged trading. But, since we are not using pyramiding, it will make no effect.
Trade Limiting parameters
Two types of limiting is available in the scripts
Limiting trading direction : this is done through method strategy.risk.allow_entry_in and input parameter tradeDirection
Limiting trades to particular time window : This is achieved through adding start time and end time parameters of type input.time and check whether time is within this window
Custom Methods
customized security method to get higher timeframe data
customized moving average method to get moving average of any type
Custom Parameters
Moving average Type option list which I use quite often. Any strategy where there is need to use moving average, I try to scan through different moving average types and lengths to see which one is more appropriate for the given strategy. Hence, keeping this parameter in template to make it readily available when I start with new strategy
waitForCloseBeforeExit - this is used if trailing stop need to activated as soon as price hits the stop or only on close price. This is again something I switch quite often based on strategy. Hence, keeping this as part of the template.
Entry and Exit statements for long and short
These statements from line (57 to 62) can remain as is even with new strategy. Only thing to be set are variables - buyCondition, sellCondition, closeBuyCondition and closeSellCondition
Last but not the least
In pinescript, a long and short position cannot coexist in a strategy at any point of time. Any short positions created will automatically stop long positions and vice versa. Hence, it is important make short and long trades mutually exclusive. In this example, I have used 200 weekly moving average as trend bias. No short positions are taken when price is trading above 200 weekly moving average low/close and no long positions are taken when price is less than 200 weekly moving average high/close. Any rule built on top of this (In this case a simple supertrend rules) ensures that there are no conflicting signals and hence avoids confusing trades on the stratgy.
Template

Risk Reduction Ultimate TemplateThis is a template not actually meant for trading. I picked two random oscillators. This is a template meant to turn into a live trading strategy, however.
It's literally just a specialized take profit/stop loss system. It is to ensure your bot doesn't make any bad moves that you wouldn't have manually. The code should be pretty well annotated. Putting this into my scripts has made them much better. I will work on a Multiple Trigger template next.

Ultimate Strategy TemplateHello Traders
As most of you know, I'm a member of the PineCoders community and I sometimes take freelance pine coding jobs for TradingView users.
Off the top of my head, users often want to:
- convert an indicator into a strategy, so as to get the backtesting statistics from TradingView
- add alerts to their indicator/strategy
- develop a generic strategy template which can be plugged into (almost) any indicator
My gift for the community today is my Ultimate Strategy Template
Step 1: Create your connector
Adapt your indicator with only 2 lines of code and then connect it to this strategy template.
For doing so:
1) Find in your indicator where are the conditions printing the long/buy and short/sell signals.
2) Create an additional plot as below
I'm giving an example with a Two moving averages cross.
Please replicate the same methodology for your indicator wether it's a MACD, ZigZag, Pivots, higher-highs, lower-lows or whatever indicator with clear buy and sell conditions
//@version=4
study(title='Moving Average Cross', shorttitle='Moving Average Cross', overlay=true, precision=6, max_labels_count=500, max_lines_count=500)
type_ma1 = input(title="MA1 type", defval="SMA", options= )
length_ma1 = input(10, title = " MA1 length", type=input.integer)
type_ma2 = input(title="MA2 type", defval="SMA", options= )
length_ma2 = input(100, title = " MA2 length", type=input.integer)
// MA
f_ma(smoothing, src, length) =>
iff(smoothing == "RMA", rma(src, length),
iff(smoothing == "SMA", sma(src, length),
iff(smoothing == "EMA", ema(src, length), src)))
MA1 = f_ma(type_ma1, close, length_ma1)
MA2 = f_ma(type_ma2, close, length_ma2)
// buy and sell conditions
buy = crossover(MA1, MA2)
sell = crossunder(MA1, MA2)
plot(MA1, color=color_ma1, title="Plot MA1", linewidth=3)
plot(MA2, color=color_ma2, title="Plot MA2", linewidth=3)
plotshape(buy, title='LONG SIGNAL', style=shape.circle, location=location.belowbar, color=color_ma1, size=size.normal)
plotshape(sell, title='SHORT SIGNAL', style=shape.circle, location=location.abovebar, color=color_ma2, size=size.normal)
/////////////////////////// SIGNAL FOR STRATEGY /////////////////////////
Signal = buy ? 1 : sell ? -1 : 0
plot(Signal, title="🔌Connector🔌", transp=100)
Basically, I identified my buy, sell conditions in the code and added this at the bottom of my indicator code
Signal = buy ? 1 : sell ? -1 : 0
plot(Signal, title="🔌Connector🔌", transp=100)
Important Notes
🔥 The Strategy Template expects the value to be exactly 1 for the bullish signal , and -1 for the bearish signal
Now you can connect your indicator to the Strategy Template using the method below or that one
Step 2: Connect the connector
1) Add your updated indicator to a TradingView chart
2) Add the Strategy Template as well to the SAME chart
3) Open the Strategy Template settings and in the Data Source field select your 🔌Connector🔌 (which comes from your indicator)
From then, you should start seeing the signals and plenty of other stuff on your chart
🔥 Note that whenever you'll update your indicator values, the strategy statistics and visual on your chart will update in real-time
Settings
- Color Candles : Color the candles based on the trade state (bullish, bearish, neutral)
- Close positions at market at the end of each session : useful for everything but cryptocurrencies
- Session time ranges : Take the signals from a starting time to an ending time
- Close Direction : Choose to close only the longs, shorts, or both
- Date Filter : Take the signals from a starting date to an ending date
- Set the maximum losing streak length with an input
- Set the maximum winning streak length with an input
- Set the maximum consecutive days with a loss
- Set the maximum drawdown (in % of strategy equity)
- Set the maximum intraday loss in percentage
- Limit the number of trades per day
- Limit the number of trades per week
- Stop-loss: None or Percentage or Trailing Stop Percentage or ATR
- Take-Profit: None or Percentage or ATR
- Risk-Reward based on ATR multiple for the Stop-Loss and Take-Profit
This script is open-source so feel free to use it, and optimize it as you want
Alerts
Maybe you didn't know it but alerts are available on strategy scripts.
I added them in this template - that's cool because:
- if you don't know how to code, now you can connect your indicator and get alerts
- you have now a cool template showing you how to create alerts for strategy scripts
Source: www.tradingview.com
I hope you'll like it, use it, optimize it and most importantly....make some optimizations to your indicators thanks to this Strategy template
Special Thanks
Special thanks to @JosKodify as I borrowed a few risk management snippets from his website: kodify.net
Additional features
I thought of plenty of extra filters that I'll add later on this week on this strategy template
Best
Dave

Strategy Template[Benson]A strategy template with following user inputs:
1. backtest start date
2. tp% and stop loss%
3. trail stop price and trail stop offset
The long and short condition is ma crossover and corssunder by default.
You can change the logic with your own.

[Autoview][BackTest] Blank R0.13BThis is a fork of JustUncleL's
Dual MA Ribbons R0.13
It is now a blank template for making new strategies / alerts for autoview
The changes are as follows:
Removed actual algo
Establish functions for long Signal, long Close Signal and short Signal, short Close Signal to minimize the places code must be edited to update / replace algos
Make allow Long and allow short and invert trade directions independent options
Added support for alternate candle types
Added autoset backtest period feature, and optional coloring
Moved strategy calls in to functions so they can all be commented out or activated / disabled in a single block at the top of the script
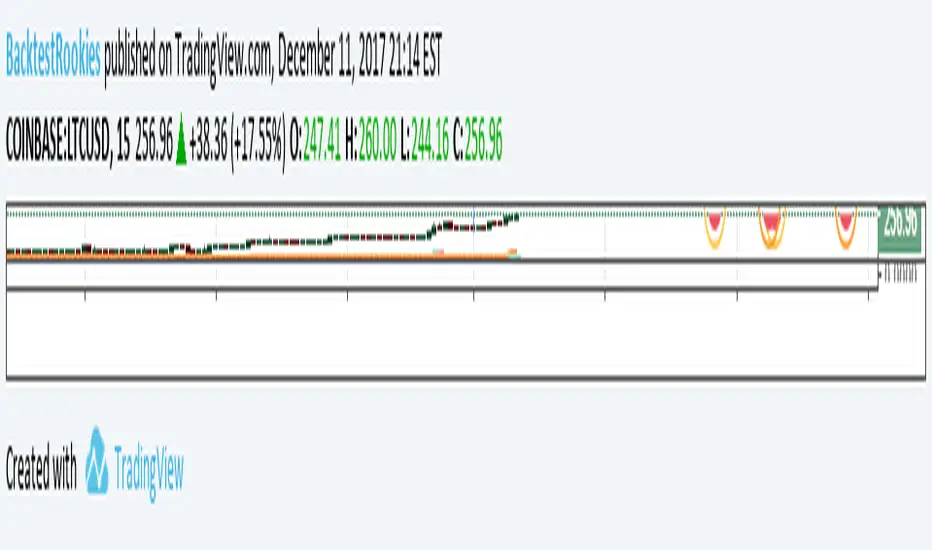
Default Strategy Inputs (Forex / Crypto)The code in this post contains a set of default strategy inputs I use in new projects / backtests in Tradingview.
Full code commentary is available on the Backtest-Rookies website. To comply with house rules, I cannot post the direct link here.
Features
Trade Direction: So that you can limit the strategy for long only, short only or trade in both directions. It is important to note that when you select “Long Only”, you will still see Short signals on the chart. However, they are only used to close a position rather than reverse it. This is the default behaviour for strategies. The same applies to “Short Only”.
Date Ranges: So that you can isolate backtesting to specific periods of interest such as bull or bear markets.
Sessions: So you can easily get an idea of the expected results during your own session. You may also notice that performance of the strategy varies depending on which session it is deployed in.
Some example stop losses: It is not an exhaustive list but it should be enough to provide some inspiration for different types of stops that you can experiment with.
Happy Scripting. I hope the community finds it useful.