Intelligent Support & Resistance Lines (MTF)This script automatically detects and updates key Support & Resistance (S/R) levels using a higher timeframe (MTF) approach. By leveraging volume confirmation, levels are only identified when significant volume (relative to the SMA of volume) appears. Each level is drawn horizontally in real time, and whenever the market breaks above a resistance level (and retests it), the script automatically converts that resistance into support. The opposite occurs if the market breaks below a support level.
Key Features:
Multi-Timeframe (MTF) Data
Select a higher timeframe for more robust S/R calculations.
The script fetches High, Low, Volume, and SMA of Volume from the chosen timeframe.
Automatic Role Reversal
Resistance becomes Support if a breakout retest occurs.
Support becomes Resistance if a breakdown retest occurs.
Dynamic Line Width & Labeling
Each S/R line’s thickness increases with additional touches, making frequently tested levels easier to spot.
Labels automatically display the number of touches (e.g., “R 3” or “S 2”) and can have adjustable text size.
Volume Threshold
Only significant pivots (where volume exceeds a specified multiplier of average volume) are plotted, reducing noise.
Horizontal Offset for Clarity
Lines are drawn with timestamps instead of bar_index, ensuring that old levels remain visible without chart limitations.
Adjustable Maximum Levels
Maintain a clean chart by limiting how many S/R lines remain at once.
How It Works:
Pivot Detection: The script identifies swing highs and lows from the higher timeframe (timeframeSR).
Volume Check: Only pivots with volume ≥ (SMA Volume * volumeThreshold) qualify.
Line Creation & Updates: New lines are drawn at these pivots, labeled “R #” or “S #,” indicating how many times they’ve been touched.
Role Reversal: If price breaks above a resistance and retests it from above, that line is removed from the resistance array and re-created in the support array (and vice versa).
Inputs:
Timeframe for S/R: Choose the higher timeframe for S/R calculations.
Swing Length: Number of bars to consider in a pivot calculation.
Minimum Touches: Minimum required touches before drawing or updating a level.
Volume Threshold (Multiplier): Determines how much volume (relative to SMA) is needed to confirm a pivot.
Maximum Number of Levels: Caps how many S/R lines can be shown at once.
Color for Resistance & Color for Support: Customize your preferred colors for lines and labels.
Label Size: Select from "tiny", "small", "normal", "large", or "huge" to resize the labels.
Disclaimer:
This script is intended for educational purposes and should not be interpreted as financial or investment advice. Always conduct your own research or consult a qualified professional before making trading decisions.
Timeframe

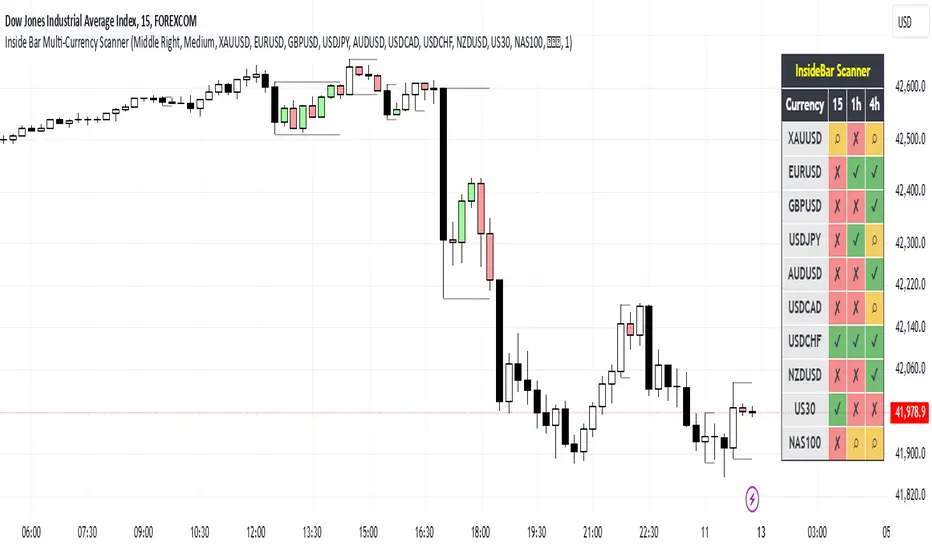
Inside Bar Multi-Currency ScannerDescription:
This script is an Inside Bar Scanner that allows you to monitor multiple currency pairs across different timeframes (15 minutes, 1 hour, and 4 hours). Its main features include:
Inside Bar Detection:
An Inside Bar is a candlestick where both the High and Low are within the range of the previous candle.
The script automatically identifies Inside Bars and displays the results in a table.
Customizable Timeframes:
Supports scanning in 15-minute, 1-hour, and 4-hour timeframes.
Results are displayed for each timeframe separately.
Multi-Currency Support:
Scan up to 10 currency pairs simultaneously.
Currency pairs are customizable and selected by the user.
Candle Coloring:
Inside Bars are highlighted with colors:
Semi-transparent green for bullish Inside Bars.
Semi-transparent red for bearish Inside Bars.
Colors are customizable and selected by the user.
Alerts:
Custom alerts for detecting Inside Bars in selected timeframes.
Receive notifications when an Inside Bar is detected in any of the selected currency pairs.
How to Use:
Select your desired currency pairs from the Scanner Currencies section.
Enable your preferred timeframes in the Scanner Timeframe section.
The script will display a table of results with Inside Bar information for each currency pair and timeframe.
Optionally, customize the candle colors in the Scanner InsideBar Color section.
Additional Explanation for Timeframe Status:
In each selected timeframe, there are three possible states for the candles:
Previous Candle is an Inside Bar:
Displayed with a green background and the symbol ✔.
Previous Candle is NOT an Inside Bar:
Displayed with a red background and the symbol ✘.
Current Candle is an Inside Bar:
Displayed with an orange background and the symbol ⌕.
These visual indicators provide a clear and quick overview of the Inside Bar status for each selected currency pair and timeframe.
High/Mid/Low of the Previous Month, Week and Day + MAIntroducing the Ultimate Price Action Indicator
Take your trading to the next level with this feature-packed indicators. Designed to provide key price insights, this tool offers:
- Monthly, Weekly, and Daily Levels : Displays the High, Midpoint, and Low of the previous month, week, and day.
- Logarithmic Price Lines : Option to plot price levels logarithmically for enhanced accuracy.
- Customizable Labels : Display labels on price lines for better clarity. (This feature is optional.)
- Dual Moving Averages : Add two customizable Moving Averages (Simple, Exponential, or Weighted) directly on the price chart. (This feature is optional.)
This code combines features from the Moving Average Exponential and Daily Weekly Monthly Highs & Lows (sbtnc) indicators, with custom modifications to implement unique personal ideas.
Perfect for traders who want to combine precision with simplicity. Whether you're analyzing historical levels or integrating moving averages into your strategy, this indicator provides everything you need for informed decision-making.
To prevent change chart scale, right click on Price Scale and enable "Scale price chart only"
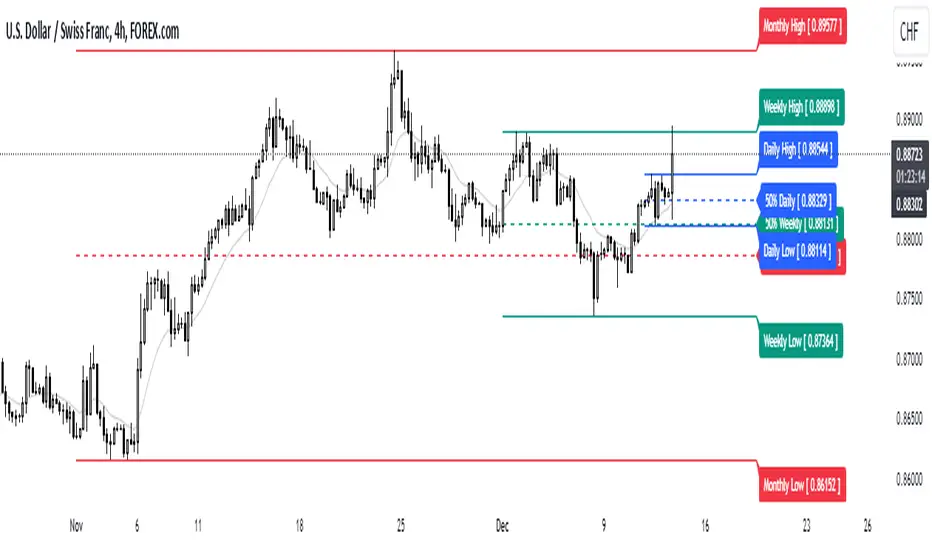
Prev Week & Day High/Low LinesTitle:
Advanced Weekly & Daily High/Low Levels with Alerts and Customization
Description:
This indicator automatically plots the high and low levels of the previous week and day, featuring advanced customization options and configurable alerts. It’s a powerful tool for traders who want to identify key support and resistance zones on any timeframe below weekly.
What Does This Indicator Do?
1. Identifies historical levels: Calculates and plots the highs and lows of the previous week and day, helping traders spot reversal points, zones of interest, and decision-making levels.
2. Real-time alerts: Notifies traders when the price approaches or crosses these key levels, allowing them to make decisions without constantly monitoring the chart.
3. Dynamic colors: Changes the color of the levels based on the price proximity, providing a clear visual signal about the immediate importance of each level.
Key Features
1. Total Customization:
• Fully adjustable line colors, styles (solid or dotted), and thicknesses.
• Optional labels for each level with customizable text, size, and position.
• Adaptable configurations to suit different trading styles (scalping, swing trading, intraday).
2. Smart Alerts:
• Set alerts when the price touches or approaches the plotted levels.
• Instant notifications, ideal for trading breakouts or pullbacks at key levels.
3. Optimization and Efficiency:
• Works on all timeframes below weekly, avoiding unnecessary calculations.
• Real-time updates to ensure levels are always accurate.
4. Clear Visualization:
• Dynamic colors for levels close to the current price.
• Projected lines extending into the future to help plan trades.
• Advanced label options, including customizable text and different chart positions.
How It Works
The indicator uses advanced logic to automatically detect day and week transitions based on market time. It calculates and updates the high and low levels efficiently, ensuring that the data reflects the active timeframe. The levels can be projected forward and highlighted with customizable colors and labels.
Additionally, with configurable alerts, traders can receive real-time notifications when the price interacts with these levels, enabling them to respond quickly to market changes.
How to Use It
1. Add the indicator: Apply it to your chart in TradingView.
2. Set up the options:
• Customize the colors, thicknesses, and styles of the lines.
• Adjust the label text and position to suit your preferences.
• Enable alerts for key levels.
3. Utilize the levels: Watch the indicator automatically plot the high and low levels, and use the visual signals and alerts to make informed trading decisions.
Benefits for Traders
• Saves time: No need to manually calculate historical support and resistance levels.
• Improves accuracy: Levels are automatically recalculated and updated in real-time.
• Versatility: Perfect for any trading style (scalping, swing, intraday).
• Real-time alerts: Stay informed about key levels even when not watching the chart.
• Intuitive visualization: Dynamic colors and adjustable labels make technical analysis easier.
Note:
This indicator is unique due to its configurable alerts, advanced customization options, and dynamic colors, setting it apart from similar scripts available on TradingView. It is designed for traders seeking a clear and functional visual tool to make quick and accurate market decisions.

Multi-Timeframe Stochastic Alert [tradeviZion]# Multi-Timeframe Stochastic Alert : Complete User Guide
## 1. Introduction
### What is the Multi-Timeframe Stochastic Alert?
The Multi-Timeframe Stochastic Alert is an advanced technical analysis tool that helps traders identify potential trading opportunities by analyzing momentum across multiple timeframes. It combines the power of the stochastic oscillator with multi-timeframe analysis to provide more reliable trading signals.
### Key Features and Benefits
- Simultaneous analysis of 6 different timeframes
- Advanced alert system with customizable conditions
- Real-time visual feedback with color-coded signals
- Comprehensive data table with instant market insights
- Motivational trading messages for psychological support
- Flexible theme support for comfortable viewing
### How it Can Help Your Trading
- Identify stronger trends by confirming momentum across multiple timeframes
- Reduce false signals through multi-timeframe confirmation
- Stay informed of market changes with customizable alerts
- Make more informed decisions with comprehensive market data
- Maintain trading discipline with clear visual signals
## 2. Understanding the Display
### The Stochastic Chart
The main chart displays three key components:
1. ** K-Line (Fast) **: The primary stochastic line (default color: green)
2. ** D-Line (Slow) **: The signal line (default color: red)
3. ** Reference Lines **:
- Overbought Level (80): Upper dashed line
- Middle Line (50): Center dashed line
- Oversold Level (20): Lower dashed line
### The Information Table
The table provides a comprehensive view of stochastic readings across all timeframes. Here's what each column means:
#### Column Explanations:
1. ** Timeframe **
- Shows the time period for each row
- Example: "5" = 5 minutes, "15" = 15 minutes, etc.
2. ** K Value **
- The fast stochastic line value (0-100)
- Higher values indicate stronger upward momentum
- Lower values indicate stronger downward momentum
3. ** D Value **
- The slow stochastic line value (0-100)
- Helps confirm momentum direction
- Crossovers with K-line can signal potential trades
4. ** Status **
- Shows current momentum with symbols:
- ▲ = Increasing (bullish)
- ▼ = Decreasing (bearish)
- Color matches the trend direction
5. ** Trend **
- Shows the current market condition:
- "Overbought" (above 80)
- "Bullish" (above 50)
- "Bearish" (below 50)
- "Oversold" (below 20)
#### Row Explanations:
1. ** Title Row **
- Shows "🎯 Multi-Timeframe Stochastic"
- Indicates the indicator is active
2. ** Header Row **
- Contains column titles
- Dark blue background for easy reading
3. ** Timeframe Rows **
- Six rows showing different timeframe analyses
- Each row updates independently
- Color-coded for easy trend identification
4. **Message Row**
- Shows rotating motivational messages
- Updates every 5 bars
- Helps maintain trading discipline
### Visual Indicators and Colors
- ** Green Background **: Indicates bullish conditions
- ** Red Background **: Indicates bearish conditions
- ** Color Intensity **: Shows strength of the signal
- ** Background Highlights **: Appear when alert conditions are met
## 3. Core Settings Groups
### Stochastic Settings
These settings control the core calculation of the stochastic oscillator.
1. ** Length (Default: 14) **
- What it does: Determines the lookback period for calculations
- Higher values (e.g., 21): More stable, fewer signals
- Lower values (e.g., 8): More sensitive, more signals
- Recommended:
* Day Trading: 8-14
* Swing Trading: 14-21
* Position Trading: 21-30
2. ** Smooth K (Default: 3) **
- What it does: Smooths the main stochastic line
- Higher values: Smoother line, fewer false signals
- Lower values: More responsive, but more noise
- Recommended:
* Day Trading: 2-3
* Swing Trading: 3-5
* Position Trading: 5-7
3. ** Smooth D (Default: 3) **
- What it does: Smooths the signal line
- Works in conjunction with Smooth K
- Usually kept equal to or slightly higher than Smooth K
- Recommended: Keep same as Smooth K for consistency
4. ** Source (Default: Close) **
- What it does: Determines price data for calculations
- Options: Close, Open, High, Low, HL2, HLC3, OHLC4
- Recommended: Stick with Close for most reliable signals
### Timeframe Settings
Controls the multiple timeframes analyzed by the indicator.
1. ** Main Timeframes (TF1-TF6) **
- TF1 (Default: 10): Shortest timeframe for quick signals
- TF2 (Default: 15): Short-term trend confirmation
- TF3 (Default: 30): Medium-term trend analysis
- TF4 (Default: 30): Additional medium-term confirmation
- TF5 (Default: 60): Longer-term trend analysis
- TF6 (Default: 240): Major trend confirmation
Recommended Combinations:
* Scalping: 1, 3, 5, 15, 30, 60
* Day Trading: 5, 15, 30, 60, 240, D
* Swing Trading: 15, 60, 240, D, W, M
2. ** Wait for Bar Close (Default: true) **
- What it does: Controls when calculations update
- True: More reliable but slightly delayed signals
- False: Faster signals but may change before bar closes
- Recommended: Keep True for more reliable signals
### Alert Settings
#### Main Alert Settings
1. ** Enable Alerts (Default: true) **
- Master switch for all alert notifications
- Toggle this off when you don't want any alerts
- Useful during testing or when you want to focus on visual signals only
2. ** Alert Condition (Options) **
- "Above Middle": Bullish momentum alerts only
- "Below Middle": Bearish momentum alerts only
- "Both": Alerts for both directions
- Recommended:
* Trending Markets: Choose direction matching the trend
* Ranging Markets: Use "Both" to catch reversals
* New Traders: Start with "Both" until you develop a specific strategy
3. ** Alert Frequency **
- "Once Per Bar": Immediate alerts during the bar
- "Once Per Bar Close": Alerts only after bar closes
- Recommended:
* Day Trading: "Once Per Bar" for quick reactions
* Swing Trading: "Once Per Bar Close" for confirmed signals
* Beginners: "Once Per Bar Close" to reduce false signals
#### Timeframe Check Settings
1. ** First Check (TF1) **
- Purpose: Confirms basic trend direction
- Alert Triggers When:
* For Bullish: Stochastic is above middle line (50)
* For Bearish: Stochastic is below middle line (50)
* For Both: Triggers in either direction based on position relative to middle line
- Settings:
* Enable/Disable: Turn first check on/off
* Timeframe: Default 5 minutes
- Best Used For:
* Quick trend confirmation
* Entry timing
* Scalping setups
2. ** Second Check (TF2) **
- Purpose: Confirms both position and momentum
- Alert Triggers When:
* For Bullish: Stochastic is above middle line AND both K&D lines are increasing
* For Bearish: Stochastic is below middle line AND both K&D lines are decreasing
* For Both: Triggers based on position and direction matching current condition
- Settings:
* Enable/Disable: Turn second check on/off
* Timeframe: Default 15 minutes
- Best Used For:
* Trend strength confirmation
* Avoiding false breakouts
* Day trading setups
3. ** Third Check (TF3) **
- Purpose: Confirms overall momentum direction
- Alert Triggers When:
* For Bullish: Both K&D lines are increasing (momentum confirmation)
* For Bearish: Both K&D lines are decreasing (momentum confirmation)
* For Both: Triggers based on matching momentum direction
- Settings:
* Enable/Disable: Turn third check on/off
* Timeframe: Default 30 minutes
- Best Used For:
* Major trend confirmation
* Swing trading setups
* Avoiding trades against the main trend
Note: All three conditions must be met simultaneously for the alert to trigger. This multi-timeframe confirmation helps reduce false signals and provides stronger trade setups.
#### Alert Combinations Examples
1. ** Conservative Setup **
- Enable all three checks
- Use "Once Per Bar Close"
- Timeframe Selection Example:
* First Check: 15 minutes
* Second Check: 1 hour (60 minutes)
* Third Check: 4 hours (240 minutes)
- Wider gaps between timeframes reduce noise and false signals
- Best for: Swing trading, beginners
2. ** Aggressive Setup **
- Enable first two checks only
- Use "Once Per Bar"
- Timeframe Selection Example:
* First Check: 5 minutes
* Second Check: 15 minutes
- Closer timeframes for quicker signals
- Best for: Day trading, experienced traders
3. ** Balanced Setup **
- Enable all checks
- Use "Once Per Bar"
- Timeframe Selection Example:
* First Check: 5 minutes
* Second Check: 15 minutes
* Third Check: 1 hour (60 minutes)
- Balanced spacing between timeframes
- Best for: All-around trading
### Visual Settings
#### Alert Visual Settings
1. ** Show Background Color (Default: true) **
- What it does: Highlights chart background when alerts trigger
- Benefits:
* Makes signals more visible
* Helps spot opportunities quickly
* Provides visual confirmation of alerts
- When to disable:
* If using multiple indicators
* When preferring a cleaner chart
* During manual backtesting
2. ** Background Transparency (Default: 90) **
- Range: 0 (solid) to 100 (invisible)
- Recommended Settings:
* Clean Charts: 90-95
* Multiple Indicators: 85-90
* Single Indicator: 80-85
- Tip: Adjust based on your chart's overall visibility
3. ** Background Colors **
- Bullish Background:
* Default: Green
* Indicates upward momentum
* Customizable to match your theme
- Bearish Background:
* Default: Red
* Indicates downward momentum
* Customizable to match your theme
#### Level Settings
1. ** Oversold Level (Default: 20) **
- Traditional Setting: 20
- Adjustable Range: 0-100
- Usage:
* Lower values (e.g., 10): More conservative
* Higher values (e.g., 30): More aggressive
- Trading Applications:
* Potential bullish reversal zone
* Support level in uptrends
* Entry point for long positions
2. ** Overbought Level (Default: 80) **
- Traditional Setting: 80
- Adjustable Range: 0-100
- Usage:
* Lower values (e.g., 70): More aggressive
* Higher values (e.g., 90): More conservative
- Trading Applications:
* Potential bearish reversal zone
* Resistance level in downtrends
* Exit point for long positions
3. ** Middle Line (Default: 50) **
- Purpose: Trend direction separator
- Applications:
* Above 50: Bullish territory
* Below 50: Bearish territory
* Crossing 50: Potential trend change
- Trading Uses:
* Trend confirmation
* Entry/exit trigger
* Risk management level
#### Color Settings
1. ** Bullish Color (Default: Green) **
- Used for:
* K-Line (Main stochastic line)
* Status symbols when trending up
* Trend labels for bullish conditions
- Customization:
* Choose colors that stand out
* Match your trading platform theme
* Consider color blindness accessibility
2. ** Bearish Color (Default: Red) **
- Used for:
* D-Line (Signal line)
* Status symbols when trending down
* Trend labels for bearish conditions
- Customization:
* Choose contrasting colors
* Ensure visibility on your chart
* Consider monitor settings
3. ** Neutral Color (Default: Gray) **
- Used for:
* Middle line (50 level)
- Customization:
* Should be less prominent
* Easy on the eyes
* Good background contrast
### Theme Settings
1. **Color Theme Options**
- Dark Theme (Default):
* Dark background with white text
* Optimized for dark chart backgrounds
* Reduces eye strain in low light
- Light Theme:
* Light background with black text
* Better visibility in bright conditions
- Custom Theme:
* Use your own color preferences
2. ** Available Theme Colors **
- Table Background
- Table Text
- Table Headers
Note: The theme affects only the table display colors. The stochastic lines and alert backgrounds use their own color settings.
### Table Settings
#### Position and Size
1. ** Table Position **
- Options:
* Top Right (Default)
* Middle Right
* Bottom Right
* Top Left
* Middle Left
* Bottom Left
- Considerations:
* Chart space utilization
* Personal preference
* Multiple monitor setups
2. ** Text Sizes **
- Title Size Options:
* Tiny: Minimal space usage
* Small: Compact but readable
* Normal (Default): Standard visibility
* Large: Enhanced readability
* Huge: Maximum visibility
- Data Size Options:
* Recommended: One size smaller than title
* Adjust based on screen resolution
* Consider viewing distance
3. ** Empowering Messages **
- Purpose:
* Maintain trading discipline
* Provide psychological support
* Remind of best practices
- Rotation:
* Changes every 5 bars
* Categories include:
- Market Wisdom
- Strategy & Discipline
- Mindset & Growth
- Technical Mastery
- Market Philosophy
## 4. Setting Up for Different Trading Styles
### Day Trading Setup
1. **Timeframes**
- Primary: 5, 15, 30 minutes
- Secondary: 1H, 4H
- Alert Settings: "Once Per Bar"
2. ** Stochastic Settings **
- Length: 8-14
- Smooth K/D: 2-3
- Alert Condition: Match market trend
3. ** Visual Settings **
- Background: Enabled
- Transparency: 85-90
- Theme: Based on trading hours
### Swing Trading Setup
1. ** Timeframes **
- Primary: 1H, 4H, Daily
- Secondary: Weekly
- Alert Settings: "Once Per Bar Close"
2. ** Stochastic Settings **
- Length: 14-21
- Smooth K/D: 3-5
- Alert Condition: "Both"
3. ** Visual Settings **
- Background: Optional
- Transparency: 90-95
- Theme: Personal preference
### Position Trading Setup
1. ** Timeframes **
- Primary: Daily, Weekly
- Secondary: Monthly
- Alert Settings: "Once Per Bar Close"
2. ** Stochastic Settings **
- Length: 21-30
- Smooth K/D: 5-7
- Alert Condition: "Both"
3. ** Visual Settings **
- Background: Disabled
- Focus on table data
- Theme: High contrast
## 5. Troubleshooting Guide
### Common Issues and Solutions
1. ** Too Many Alerts **
- Cause: Settings too sensitive
- Solutions:
* Increase timeframe intervals
* Use "Once Per Bar Close"
* Enable fewer timeframe checks
* Adjust stochastic length higher
2. ** Missed Signals **
- Cause: Settings too conservative
- Solutions:
* Decrease timeframe intervals
* Use "Once Per Bar"
* Enable more timeframe checks
* Adjust stochastic length lower
3. ** False Signals **
- Cause: Insufficient confirmation
- Solutions:
* Enable all three timeframe checks
* Use larger timeframe gaps
* Wait for bar close
* Confirm with price action
4. ** Visual Clarity Issues **
- Cause: Poor contrast or overlap
- Solutions:
* Adjust transparency
* Change theme settings
* Reposition table
* Modify color scheme
### Best Practices
1. ** Getting Started **
- Start with default settings
- Use "Both" alert condition
- Enable all timeframe checks
- Wait for bar close
- Monitor for a few days
2. ** Fine-Tuning **
- Adjust one setting at a time
- Document changes and results
- Test in different market conditions
- Find your optimal timeframe combination
- Balance sensitivity with reliability
3. ** Risk Management **
- Don't trade against major trends
- Confirm signals with price action
- Use appropriate position sizing
- Set clear stop losses
- Follow your trading plan
4. ** Regular Maintenance **
- Review settings weekly
- Adjust for market conditions
- Update color scheme for visibility
- Clean up chart regularly
- Maintain trading journal
## 6. Tips for Success
1. ** Entry Strategies **
- Wait for all timeframes to align
- Confirm with price action
- Use proper position sizing
- Consider market conditions
2. ** Exit Strategies **
- Trail stops using indicator levels
- Take partial profits at targets
- Honor your stop losses
- Don't fight the trend
3. ** Psychology **
- Stay disciplined with settings
- Don't override system signals
- Keep emotions in check
- Learn from each trade
4. ** Continuous Improvement **
- Record your trades
- Review performance regularly
- Adjust settings gradually
- Stay educated on markets

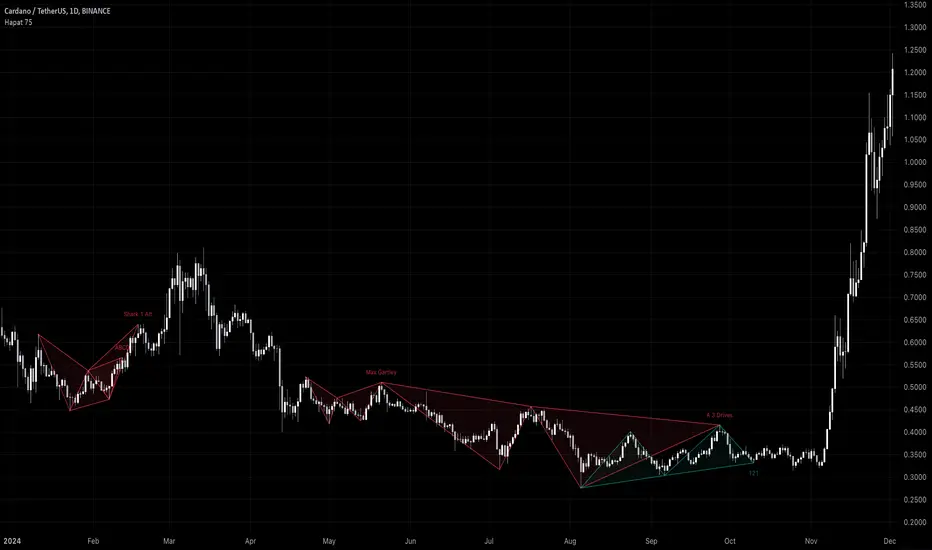
Harmonic Pattern Detector (75 patterns)Harmonic Pattern Detector offers a record amount of "Harmonic Patterns" in one script, with 75 different patterns detected, together with up to 99 different swing lengths.
🔶 USAGE
Harmonic Patterns are detected from several different ZigZag lines, derived from Swings with different lengths (shorter - longer term)
Depending on the settings ' Minimum/Maximum Swing Length ', the user will see more or less patterns from shorter and/or longer-term swing points.
🔹 Fibonacci Ratio
Certain patterns have only one ratio for a specific retrace/extension instead of one upper and one lower limit. In this case, we add a ' Tolerance ', which adds a percentage tolerance below/above the ratio, creating two limits.
A higher number may show more patterns but may become less valid.
Hoovering over points B, C, and D will show a tooltip with the concerning limits; adjusted limits will be seen if applicable.
Tooltips in settings will also show which patterns the Fibonacci Ratio applies to.
🔹 Triangle Area Ratio
Using Heron's formula , the triangle area is calculated after the X-Y axis is normalized.
Users can filter patterns based on the ratio of the smallest triangle to the largest triangle.
A lower Triangle Area Ratio number leads to more symmetrical patterns but may appear less frequently.
🔶 DETAILS
Harmonic patterns are based on geometric patterns, where the retracement/extension of a swing point must be located between specific Fibonacci ratios of the previous swing/leg. Different Harmonic Patterns require unique ratios to become valid patterns.
In the above example there is a valid 'Max Butterfly' pattern where:
Point B is located between 0.618 - 0.886 retracement level of the X-A leg
Point C is located between 0.382 - 0.886 retracement level of the A-B leg
Point D is located between 1.272 - 2.618 extension level of the B-C leg
Point D is located between 1.272 - 1.618 extension level of the X-A leg
Harmonic Pattern Detector uses ZigZag lines, where swing highs and swing lows alternate. Each ZigZag line is checked for valid Harmonic Patterns . When multiple types of Harmonic Patterns are valid for the same sequence, the pattern will be named after the first one found.
Different swing lengths form different ZigZag lines.
By evaluating different ZigZag lines (up to 99!), shorter—and longer-term patterns can be drawn on the same chart.
🔹 Blocks
The patterns are organized into blocks that can be toggled on or off with a single click.
When a block is enabled, the user can still select which specific patterns within that block are enabled or disabled.
🔹 Visuals
Besides color settings, labels can show pattern names or arrows at point D of the pattern.
Note this will happen 1 bar after validation because one extra bar is needed for confirmation.
An option is included to show only arrows without the patterns.
🔹 Updated Patterns
When a Swing Low is followed by a lower low or a Swing High followed by a higher high , triggering a pattern identical to a previous one except with a different point D, the pattern will be updated. The previous C-D line will be visible as a dashed line to highlight the event. Only the last dashed line is shown when this happens more than once.
🔹 Optimization
The script only verifies the last leg in the initial phase, significantly reducing the time spent on pattern validation. If this leg doesn't align with a potential Harmonic Pattern , the pattern is immediately disregarded. In the subsequent phase, the remaining patterns are quickly scrutinized to ensure the next leg is valid. This efficient process continues, with only valid patterns progressing to the next phase until all sequences have been thoroughly examined.
This process can check up to 99 ZigZag lines for 75 different Harmonic Patterns , showcasing its high capacity and versatility.
🔹 Ratios
The following table shows the different ratios used for each Harmonic Pattern .
' min ' and ' max ' are used when only one limit is provided instead of 2. This limit is given a percentage tolerance above and below, customizable by the setting ' Tolerance - Fibonacci Ratio '.
For example a ratio of 0.618 with a tolerance of 1% would result in:
an upper limit of 0.624
a lower limit of 0.612
|-------------------|------------------------|------------------------|-----------------------|-----------------------|
| NAME PATTERN | BCD (BD) | ABC (AC) | XAB (XB) | XAD (XD) |
| | min max | min max | min max | min max |
|-------------------|------------------------|------------------------|-----------------------|-----------------------|
| 'ABCD' | 1.272 - 1.618 | 0.618 - 0.786 | | |
| '5-0' | 0.5 *min - 0.5 *max | 1.618 - 2.24 | 1.13 - 1.618 | |
| 'Max Gartley' | 1.128 - 2.236 | 0.382 - 0.886 | 0.382 - 0.618 | 0.618 - 0.786 |
| 'Gartley' | 1.272 - 1.618 | 0.382 - 0.886 | 0.618*min - 0.618*max | 0.786*min - 0.786*max |
| 'A Gartley' | 1.618*min - 1.618*max | 1.128 - 2.618 | 0.618 - 0.786 | 1.272*min - 1.272*max |
| 'NN Gartley' | 1.128 - 1.618 | 0.382 - 0.886 | 0.618*min - 0.618*max | 0.786*min - 0.786*max |
| 'NN A Gartley' | 1.618*min - 1.618*max | 1.128 - 2.618 | 0.618 - 0.786 | 1.272*min - 1.272*max |
| 'Bat' | 1.618 - 2.618 | 0.382 - 0.886 | 0.382 - 0.5 | 0.886*min - 0.886*max |
| 'Alt Bat' | 2.0 - 3.618 | 0.382 - 0.886 | 0.382*min - 0.382*max | 1.128*min - 1.128*max |
| 'A Bat' | 2.0 - 2.618 | 1.128 - 2.618 | 0.382 - 0.618 | 1.128*min - 1.128*max |
| 'Max Bat' | 1.272 - 2.618 | 0.382 - 0.886 | 0.382 - 0.618 | 0.886*min - 0.886*max |
| 'NN Bat' | 1.618 - 2.618 | 0.382 - 0.886 | 0.382 - 0.5 | 0.886*min - 0.886*max |
| 'NN Alt Bat' | 2.0 - 4.236 | 0.382 - 0.886 | 0.382*min - 0.382*max | 1.128*min - 1.128*max |
| 'NN A Bat' | 2.0 - 2.618 | 1.128 - 2.618 | 0.382 - 0.618 | 1.128*min - 1.128*max |
| 'NN A Alt Bat' | 2.618*min - 2.618*max | 1.128 - 2.618 | 0.236 - 0.5 | 0.886*min - 0.886*max |
| 'Butterfly' | 1.618 - 2.618 | 0.382 - 0.886 | 0.786*min - 0.786*max | 1.272 - 1.618 |
| 'Max Butterfly' | 1.272 - 2.618 | 0.382 - 0.886 | 0.618 - 0.886 | 1.272 - 1.618 |
| 'Butterfly 113' | 1.128 - 1.618 | 0.618 - 1.0 | 0.786 - 1.0 | 1.128*min - 1.128*max |
| 'A Butterfly' | 1.272*min - 1.272*max | 1.128 - 2.618 | 0.382 - 0.618 | 0.618 - 0.786 |
| 'Crab' | 2.24 - 3.618 | 0.382 - 0.886 | 0.382 - 0.618 | 1.618*min - 1.618*max |
| 'Deep Crab' | 2.618 - 3.618 | 0.382 - 0.886 | 0.886*min - 0.886*max | 1.618*min - 1.618*max |
| 'A Crab' | 1.618 - 2.618 | 1.128 - 2.618 | 0.276 - 0.446 | 0.618*min - 0.618*max |
| 'NN Crab' | 2.236 - 4.236 | 0.382 - 0.886 | 0.382 - 0.618 | 1.618*min - 1.618*max |
| 'NN Deep Crab' | 2.618 - 4.236 | 0.382 - 0.886 | 0.886*min - 0.886*max | 1.618*min - 1.618*max |
| 'NN A Crab' | 1.128 - 2.618 | 1.128 - 2.618 | 0.236 - 0.447 | 0.618*min - 0.618*max |
| 'NN A Deep Crab' | 1.128*min - 1.128*max | 1.128 - 2.618 | 0.236 - 0.382 | 0.618*min - 0.618*max |
| 'Cypher' | 1.272 - 2.00 | 1.13 - 1.414 | 0.382 - 0.618 | 0.786*min - 0.786*max |
| 'New Cypher' | 1.272 - 2.00 | 1.414 - 2.14 | 0.382 - 0.618 | 0.786*min - 0.786*max |
| 'Anti New Cypher' | 1.618 - 2.618 | 0.467 - 0.707 | 0.5 - 0.786 | 1.272*min - 1.272*max |
| 'Shark 1' | 1.618 - 2.236 | 1.128 - 1.618 | 0.382 - 0.618 | 0.886*min - 0.886*max |
| 'Shark 1 Alt' | 1.618 - 2.618 | 0.618 - 0.886 | 0.446 - 0.618 | 1.128*min - 1.128*max |
| 'Shark 2' | 1.618 - 2.236 | 1.128 - 1.618 | 0.382 - 0.618 | 1.128*min - 1.128*max |
| 'Shark 2 Alt' | 1.618 - 2.618 | 0.618 - 0.886 | 0.446 - 0.618 | 0.886*min - 0.886*max |
| 'Leonardo' | 1.128 - 2.618 | 0.382 - 0.886 | 0.5*min - 0.5*max | 0.786*min - 0.786*max |
| 'NN A Leonardo' | 2.0*min - 2.0*max | 1.128 - 2.618 | 0.382 - 0.886 | 1.272*min - 1.272*max |
| 'Nen Star' | 1.272 - 2.0 | 1.414 - 2.14 | 0.382 - 0.618 | 1.272*min - 1.272*max |
| 'Anti Nen Star' | 1.618 - 2.618 | 0.467 - 0.707 | 0.5 - 0.786 | 0.786*min - 0.786*max |
| '3 Drives' | 1.272 - 1.618 | 0.618 - 0.786 | 1.272 - 1.618 | 1.618 - 2.618 |
| 'A 3 Drives' | 0.618 - 0.786 | 1.272 - 1.618 | 0.618 - 0.786 | 0.13 - 0.886 |
| '121' | 0.382 - 0.786 | 1.128 - 3.618 | 0.5 - 0.786 | 0.382 - 0.786 |
| 'A 121' | 1.272 - 2.0 | 0.5 - 0.786 | 1.272 - 2.0 | 1.272 - 2.618 |
| '121 BG' | 0.618 - 0.707 | 1.128 - 1.733 | 0.5 - 0.577 | 0.447 - 0.786 |
| 'Black Swan' | 1.128 - 2.0 | 0.236 - 0.5 | 1.382 - 2.618 | 1.128 - 2.618 |
| 'White Swan' | 0.5 - 0.886 | 2.0 - 4.237 | 0.382 - 0.786 | 0.238 - 0.886 |
| 'NN White Swan' | 0.5 - 0.886 | 2.0 - 4.236 | 0.382 - 0.724 | 0.382 - 0.886 |
| 'Sea Pony' | 1.618 - 2.618 | 0.382 - 0.5 | 0.128 - 3.618 | 0.618 - 3.618 |
| 'Navarro 200' | 0.886 - 3.618 | 0.886 - 1.128 | 0.382 - 0.786 | 0.886 - 1.128 |
| 'May-00' | 0.5 - 0.618 | 1.618 - 2.236 | 1.128 - 1.618 | 0.5 - 0.618 |
| 'SNORM' | 0.9 - 1.1 | 0.9 - 1.1 | 0.9 - 1.1 | 0.618 - 1.618 |
| 'COL Poruchik' | 1.0 *min - 1.0 *max | 0.382 - 2.618 | 0.128 - 3.618 | 0.618 - 3.618 |
| 'Henry – David' | 0.618 - 0.886 | 0.44 - 0.618 | 0.128 - 2.0 | 0.618 - 1.618 |
| 'DAVID VM 1' | 1.618 - 1.618 | 0.382*min - 0.382*max | 0.128 - 1.618 | 0.618 - 3.618 |
| 'DAVID VM 2' | 1.618 - 1.618 | 0.382*min - 0.382*max | 1.618 - 3.618 | 0.618 - 7.618 |
| 'Partizan' | 1.618*min - 1.618*max | 0.382*min - 0.382*max | 0.128 - 3.618 | 0.618 - 3.618 |
| 'Partizan 2' | 1.618 - 2.236 | 1.128 - 1.618 | 0.128 - 3.618 | 1.618 - 3.618 |
| 'Partizan 2.1' | 1.618*min - 1.618*max | 1.128*min - 1.128*max | 0.128 - 3.618 | 0.618 - 3.618 |
| 'Partizan 2.2' | 2.236*min - 2.236*max | 1.128*min - 1.128*max | 0.128 - 3.618 | 0.618 - 3.618 |
| 'Partizan 2.3' | 1.618*min - 1.618*max | 0.618 - 1.618 | 0.128 - 3.618 | 0.618 - 3.618 |
| 'Partizan 2.4' | 2.236*min - 2.236*max | 1.618*min - 1.618*max | 0.128 - 3.618 | 0.618 - 3.618 |
| 'TOTAL' | 1.272 - 3.618 | 0.382 - 2.618 | 0.276 - 0.786 | 0.618 - 1.618 |
| 'TOTAL NN' | 1.272 - 4.236 | 0.382 - 2.618 | 0.236 - 0.786 | 0.618 - 1.618 |
| 'TOTAL 1' | 1.272 - 2.618 | 0.382 - 0.886 | 0.382 - 0.786 | 0.786 - 0.886 |
| 'TOTAL 2' | 1.618 - 3.618 | 0.382 - 0.886 | 0.382 - 0.786 | 1.128 - 1.618 |
| 'TOTNN 2NN' | 1.618 - 4.236 | 0.382 - 0.886 | 0.382 - 0.786 | 1.128 - 1.618 |
| 'TOTAL 3' | 1.272 - 2.618 | 1.128 - 2.618 | 0.276 - 0.618 | 0.618 - 0.886 |
| 'TOTNN 3NN' | 1.272 - 2.618 | 1.128 - 2.618 | 0.236 - 0.618 | 0.618 - 0.886 |
| 'TOTAL 4' | 1.618 - 2.618 | 1.128 - 2.618 | 0.382 - 0.786 | 1.128 - 1.272 |
| 'BG 1' | 2.618*min - 2.618*max | 0.382*min - 0.382*max | 0.128 - 0.886 | 1.0 *min - 1.0 *max |
| 'BG 2' | 2.237*min - 2.237*max | 0.447*min - 0.447*max | 0.128 - 0.886 | 1.0 *min - 1.0 *max |
| 'BG 3' | 2.0 *min - 2.0 *max | 0.5 *min - 0.5 *max | 0.128 - 0.886 | 1.0 *min - 1.0 *max |
| 'BG 4' | 1.618*min - 1.618*max | 0.618*min - 0.618*max | 0.128 - 0.886 | 1.0 *min - 1.0 *max |
| 'BG 5' | 1.414*min - 1.414*max | 0.707*min - 0.707*max | 0.128 - 0.886 | 1.0 *min - 1.0 *max |
| 'BG 6' | 1.272*min - 1.272*max | 0.786*min - 0.786*max | 0.128 - 0.886 | 1.0 *min - 1.0 *max |
| 'BG 7' | 1.171*min - 1.171*max | 0.854*min - 0.854*max | 0.128 - 0.886 | 1.0 *min - 1.0 *max |
| 'BG 8' | 1.128*min - 1.128*max | 0.886*min - 0.886*max | 0.128 - 0.886 | 1.0 *min - 1.0 *max |
|-------------------|------------------------|------------------------|-----------------------|-----------------------|
🔶 SETTINGS
🔹 Swings
Minimum Swing Length: Minimum length used for the swing detection.
Maximum Swing Length: Maximum length used for the swing detection.
🔹 Patterns
Toggle Pattern Block
Toggle separate pattern in each Pattern Block
🔹 Tolerance
Fibonacci Ratio: Adds a percentage tolerance below/above the ratio when only one ratio applies, creating two limits.
Triangle Area Ratio: Filters patterns based on the ratio of the smallest triangle to the largest triangle.
🔹 Display
Labels: Display Pattern Names, Arrows or nothing
Patterns: Display or not
Last Line: Display previous C-D line when updated
🔹 Style
Colors: Pattern Lines/Names/Arrows - background color of patterns
Text Size: Text Size of Pattern Names/Arrows
🔹 Calculation
Calculated Bars: Allows the usage of fewer bars for performance/speed improvement
MichaelSuperTimeFrameMichaelSuperTimeFrame
MichaelSuperTimeFrame is a powerful multi-timeframe tool designed to help traders identify key price levels by dynamically plotting the highest and lowest values for a user-defined timeframe. Whether you’re a scalper, day trader, or swing trader, this indicator simplifies multi-timeframe analysis and enhances your decision-making process by providing clear and actionable insights.
Features:
Customizable Timeframe: Select any timeframe (e.g., hourly, 4-hour, daily) to view high and low levels.
Dynamic Updates: Automatically adjusts to reflect the latest highs and lows for the chosen timeframe.
Clear Visual Markers: Highlights critical support and resistance levels with clean lines and labels.
Multi-Purpose Utility: Suitable for identifying potential breakout levels, stop-loss placements, and price reversals.
How It Works:
Select your desired timeframe in the settings.
The script fetches and plots the high and low prices for the specified timeframe directly on your chart.
Green lines and labels indicate the high levels, while red lines and labels indicate the low levels.
How to Use It:
Trend Analysis: Identify potential breakout zones by observing price interaction with the plotted levels.
Support/Resistance: Use the levels as key support and resistance zones for trade entries or exits.
Stop Placement: Safely place stops above/below key levels based on the timeframe’s context.
Why It's Unique:
MichaelSuperTimeFrame stands out by combining simplicity and flexibility, allowing traders to seamlessly integrate multi-timeframe analysis into their strategies. Its clear visual representation eliminates chart clutter, making it a valuable addition to any trader’s toolkit.
Disclaimer:
This script is designed for educational purposes and is not a trading signal provider. Past performance of any method or indicator is not indicative of future results. Always perform your own analysis before making trading decisions.

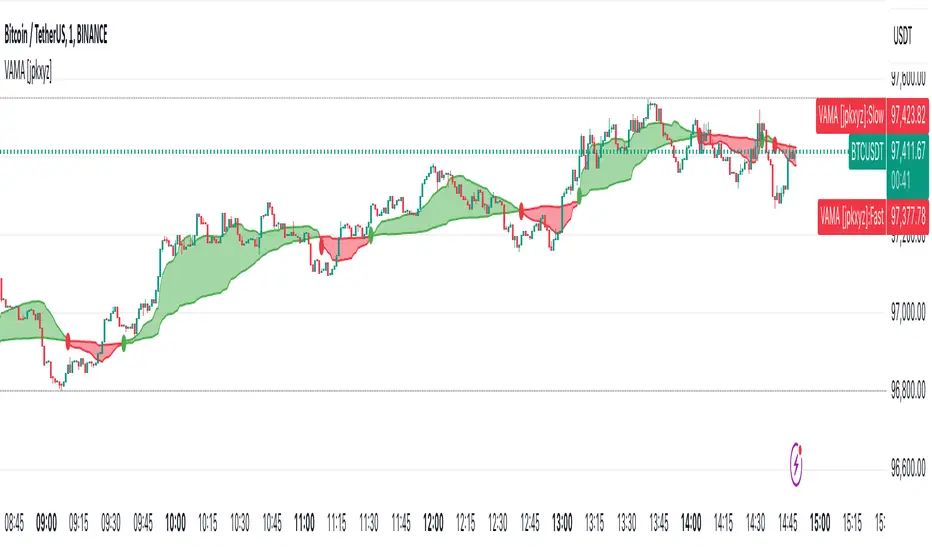
VAMA - Volume Adjusted Moving Average [jpkxyz]VAMA is a moving average that adapts to volume, giving more weight to price movements backed by higher relative volume. This VAMA (Volume Adjusted Moving Average) indicator implementation emphasizes visual clarity. It is based on the VAMA script by @allanster
Dual VAMA lines (Fast/Slow) with dynamic coloring:
Single-color scheme switches between green (bullish) and red (bearish)
Color changes on crossovers rather than relative position
Configurable line widths (set to 1 for clean appearance)
Visual enhancements:
Optional fill between VAMA lines (50% transparency)
Crossover dots can be toggled
Fills and dots match the current trend color
Customization parameters:
Independent source inputs for Fast/Slow lines
Adjustable VI Factor (volume influence)
Sample size control
Strict/non-strict calculation toggle
The code maintains efficient computation while prioritizing visual feedback for trend changes. It's designed for clear signal identification without visual clutter.
Notable style choices:
Consistent color theming throughout all visual elements
Simplified color transitions (only at crossovers)
Subtle transparency for fill areas
Minimal dot size for crossover markers
VAMA (Volume Adjusted Moving Average) Technical Analysis:
Core Calculation:
1. Volume Influence (v2i):
v2i = volume / ((total_volume/total_periods) * volume_factor)
- total_volume: Sum of volume over sample period
- total_periods: Either full history (nvb=0) or specified sample size
- volume_factor: Controls sensitivity to volume deviation
2. Price Weighting:
weighted_price = source_price * v2i
3. Accumulation Process:
- Iterates through length*10 periods
- Accumulates weighted prices and volume influence values
- Continues until volume influence sum >= specified length or strict rule triggers
4. Final VAMA Value:
vama = (weighted_sum - (volume_sum - length) * last_price) / length
Parameters:
- SampleN: Historical reference length (0=full history)
- Length: Base period for calculation
- VI Factor: Volume influence multiplier (>0.01)
- Strict: Forces exact length period completion when true
- Source: Input price data
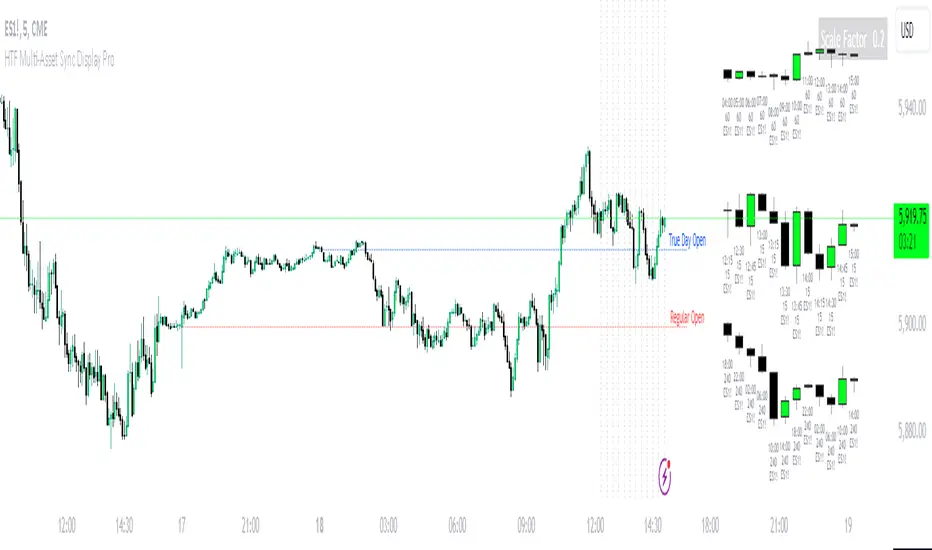
HTF Multi-Asset Sync Display ProHTF Multi-Asset Sync Display Pro
A professional-grade indicator designed for advanced multi-timeframe and multi-symbol analysis. This powerful tool enables synchronized visualization of up to three different assets across various timeframes, making it perfect for correlation analysis, market structure comparison, and smart money tracking.
Overview
HTF Multi-Asset Sync Display Pro is an advanced visualization tool that allows traders to monitor up to three different symbols simultaneously on a single chart. Whether you're analyzing correlations, divergences, or inter-market relationships, this indicator provides a comprehensive solution for complex market analysis.
Usage Examples
1. Multi-Timeframe Analysis of Single Symbol
Perfect for traders focusing on market structure and order flow:
- Configure all three sets to display different higher timeframes of the chart's main symbol
- Example: On 5M chart, display 15M, 1H, and 4H timeframes
Benefits:
- Clear visualization of higher timeframe market structure
- Real-time order flow analysis across multiple timeframes
- Better context for ICT PD Arrays on higher timeframes
- Enhanced understanding of support/resistance levels
- Improved timing for entries and exits
2. Correlated Assets Analysis
Ideal for traders working with related instruments:
- Display higher timeframes of correlated assets (e.g., ES, NQ, and YM)
Benefits:
- Easy identification of divergences between correlated symbols
- Enhanced probability assessment for CRT setups
- Improved Turtle Soup trading opportunities
- Clear visualization of relative strength/weakness
- Better timing for market reversals
3. Extended Analysis with Multiple Indicators
Advanced setup for comprehensive market analysis:
- Use two instances of the indicator to display up to 6 different HTF sets
- Synchronization capabilities ensure precise alignment between indicators
Benefits:
- Extended market coverage with up to 6 HTF sets
- Perfect synchronization between indicator instances
- Comprehensive view of market structure
- Enhanced correlation analysis capabilities
- Maximum flexibility in timeframe selection
Note: The ability to combine multiple instances of the indicator, each showing three HTF sets, provides traders with unprecedented analytical capabilities while maintaining perfect synchronization across all displayed timeframes.
Key Features
Multi-Symbol Display
- Display up to three different symbols simultaneously
- Up to 12 candles for each symbol
- Customizable colors and styles for each symbol
- Adjustable vertical offsets for optimal visual arrangement
- Flexible scale factor for precise price movement comparison
Comprehensive Timeframe Support
- Intraday: 1, 2, 3, 4, 5, 6, 10, 15, 30, 45, 60, 90, 120, 180, 240 minutes
- Daily: D, 2D
- Weekly: W, 2W
- Monthly: M
- Compatibility between all minutes timeframes for synchronization
Dual Synchronization Modes
Auto Mode
- Automatic alignment based on relative price levels
- Perfect for quick visual comparison
Manual Mode
- Precise synchronization based on candle closing times
- Ideal for detailed technical analysis
Session Markers
- Two configurable session lines (e.g., Regular Open and True Day Open)
- Adjustable line length, style, and color
- Flexible timezone support for global markets
Visual Customization
- Fully customizable candle appearance including wicks
- Optional vertical lines for better time orientation
- Scalability for optimal price movement comparison
- Professional labeling system
Trading Applications
Correlation Analysis
- Monitor relationships between currency pairs
- Analyze crypto/stock correlations
- Identify divergences between related instruments
- Track inter-market relationships
Smart Money Analysis
- Identify accumulation zones
- Detect manipulation phases
- Track distribution phases
- Analyze institutional levels
- Monitor smart money footprints
ICT Price Delivery (PD) Arrays Analysis
- Enhanced visualization for manual PD Arrays identification
- Clear display of higher timeframe price action
- Improved visibility of potential PD Array structures
- Better context for manual analysis
Visual aid for ICT concepts identification
- Helps traders manually spot potential Breaker Blocks and Order Blocks
- Clearer view for identifying Inefficient Price Points
- Better context for Fair Value Gaps analysis
- Enhanced visibility for Mitigation Points and Liquidity Voids detection
Note: This indicator provides enhanced visualization tools to support manual ICT analysis. It does not automatically detect or mark PD Arrays or other ICT concepts - it serves as a visual aid for traders who understand and manually apply ICT concepts in their analysis.
Market Structure Analysis
- Compare price structure across timeframes
- Identify key levels on multiple timeframes
- Analyze session breakouts and swings
- Track market structure shifts
Candle Range Theory (CRT)
- Compare candle ranges across timeframes
- Identify potential breakout/breakdown levels
- Analyze relationships between HTF and LTF candle ranges
- Recognize reversal points at HTF range extremes
Turtle Soup Strategy Enhancement
- Identify false breakouts
- Validate breakouts by comparing LTF momentum with HTF structure
- Precise entry and exit level determination
Trading Efficiency
Time Management
- All necessary information on one chart
- Eliminate timeframe switching
- Quick market condition analysis
- Enhanced trading efficiency
Decision Making
- Instant market structure overview
- Quick key level identification
- Efficient trade setup confirmation
- Better entry and exit timing
Note
For optimal results, we recommend starting by setting the Base Price Level to the approximate price level of the main symbol, then adjusting the vertical offsets of other symbols according to your preferences.
GP - SRSI ChannelGP - SRSI Channel Indicator
The GP - SRSI Channel is a channel indicator derived from the Stochastic RSI (SRSI) oscillator. It combines SRSI data from multiple timeframes to analyze minimum, maximum, and closing values, forming a channel based on these calculations. The goal is to identify overbought and oversold zones with color coding and highlight potential trading opportunities by indicating trend reversal points.
How It Works
SRSI Calculation: The indicator calculates the Stochastic RSI values using open, high, low, and close prices from the selected timeframes.
Channel Creation: Minimum and maximum values derived from these calculations are combined across multiple timeframes. The midpoint is calculated as the average of these values.
Color Coding: Zones within the channel are color-coded with a gradient from red to green based on the ratios. Green zones typically indicate selling opportunities, while red zones suggest buying opportunities.
Visual Elements:
The channel boundaries (min/max) are displayed as lines.
Overbought/oversold regions (95-100 and 0-5) are highlighted with shaded areas.
Additional explanatory labels are placed on key levels to guide users.
How to Use
Trading Strategy: This indicator can be used for both trend following and identifying reversal points. Selling opportunities can be evaluated when the channel reaches the upper green zone, while buying opportunities can be considered in the lower red zone.
Timeframe Selection: Users can analyze multiple timeframes simultaneously to gain a broader perspective.
Customization: RSI and Stochastic RSI parameters are adjustable, allowing users to tailor the indicator to their trading strategies.
Important Note
This indicator is for informational purposes only and should not be used as a sole basis for trading decisions. Please validate the results of the indicator with your own analysis.

TrendLines MTF [Cometreon]TrendLines MTF is a next-generation indicator designed to automatically detect and plot all relevant trendlines across any symbol and timeframe—including higher ones. Using advanced algorithms, it constantly scans price action and updates the chart in real-time, offering a fast, precise, and dynamic view of market structure.
This tool streamlines market analysis and boosts decision-making by eliminating the need for manual trendline drawing.
🔷 Key Features
🟩 Automatic Plotting
The indicator automatically draws and updates trendlines, providing a real-time overview of market trends.
🟩 Breakout and Bounce Signaling
Provides immediate notifications when a trendline is broken or the price bounces off it, allowing traders to react promptly to market changes.
🟩 Customization
Offers the ability to modify length, touches, colors, and line style to suit individual preferences.
🟩 Information Table
Includes a detailed table showing the values of all active trendlines, facilitating the monitoring of key market points.
🟩 Configurable Alerts
Allows setting custom alerts for breakouts, bounces, or creation of new trendlines.
🔷 Technical Details and Customizable Inputs
Trendline offers a range of customizable inputs that allow adapting the indicator to specific needs:
1️⃣ Trendline Type - Select between active trendlines, broken ones, both, or none.
2️⃣ Left and Right Length - Defines the extension of maximum and minimum points to identify Trendlines.
3️⃣ Timeframe - You can also modify the timeframe of Trendlines to display a higher timeframe.
4️⃣ Confirm at Timeframe - Allows you to confirm the Trendlines using the chart's timeframe instead of the selected one. This checks whether a candle has already broken the line previously.
5️⃣ Delete at Timeframe - Input to remove trendlines based on breakouts with chart candles, instead of using candles of a higher timeframe.
6️⃣ Touch Need - Sets the number of touches needed to confirm a Trendline.
7️⃣ Max Trend Line for Level - Limits the maximum number of Trendlines in a single level.
8️⃣ Extended Line After Break - Option to extend broken Trendlines by a specific value.
9️⃣ Session Range - The "Session Range" offers two options: select a specific date or a period relative to the last candle. The input allows choosing between "Choose" and "Pick Up".
With "Choose", you select a relative period, with two modes:
Last : shows the trendlines of the selected period, compatible with Replay.
Real Time : displays all TrendLines, searching from the last selected period.
Example: "1 Month" with "Last" shows the TrendLines from the previous month, while "Real Time" searches without time limits but uses the values from the last month. This allows defining the search depth of the indicator, crucial for computing power. In case of issues, use "Auto".
1️⃣0️⃣ Trendlines Style - Modify the style for each type of Trendlines (Valid, Break) including color, style, and line thickness.
1️⃣1️⃣ Trends Trendlines - Enable/disable two different trends:
Trend Bar Color : based on TrendLines breakouts. Breaking a bearish TrendLine results in a bullish trend, vice versa for breaking a bullish TrendLine.
Trend Background : based on the number of active TrendLines. For example, if the number of bullish TrendLines is greater than the "Strength", the trend will be bullish.
1️⃣2️⃣ Signal Style - You can enable or disable breakout and bounce signals, with customizable colors for each signal type.
1️⃣3️⃣ Alert - Set notifications for breakouts, bounces, or formation of new Trendlines.
1️⃣4️⃣ Table - Customize the table showing the values of all active trendlines, facilitating the monitoring of key market points. You can modify the appearance of the table, changing the color of cells and text.
These options allow you to optimize the indicator for different trading styles and market conditions, ensuring precise and personalized technical analysis.
🔍 How to Use Trendlines MTF
📌 Market Analysis
Use the displayed Trendlines as critical indicators of market dynamics to make informed trading decisions.
📈 Signal Interpretation
Leverage Trendline breakouts and bounces to identify potential trend changes and trading opportunities.
🛠 Strategy Integration
Use Trendlines and generated signals as a basis for creating personalized and innovative trading strategies.
☄️ With Trendlines, you can simplify your market analysis, saving time and improving the accuracy of your decisions with clearly visualized and customizable Trendlines.
Don't waste any more time and visit the link to get access to all Cometreon indicators.

Dynamic Time Period CandlesThis indicator gives the dynamic history of the current price over various time frames as a series of candles on the right of the display, with optional lines on the chart, so that you can assess the current trend more easily.
In the library I found lots of indicators that looked at the previous xx time period candle, but they then immediately switched to the new xx time candle when it started to be formed. This indicator looks back at the rolling previous time period. With this indicator, you can clearly see how price has been behaving over time.
IMPORTANT SETUP INFO:
Initially, you must go into the settings and select the timeframe (in minutes) that your chart is displaying. If you don't do this then the indicator will look back the wrong number of candles and give you totally wrong results.
You can then setup how high you want the candle labels to be on the chart.
Then you can select settings for each candle that you want displayed. Anywhere between 1 and 5 different timeframes can be displayed on the chart at once.
I initially published an indicator called 'Dynamic 4-Hour Candle (Accurate Highs and Lows)', but this new indicator is so different that it needs to be forked and published as a separate indicator. The reasons for this are below:
The original indicator only looked at the previous 4 hour time period. This indicator allows the user to select any time period that they choose.
The original indicator only looked at one time period. This indicator allows to select between one and five time periods on the chart at once.
The original indicator did not put lines on the chart to show the lookback period and the highs and lows of that time period. This indicator does both those things.
The name of the original indicator in no way now describes what this new indicator is capable of, and would be very misleading to anyone who came across it. This new indicator has a name that much more accurately reflects what its' purpose and functionality is.

Higher Time Frame Support/Resistance [BigBeluga]The Higher Time Frame Support/Resistance indicator is a tool designed to display pivot points derived from higher timeframes on your current chart. These pivot points are calculated based on the highs and lows of price action in different timeframes, and the indicator draws horizontal lines to represent these levels. These lines act as potential support and resistance zones, giving traders key market levels that may influence future price movement.
Each pivot line is color-coded and labeled with its price value and the timeframe it originates from. This allows traders to clearly differentiate between the significance of the levels based on their timeframe. For example, weekly pivot levels may represent stronger, more long-term support and resistance, while hourly pivots offer more immediate, short-term levels to watch.
🔵 IDEA
The Higher Time Frame Support/Resistance indicator is designed to simplify the process of tracking key support and resistance levels across multiple timeframes. Pivot points, which represent turning points in the market, are essential for identifying areas where price might reverse or break out. By displaying these levels from higher timeframes directly on the current chart, traders can quickly identify and react to critical areas in the market without needing to switch between different timeframe charts.
The indicator labels each pivot point with the specific timeframe it comes from (e.g., 4H, 1D, 1W), making it easy for traders to assess the relative strength of each level. Stronger levels from higher timeframes are likely to act as more significant barriers or support zones, while lower timeframe levels can be used for more precise entries and exits.
🔵 KEY FEATURES
Pivot Levels from Multiple Timeframes:
The indicator calculates pivot highs and lows from various higher timeframes (e.g., 4H, 1D, 1W) and plots these levels on the current chart. These pivot points are represented by horizontal lines that extend across the chart, serving as potential support and resistance zones.
Color-Coded Support and Resistance Lines:
Each pivot level is color-coded based on its timeframe, helping traders quickly differentiate between short-term and long-term support and resistance. This visual aid simplifies the analysis and allows for a clearer understanding of key market levels.
Price Labels and Timeframe Information:
In addition to the pivot lines, the indicator displays labels at each level with the corresponding price and timeframe. For example, a label may show "D Pivot High" followed by the exact price. This helps traders understand the origin and significance of each line, allowing for more informed trading decisions.
Labels up and down mark highs and lows from higher timeframes:
Pivot Shadows for Enhanced Clarity:
The indicator can also draw shadow lines that represent the pivot points but with increased transparency. These shadows allow traders to keep track of previous pivots without cluttering the chart with too many solid lines. The width and transparency of these shadows can be customized in the settings.
🔵 HOW TO USE
🔵 CUSTOMIZATION
Timeframes and Pivot Length: Customize which higher timeframes (e.g., 4H, 1D, 1W) you want to display pivot levels from. Adjust the pivot length to control how sensitive the indicator is in detecting market highs and lows.
Line Style and Colors: Adjust the line style (solid, dashed, dotted) and colors for each timeframe to match your personal preference or chart theme. This customization helps in maintaining a clear and visually appealing chart.
Shadow Line Width and Transparency: Control the width and transparency of the shadow pivot lines to reduce chart clutter while still keeping track of key historical levels.

Enhanced Pressure MTF ScreenerEnhanced Pressure Multi-Timeframe (MTF) Screener Indicator
Overview
The Enhanced Pressure MTF Screener is an add-on that extends the capabilities of the Enhanced Buy/Sell Pressure, Volume, and Trend Bar Analysis . It provides a clear and consolidated view of buy/sell pressure across multiple timeframes. This indicator allows traders to determine when different timeframes are synchronized in the same trend direction, which is particularly useful for making high-confidence trading decisions.
Image below: is the Enhanced Buy/Sell Pressure, Volume, and Trend Bar Analysis with the Enhanced Pressure MTF Screener indicator both active together.
Key Features
1.Multi-Timeframe Analysis
The indicator screens various predefined timeframes (from 1 week down to 10 minutes).
It offers a table view that shows buy or sell ratings for each timeframe, making it easy to see which timeframes are aligned.
Traders can choose which timeframes to include based on their trading strategies (e.g., higher timeframes for position trading, lower timeframes for scalping).
2.Pressure and Trend Calculation
Uses Buy and Sell Pressure calculations from the Enhanced Buy/Sell Pressure indicator to determine whether buying or selling is dominant in each timeframe.
By analyzing pressures on multiple timeframes, the indicator gives a comprehensive perspective of the current market sentiment.
The indicator calculates whether a move is strong based on user-defined thresholds, which are displayed in the form of additional signals.
3.Heikin Ashi Option
The Heikin Ashi candle type can be toggled on or off. Using Heikin Ashi helps smooth out market noise and provides a clearer indication of trend direction.
This is particularly helpful for traders who want to filter out market noise and focus on the primary trend.
4.Table Customization
Table Positioning: The table showing timeframe data can be positioned at different locations on the chart—top, middle, or bottom.
Text and Alignment: The alignment and text size of the table can be customized for better visual clarity.
Color Settings: Users can choose specific colors to indicate buying and selling pressure across timeframes, making it easy to interpret.
5.Strong Movement Indicators
The screener provides an additional visual cue (🔥) for timeframes where the movement is deemed strong, based on a user-defined threshold.
This helps highlight timeframes where significant buying or selling pressure is present, which could signal potential trading opportunities.
How the Screener Works
1.Pressure Calculation
For each selected timeframe, the indicator retrieves the Open, High, Low, and Close (OHLC) values.
It calculates buy pressure (the range between high and low when the closing price is higher than the opening) and sell pressure (the range between high and low when the closing price is equal to or lower than the opening).
The screener computes the pressure ratio, which represents the difference between buying and selling pressure, to determine which side is dominant.
2.Trend Rating and Signal Generation
Based on the calculated pressure, the screener determines a trend rating for each timeframe: "Buy," "Sell," or "Neutral." (▲ ,▼ or •)
Additionally, it generates a signal (▲ or ▼) to indicate the current trend direction and whether the move is strong (based on the user-defined threshold).
If the movement is strong, a fire icon (🔥) is added to indicate that there is significant pressure on that timeframe, signaling a higher confidence in the trend.
3.Customizable Strong Move Thresholds
Strong Move Threshold: The screener uses this value to decide whether a trend is significantly strong. A higher value makes it more selective in determining strong moves.
Strong Movement Threshold: Helps determine when an additional strong signal should be displayed, offering further insight into the strength of market movement.
Inputs and Customization
The Enhanced Pressure MTF Screener is highly customizable to fit the needs of individual traders:
General Settings:
Use Heikin Ashi: Toggle this setting to use Heikin Ashi for a smoother trend representation.
Strong Move Threshold: Defines how strong a move should be to be considered significant.
Strong Movement Threshold: Specifies the level of pressure required to highlight a move with the fire icon.
Table Settings:
Position: Choose the vertical position of the screener table (top, middle, or bottom of the chart).
Alignment: Align the table (left, center, or right) to best suit your chart layout.
Text Size: Adjust the text size in the table for better readability.
Table Color Settings:
Users can set different colors to represent buying and selling signals for better visual clarity, particularly when scanning multiple timeframes.
Timeframe Settings:
The screener provides options to include up to ten different timeframes. Traders can select and customize each timeframe to match their strategy.
Examples of available timeframes include 1 Week, 1 Day, 12 Hours, down to 10 Minutes, allowing for both broad and detailed analysis.
Practical Use Case
Identifying Trend Alignment Across Timeframes:
Imagine you are about to take a long trade but want to make sure that the trend direction is aligned across multiple timeframes.
The screener displays "Buy" ratings across the 4H, 1H, 30M, and 10M timeframes, while higher timeframes (like 1W and 1D) also show "Buy" with strong signals (🔥). This indicates that buying pressure is strong across the board, adding confidence to your trade.
Spotting Reversal Opportunities:
If a downtrend is evident across most timeframes but suddenly a higher timeframe, such as 12H, changes to "Buy" while showing a strong move (🔥), this could indicate a potential reversal.
The screener allows you to spot these discrepancies and consider taking early action.
Benefits for Traders
1.Synchronization Across Timeframes:
One of the main strengths of this screener is its ability to show synchronized buy/sell signals across different timeframes. This makes it easy to confirm the strength and consistency of a trend.
For example, if you see that all the selected timeframes display "Buy," this implies that both short-term and long-term traders are favoring the upside, giving additional confidence to go long.
2.Quick and Visual Trend Overview:
The table offers an at-a-glance summary, reducing the time required to manually inspect each timeframe.
This makes it particularly useful for traders who want to make quick decisions, such as day traders or scalpers.
3.Strong Move Indicator:
The use of fire icons (🔥) provides an easy way to identify significant movements. This is particularly helpful for traders looking for breakouts or strong market conditions that could lead to high probability trades.
To put it short or to summarize
The Enhanced Pressure MTF Screener is a powerful add-on for traders looking to understand how buy and sell pressure aligns across multiple timeframes. It offers:
A clear summary of buying or selling pressure across different timeframes.
Heikin Ashi smoothing, providing an option to reduce market noise.
Strong movement signals to highlight significant trading opportunities.
Customizable settings to fit any trading strategy or style.
The screener and the main indicator are best used together, as the screener provides the multi-timeframe overview, while the main indicator provides an in-depth look at each individual bar and trend.
I hope my indicator helps with your trading, if you guys have any ideas or questions there is the comment section :D

Black Moving AveragesGENERAL OVERVIEW
The moving average (MA) indicator is a foundational yet versatile tool in technical analysis, used by traders and investors to smooth out price data over a specific time frame. This helps to identify the direction of a trend by filtering out short-term fluctuations or "noise" in the price action. By observing the moving average line, traders can gain insights into potential support and resistance levels, trend strength, and possible trend reversals. Moving averages are especially useful in trending markets, where they can enhance the timing of entries and exits.
The Black Moving Averages indicator is an enhanced Moving Average indicator with unique features in one indicator, features like multi-timeframe, multi-types/length, custom labelling and moving average compact PANEL with multi-symbol support.
📌HOW DOES IT WORK
A moving average is a constantly updated average price calculated by adding up the closing prices of a security over a set period and dividing by the total number of periods.
Uptrend: If the moving average line is sloping upwards and the price is above the moving average, this typically indicates an uptrend.
Downtrend: If the moving average slopes downward with price action mostly below it, a downtrend is likely in effect.
Flat/Sideways Trend: When the moving average is flat, it suggests a range-bound or consolidating market with no clear trend.
Common Moving Average Periods:
The choice of period for a moving average can vary significantly depending on the trader’s strategy:
Short-Term Traders: Often use periods such as 5, 10, or 20 (intraday or daily) to capture quick price movements.
Medium-Term Traders: Typically use 50-period MAs, which can help spot trend changes within a few weeks to a few months.
Long-Term Traders/Investors: Favor 100, 200, or even 250-period MAs to analyze the overarching trend in daily or weekly charts.
📌HOW TO USE IT
When an asset's price crosses above its moving average, it can be a signal to buy, while crossing below can be a signal to sell.
Moving Average Crossovers: When a short-term moving average crosses above a long-term moving average, it generates a “Golden Cross,” indicating a bullish trend. Conversely, when a short-term MA crosses below a long-term MA, this creates a “Death Cross,” signalling a potential bearish trend.
Moving Average Envelopes and Bands: Some traders use moving averages to create envelopes or bands (e.g., Bollinger Bands), which add upper and lower bands around the moving average. These can help to assess the volatility and gauge potential price reversals.
Dynamic Support and Resistance: Longer-term MAs, such as the 200-day SMA, often act as dynamic support or resistance. If the price bounces off this MA several times, it reinforces the indicator’s significance.
Trend Confirmation and Continuation: Traders can confirm trends by observing if the price consistently stays above or below the moving average. This can be a signal to maintain an existing position.
Crossover Signals for Entries and Exits: A crossover strategy, where a shorter MA crosses above or below a longer MA, can serve as a reliable entry or exit point. This is particularly popular for catching early trend changes.
Combining with Other Indicators: Moving averages often yield better results when used alongside other indicators, such as the Relative Strength Index (RSI) for confirming overbought or oversold conditions, or the MACD for gauging momentum.
Limitations of Moving Averages
Lagging Nature: Moving averages rely on historical data, which makes them inherently lagging indicators, meaning they tend to react after a trend is already underway.
False Signals: In range-bound or choppy markets, moving averages can produce false signals, leading to potentially unprofitable trades.
When to be cautious:
When an asset's price is driven by strong momentum, it can remain over-extended for a long time. In this case, slight pauses may be mistaken for reversals.
By refining your understanding of moving averages and using them within the broader context of technical analysis, you can leverage their simplicity and effectiveness to better time entries, and exits, and spot potential reversals in various types of market conditions.
Black Moving Averages Indicator Features:
Multiple Moving Averages with multiple types, lengths & Cross
Multi Timeframe support
Moving Average PANEL with TF, Multi Symbol, Type, Length & Trend Strength
Moving Averages Horizontal Display with Labels (Type, TF, Price)
⚙️Black Moving Average SETTINGS
+ Black Moving Averages Dashboard ◢
- Moving Averages: Enable/Disable the Moving Averages on Chart
- MA Cross: Enable/Disable the Moving Averages Cross plot on the Chart
- MA PANEL: Enable/Disable the Moving Averages Panel on Chart
- VWAP: Enable/Disable the VWAP on Chart
+ Moving Averages Display Settings ◢
- Switch to Horizontal Lines: It switches the moving averages lines into horizontal lines on the charts
- Labels: It allows users to display moving averages labels (TF, type, length), prices or both on the chart
- Label Text Size: The user can select label text size (Tiny, Small, Normal, Large, Huge)
- Label Offset: Input label offset value (distance of label display from moving averages)
+ Moving Average Settings ◢
- Moving Average Length: input value of moving average length
- Color: Color selection for moving average
- Timeframe: Selection of timeframe for the moving average
- Type: Selection of MA type for the moving average
- Source: Selection of MA source(close, open etc) for the moving average
- Style: Display style (Line, Cross, Circle) for the moving average
- Line width: Display width of the moving average
+ Moving Average Cross Settings ◢
- | | Coss A | :
Plots cross of two user-specified moving averages on the chart
- | | Coss B | :
Plots cross of two user-specified moving averages on the chart
- | | Coss C | :
Plots cross of two user-specified moving averages on the chart
+ Moving Average PANEL Settings ◢
- Override Panel Symbol: Enables user to select the symbol for MA PANEL
- MA Panel Symbol: Displays symbol on the MA PANEL
- Panel H/V Position: Displays MA Panel Horizontally or Vertically
- Moving Average Panel Position: Selection of MA Panel position on the chart
- Panel Text Size: The user can select panel text size (Tiny, Small, Normal, Large, Huge)
- Panel Text Color: Color selection for panel text
- Cross A: Displays moving averages bullish/bearish cross on the panel from "Moving Average Cross Settings"
- Cross B: Displays moving averages bullish/bearish cross on the panel from "Moving Average Cross Settings"
- Cross C: Displays moving averages bullish/bearish cross on the panel from "Moving Average Cross Settings"
- Panel MA Length: input value of panel moving average length
- Timeframe: Selection of timeframe for the panel moving average
- Type: Selection of MA type for the panel moving average
- Source: Selection of MA source(close, open etc) for the panel moving average
Feedback & Bug Report
if you found any bug in this indicator or any suggestion, please let me know. Please give feedback & appreciate it if you like to see more future updates and indicators. Thank you

Custom Time Frame BackgroundThis indicator allows you to highlight custom time frames on your chart with alternating background colors. It's particularly useful for visualizing specific intervals that are not standard on TradingView, such as 4-hour, 6-hour, or any other custom duration you choose. Features:
Customizable time frames: Set any combination of minutes, hours, and days
Fallback to daily/weekly coloring if no custom time frame is set
User-defined colors for alternating backgrounds
How to use:
Add the indicator to your chart
In the settings, input your desired custom time frame:
Set 'Custom Minutes' for intervals less than an hour
Use 'Custom Hours' for hourly intervals
Use 'Custom Days' for daily intervals
Adjust 'Color 1' and 'Color 2' to your preferred background colors
Examples:
For a 4-hour time frame: Set Custom Hours to 4
For a 6-hour time frame: Set Custom Hours to 6
For a 2-day time frame: Set Custom Days to 2
If all inputs are set to 0, the indicator will default to daily coloring for intraday charts and weekly coloring for higher timeframes. This indicator helps traders visually segment their charts into custom intervals, making it easier to identify patterns and trends over specific time periods.

MultiTimeframe Candles for Full Time Frame Continuity AnalysisIn honor of Rob Smith (R.I.P), the creator of TheStrat, I decided to try to figure out how to make an indicator that graphically shows you the price levels and movements on higher timeframes.
The goal is to have full timeframe continuity with TheStrat. Ideally when you are analyzing the lower time, you want it to be in continuity with the higher time frames.
How to Use It:
All you have to do is put on the indicator the number of times you desire.
So if you want the hourly, the daily, the weekly, and the monthly, then you have to just put on the indicator 4 times--once for each timeframe.
Then you go into each one you put on the chart and go to the drop down menu where you choose the timeframe you want displayed.
In the future, I'll do a video to show you exactly how that works, but I think you guys can figure it out.

Dynamic Score SMA [QuantAlgo]Dynamic Score SMA 📈🌊
The Dynamic Score SMA by QuantAlgo offers a powerful trend-following approach that combines the simplicity of the Simple Moving Average (SMA) with an innovative dynamic trend scoring technique . By continuously evaluating price movement relative to the SMA over a customizable window, this indicator adapts to varying market conditions, providing traders and investors with clearer, more adaptable trend signals. With this dynamic scoring approach, the Dynamic Score SMA helps identify trend shifts, allowing for more strategic decision-making.
🌟 Conceptual Foundation and Innovation
At the core of the Dynamic Score SMA is its dynamic trend score system , which assesses price movements by comparing them to the SMA over a series of historical data points. This technique goes beyond traditional SMA indicators by offering a dynamic, probabilistic evaluation of trend strength, delivering a more responsive and nuanced view of market direction. The integration of this scoring system enables traders and investors to navigate both trending and sideway markets with greater confidence and precision.
⚙️ Technical Composition and Calculation
The Dynamic Score SMA leverages the Simple Moving Average to establish a baseline trend, with customizable SMA length to control the indicator’s sensitivity. The dynamic trend scoring technique then evaluates price behavior relative to the SMA over a specified window, generating a trend score that reflects the current market bias.
When the score crosses the designated uptrend or downtrend thresholds, the indicator signals a potential trend shift. By adjusting the SMA length, window duration, and thresholds, users can refine the indicator’s responsiveness to match their preferred trading or investing strategy, making it suitable for both volatile and steady markets.
📈 Features and Practical Applications
Customizable SMA Length: Set the length of the SMA to control how sensitive the trend is to price changes. Longer lengths produce smoother trends, while shorter lengths increase responsiveness.
Window Length for Dynamic Scoring: Adjust the window length to determine how many data points are considered in the dynamic trend score calculation, allowing for more tailored analysis of recent versus long-term trends.
Uptrend/Downtrend Thresholds: Define thresholds for triggering trend signals. Higher thresholds reduce sensitivity, providing clearer signals in volatile markets, while lower thresholds capture shorter-term movements.
Bar and Background Coloring: Visual cues, including bar coloring and background fills, provide a quick reference for current trend direction, making it easier to monitor market conditions.
Trend Confirmation: The dynamic trend scoring system verifies trend strength, offering more reliable entry and exit points by filtering out potential false signals.
⚡️ How to Use
✅ Add the Indicator: Add the Dynamic Score SMA to your favourites, then apply it to your chart. Customize the SMA length, window size, and thresholds to match your trading or investing preferences.
👀 Monitor Trend Shifts: Observe the trend in relation to the SMA and watch for signals when the score crosses key thresholds. Bar and/or background coloring will help identify the current trend direction and any shifts in momentum.
🔔 Set Alerts: Configure alerts for significant trend crossovers and reversals, enabling you to act on market changes in real-time without needing constant chart observation.
💫 Summary and Usage Tips
The Dynamic Score SMA by QuantAlgo is a sophisticated trend-following indicator that combines the familiarity of the SMA with a dynamic trend scoring system, providing a more adaptable and probabilistic approach to trend analysis. By tailoring the SMA length, scoring window, and thresholds, traders and investors can fine-tune the indicator for both short-term adjustments and long-term trend following. For optimal use, adjust sensitivity based on market volatility, and rely on the visual cues for clear trend confirmation. Whether you’re navigating choppy markets or stable trends, the Dynamic Score SMA offers a refined approach to capturing market direction with enhanced precision.

CPR by NKDCentral Pivot Range (CPR) Trading Strategy:
The Central Pivot Range (CPR) is a widely-used tool in technical analysis, helping traders pinpoint potential support and resistance levels in the market. By using the CPR effectively, traders can better gauge market trends and determine favorable entry and exit points. This guide explores how the CPR works, outlines its calculation, and describes how traders can enhance their strategies using an extended 10-line version of CPR.
What Really Central Pivot Range (CPR) is?
At its core, the CPR consists of three key lines:
Pivot Point (PP) – The central line, calculated as the average of the previous day’s high, low, and closing prices.
Upper Range (R1) – Positioned above the Pivot Point, acting as a potential ceiling where price may face resistance.
Lower Range (S1) – Found below the Pivot Point, serving as a potential floor where price might find support.
Advanced traders often expand on the traditional three-line CPR by adding extra levels above and below the pivot, creating up to a 10-line system. This extended CPR allows for a more nuanced understanding of the market and helps identify more detailed trading opportunities.
Applying CPR for Trading Success
1. How CPR is Calculation
The CPR relies on the previous day's high (H), low (L), and close (C) prices to create its structure:
Pivot Point (PP) = (H + L + C) / 3
First Resistance (R1) = (2 * PP) - L
First Support (S1) = (2 * PP) - H
Additional resistance levels (R2, R3) and support levels (S2, S3) are calculated by adding or subtracting multiples of the previous day’s price range (H - L) from the Pivot Point.
2. Recognizing the Market Trend
To effectively trade using CPR, it’s essential to first determine whether the market is trending up (bullish) or down (bearish). In an upward-trending market, traders focus on buying at support levels, while in a downward market, they look to sell near resistance.
3. Finding Ideal Entry Points
Traders often look to enter trades when price approaches key levels within the CPR range. Support levels (S1, S2) offer buying opportunities, while resistance levels (R1, R2) provide selling opportunities. These points are considered potential reversal zones, where price may bounce or reverse direction.
4. Managing Risk with Stop-Loss Orders
Proper risk management is crucial in any trading strategy. A stop-loss should be set slightly beyond the support level for buy positions and above the resistance level for sell positions, ensuring that losses are contained if the market moves against the trader’s position.
5. Determining Profit Targets
Profit targets are typically set based on the distance between entry points and the next support or resistance level. Many traders apply a risk-reward ratio, aiming for larger potential profits compared to the potential losses. However, if the next resistance and support level is far then middle levels are used for targets (i.e. 50% of R1 and R2)
6. Confirmation Through Other Indicators
While CPR provides strong support and resistance levels, traders often use additional indicators to confirm potential trade setups. Indicators such as moving averages can
help validate the signals provided by the CPR.
7. Monitoring Price Action At CPR Levels
Constantly monitoring price movement near CPR levels is essential. If the price fails to break through a resistance level (R1) or holds firm at support (S1), it can offer cues on when to exit or adjust a trade. However, a strong price break past these levels often signals a continued trend.
8. Trading Breakouts with CPR
When the price breaks above resistance or below support with strong momentum, it may signal a potential breakout. Traders can capitalize on these movements by entering positions in the direction of the breakout, ideally confirmed by volume or other technical indicators.
9. Adapting to Changing Market Conditions
CPR should be used in the context of broader market influences, such as economic reports, news events, or geopolitical shifts. These factors can dramatically affect market direction and how price reacts to CPR levels, making it important to stay informed about external market conditions.
10. Practice and Backtesting for Improvements
Like any trading tool, the CPR requires practice. Traders are encouraged to backtest their strategies on historical price data to get a better sense of how CPR works in different market environments. Continuous analysis and practice help improve decision-making and strategy refinement.
The Advantages of Using a 10-Line CPR System
An extended 10-line CPR system—comprising up to five resistance and five support levels—provides more granular control and insight into market movements. This expanded view helps traders better gauge trends and identify more opportunities for entry and exit. Key benefits include:
R2, S2 Levels: These act as secondary resistance or support zones, giving traders additional opportunities to refine their trade entries and exits.
R3, S3 Levels: Provide an even wider range for identifying reversals or trend continuations in more volatile markets.
Flexibility: The broader range of levels allows traders to adapt to changing market conditions and make more precise decisions based on market momentum.
So in Essential:
The Central Pivot Range is a valuable tool for traders looking to identify critical price levels in the market. By providing a clear framework for identifying potential support and resistance zones, it helps traders make informed decisions about entering and exiting trades. However, it’s important to combine CPR with sound risk management and additional confirmation through other technical indicators for the best results.
Although no trading tool guarantees success, the CPR, when used effectively and combined with practice, can significantly enhance a trader’s ability to navigate market fluctuations.

Options Series - MTF_Parabolic_SAR
⭐ Purpose of the Script
This script, titled "Options Series - MTF_Parabolic_SAR," is designed for analyzing price trends using the Parabolic SAR (Stop and Reverse) indicator across multiple timeframes (MTF). It dynamically highlights bullish and bearish conditions, helping traders identify trends with improved accuracy. The script uses the Parabolic SAR across three customizable timeframes (default: 5, 15, and 60 minutes) to gauge the market sentiment.
⭐ Key Features and Insights:
Multi-Timeframe Parabolic SAR: The script calculates the Parabolic SAR for three different timeframes ( input_tf_1 , input_tf_2 , and input_tf_3 ). Traders can configure these timeframes to match their trading style (e.g., intraday, swing).
The SAR plots adapt to the selected timeframe, helping traders see different perspectives of price movement, such as short-term and long-term trends.
Bullish and Bearish Conditions: The script determines bullish and bearish conditions by comparing the close price against the Parabolic SAR in each timeframe.
If at least one timeframe indicates a bullish condition (close price above SAR), the bars are colored green . Conversely, if one timeframe signals bearish conditions (close below SAR), the bars turn red .
This provides an at-a-glance view of the price trend across multiple timeframes, offering insights into the market's strength and direction.
Visual Enhancements: Bar Coloring: Bars are visually enhanced with a color scheme: green for bullish , red for bearish , and gray for neutral conditions. This makes it easy to spot market trends and reversals directly on the chart. Candle Plotting: The current candle is plotted with the corresponding color and labeled with the SAR values for each timeframe. This aids traders in tracking real-time price action.
Labeling of SAR Values: The script displays SAR values for each timeframe as floating labels next to the chart. These labels contain the timeframe and the exact SAR value, making it easier to reference without cluttering the chart.
⭐ Trading Advantages: Customizable and Adaptive: The customizable timeframes and SAR settings allow traders to adapt the script to various market conditions and their specific trading strategies. This flexibility provides a powerful tool for identifying entry and exit points. Multi-Timeframe Insights: By considering multiple timeframes, the script offers a comprehensive market view, making it easier to confirm strong trends and avoid false signals.
⭐ How It Helps Traders: Trend Identification: By visualizing Parabolic SAR across multiple timeframes, traders can quickly assess trend strength and direction. Reversal Detection: The script's color changes (green to red or vice versa) signal potential trend reversals, offering critical information for managing trades and reducing risk.
🚀 Conclusion:
This script provides traders with a multi-timeframe analysis tool for identifying trends and potential reversals using the Parabolic SAR. By offering customizable timeframes, clear visual cues, and SAR value labeling, it simplifies decision-making and enhances market insights.
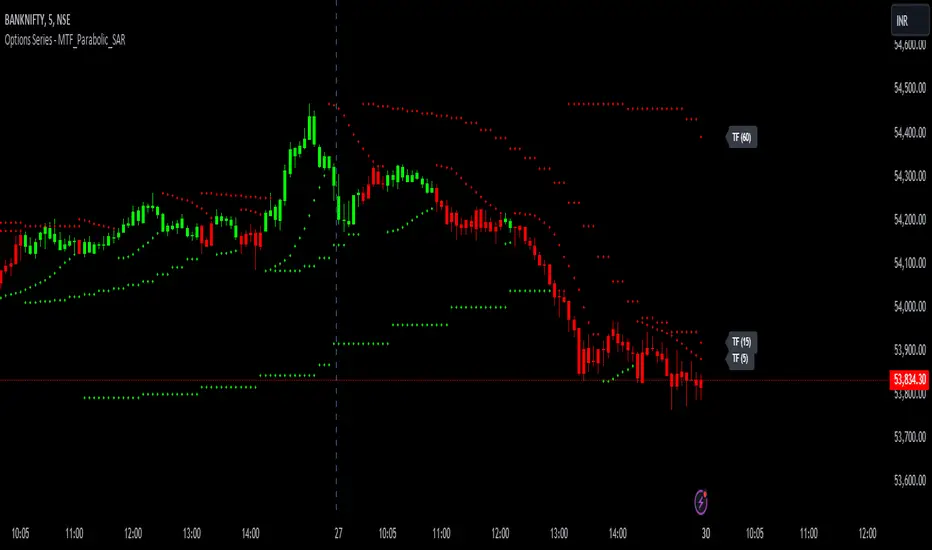
MENTFX AVERAGES MULTI TIMEFRAMEThe MENTFX AVERAGES MULTIME TIMEFRAME indicator is designed to provide traders with the ability to visualize multiple moving averages (MAs) from higher timeframes on their current chart, regardless of the chart's timeframe. It combines the power of exponential moving averages (EMAs) to help traders identify trends, spot potential reversal points, and make more informed trading decisions.
Key Features:
Multi-Timeframe Moving Averages: This indicator plots moving averages from daily timeframes directly on your chart, helping you keep track of higher timeframe trends while trading in any timeframe.
Customizable Moving Averages: You can adjust the length and visibility of up to three EMAs (default settings are 5, 10, and 20-period EMAs) to suit your trading style.
Overlay on Price: The indicator is designed to be overlaid on your price chart, seamlessly integrating with your existing analysis.
Simple but Effective: By offering a clear visual guide to where price is trading relative to important higher timeframe levels, this indicator helps traders avoid trading against major trends.
Why It’s Unique:
Validation Timeframe Flexibility: Unlike traditional moving average indicators that only work within the same chart's timeframe, the MENTFX AVERAGES M indicator allows you to pull moving averages from higher timeframes (default: Daily) and overlay them on any chart you're currently viewing, whether it's intraday (minutes) or even weekly. This cross-timeframe visibility is critical in determining the true market trend, adding context to your trades.
Customizability: Although the default settings focus on daily EMAs (5, 10, and 20 periods), traders can modify the parameters, including the type of moving average (Simple, Weighted, etc.), making it adaptable for any strategy. Whether you want shorter-term or longer-term averages, this indicator covers your needs.
Trend Confirmation Tool: The use of multiple EMAs helps traders confirm trend direction and potential price breakouts or reversals. For example, when the shorter-term 5 EMA crosses above the 20 EMA, it can signal a potential bullish trend, while the opposite could indicate bearish pressure.
How This Indicator Helps:
Identify Key Support and Resistance Levels: Higher timeframe moving averages often act as dynamic support and resistance. This indicator helps you stay aware of those critical levels, even when trading lower timeframes.
Trend Identification: Knowing where the market is relative to the 5, 10, and 20 EMAs from a higher timeframe gives you a clearer picture of whether you're trading with or against the prevailing trend.
Improved Decision Making: By aligning your trades with the direction of higher timeframe trends, you can increase your confidence in trade entries and exits, avoiding low-probability setups.
Multi-Market Use: This indicator works well across various asset classes—stocks, forex, crypto, and commodities—making it versatile for any trader.
How to Use:
Intraday Trading: Use the daily EMAs as a guide to see if intraday price movements align with longer-term trends.
Swing Trading: Plot daily EMAs to track the strength of a larger trend, using pullbacks to the moving averages as potential entry points.
Trend Trading: Monitor crossovers between the moving averages to signal potential changes in trend direction.
Default Settings:
5 EMA (Daily) – Blue Line
10 EMA (Daily) – Black Line
20 EMA (Daily) – Red Line
These lines will plot on your chart with a subtle opacity (33%) to ensure they don’t obstruct price action, while still providing crucial visual guidance on market trends.
This indicator is perfect for traders who want to blend technical analysis with multi-timeframe insights, helping you stay in sync with broader market movements while executing trades on any timeframe.

Custom Time Range HighlighterCustom Time Range Highlighter
This versatile indicator allows traders to highlight specific time ranges on their charts, accommodating users worldwide by supporting customizable UTC offsets. Traders can define two distinct time ranges, setting start and end hours in their local time zone.
A toggle option enables the display of highlights for today only , ensuring focus on current trading conditions.
Ideal for day traders and those following specific market sessions, this tool enhances visibility of active trading periods and aids in effective trade management.

Technical Analysis ExpressionsDescription:
The indicator allows to display different moving averages and price levels from any timeframe. Instead of setting each plot one by one, you can specify all of them in one expression.
Inputs:
There's only one input, which is a text area where you can specify each plot as an expression. Each expression must be on a new line. Each expression can specify the source of the displayed values, the plot color and the timeframe from which that value is taken.
Here's an example expression that will plot SMA(20) of Close price from Daily timeframe, and the plot is going to be red. This will also plot an EMA(50) of High price from current timeframe, and the plot is going to be green (notice that you can specify the color as one of the standard Pinescript colors, or using a HEX color, and even using transparency if needed):
SMA(close, 20) red "D"
EMA(high, 50) #00ff00
You can also specify the color to be "chart.fg" which is the Foreground Color of current chart (it depends on whether the "Dark Theme" is enabled in Tradingview). The available moving averages are: SMA, EMA, WMA, HMA, RMA, VWMA. The available sources are: open, high, low, close, hl2, hlc3, hlcc4, ohlc4.
