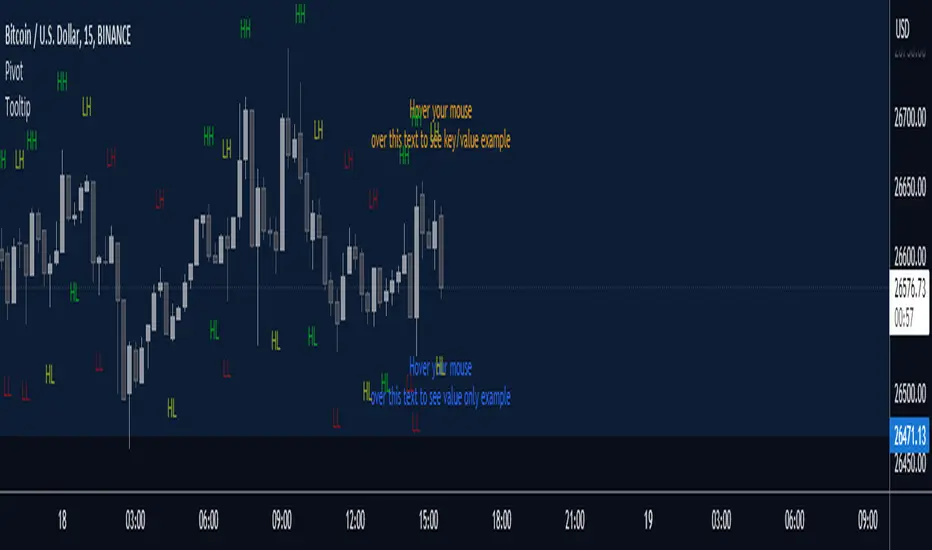
Zigzag Chart Points█ OVERVIEW
This indicator displays zigzag based on high and low using latest pine script version 5 , chart.point which using time, index and price as parameters.
Pretty much a strip down using latest pine script function, without any use of library .
This allow pine script user to have an idea of simplified and cleaner code for zigzag.
█ CREDITS
LonesomeTheBlue
█ FEATURES
1. Label can be show / hide including text can be resized.
2. Hover to label, can see tooltip will show price and time.
3. Tooltip will show date and time for hourly timeframe and below while show date only for day timeframe and above.
█ NOTES
1. I admit that chart.point just made the code much more cleaner and save more time. I previously using user-defined type(UDT) which quite hassle.
2. I have no plan to extend this indicator or include alert just I thinking to explore log.error() and runtime.error() , which I may probably release in other publications.
█ HOW TO USE'
Pretty much similar inside mentioned references, which previously I created.
█ REFERENCES
1. Zigzag Array Experimental
2. Simple Zigzag UDT
3. Zig Zag Ratio Simplified
4. Cyclic RSI High Low With Noise Filter
5. Auto AB=CD 1 to 1 Ratio Experimental
Tooltip

TooltipLibrary "Tooltip"
This library helps creating and managing nice looking data (key/value) tooltips that you can use for
labels. The tooltips data key/value will align automatically. It is optional to convert the data to a values only string too.
method addSpacesToKey(this)
Calculates the amount of spaces needed after the key to make it the key least 4 characters wide.
Namespace types: Data
Parameters:
this (Data) : (Data) The Data.
method addTabs(this, longestKeyLength)
Calculates the amount of tabs to be used.
Namespace types: Data
Parameters:
this (Data) : (Data) The Data.
longestKeyLength (int)
method longestKeyLength(this)
Returns the length of the longest key string in the array.
Namespace types: Data
Parameters:
this (Data ) : (Tooltip) The object to work with.
@return (int) The length of the key.
method toString(tooltips, withKey)
Helper function for the tooltip.
Namespace types: Data
Parameters:
tooltips (Data )
withKey (bool) : (bool) Wether to create a string with keys in it.
@return (string) The string
new()
Creates a new array to store tooltip data in
@return (Data) The data array.
Data
Key/Value pair for tooltips
Fields:
key (series string)
value (series string)
Position Size CalculatorThis is a script to make calculating position size easier. It calculates position size as a percentage of account balance and Risk/Reward based on input values of entry, exit, stoploss and shows the R/R box similar to tradingview's R/R tool. There is an option to toggle showing label and choosing of label text color.
Have to enter the following inputs in order for it to work properly
1. Account Balance : Account balance in either whatever is base currency of account
2. Risk % : Percentage of account balance to lose if stop is hit.
3. Entry
4. Stoploss
5. Target Price
Notes:
- Target Price is required for calculating R/R but is not necessary to calculate position size.
- Formula to calculate position size is : Balance * Risk % / SL %
- Formula to calculate R/R is : TP % / SL %
- SL % = ( Entry - SL ) / Entry * 100
- TP % = (TP - Entry ) / Entry * 100
Thanks to u/Chonky_ for help with feedback.
